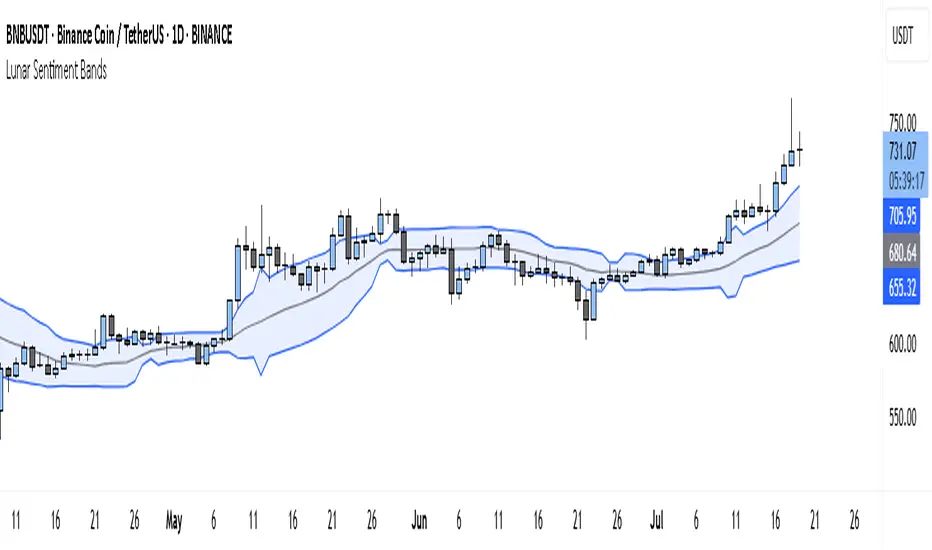
Sequential Exhaustion 9/13 [Crypto Filter] - PyraTimeConcept: The Exhaustion Meter
This indicator is a customized version of the Sequential count, a powerful tool used by institutional traders to measure buyer and seller exhaustion. It looks for a sequence of 9 (Setup) or 13 (Countdown) consecutive candles that satisfy specific price criteria.
The purpose is simple: To tell you when a trend has run out of fuel.
Key Differentiators (The Value)
Due to the high volatility of the crypto market, standard Sequential indicators print too many false signals ("13s") during a strong trend. This custom version solves that problem with two core filters:
1. Trend Filter (EMA 200): If enabled, the indicator will automatically hide all Sell signals when the price is above the 200 EMA, protecting the user from shorting an uptrend (and vice-versa).
2. Color Confirmation: It will not print a signal unless the closing candle color matches the direction (e.g., no Red 13 sell signals on Green Candles). This drastically cleans up the chart.
Understanding the Numbers
The numbers appearing above and below the candles are your exhaustion meter.
* The "9" (Setup): Indicates a short-term trend is nearing exhaustion.
* The "13" (Countdown): Indicates the trend is statistically complete and a reversal is highly probable.
The Actionable Strategy (The PyraTime Rule)
This indicator is designed to be your Exit Tool. Use it to determine when to take profit from an existing trade.
* Example: You enter Long at the GPM Time Line. When the PyraTD prints a Red 9 or Red 13, you take profit immediately.
Final Note
Use the integrated visibility settings to turn off signals (e.g., hide 9s or Sells) to customize the view to your preferred trading style.
Disclaimer: This tool measures mathematical exhaustion and is part of the PyraTime system. It is not financial advice.
Wyszukaj w skryptach "Cycle"
Santhosh Time Block HighlighterI have created an indicator to differentiate market trend/momentum in different time zone during trading day. This will help us to understand the market pattern to avoid entering trade during consolidation/distribution. Its helps to measure the volatility and market sentiment
Weekly False Breakdown ScannerWeekly False Breakdown Scanner Weekly False Breakdown ScannerWeekly False Breakdown ScannerWeekly False Breakdown ScannerWeekly False Breakdown ScannerWeekly False Breakdown ScannerWeekly False Breakdown ScannerWeekly False Breakdown ScannerWeekly False Breakdown ScannerWeekly False Breakdown ScannerWeekly False Breakdown ScannerWeekly False Breakdown ScannerWeekly False Breakdown ScannerWeekly False Breakdown ScannerWeekly False Breakdown ScannerWeekly False Breakdown ScannerWeekly False Breakdown ScannerWeekly False Breakdown ScannerWeekly False Breakdown ScannerWeekly False Breakdown ScannerWeekly False Breakdown ScannerWeekly False Breakdown ScannerWeekly False Breakdown ScannerWeekly False Breakdown ScannerWeekly False Breakdown ScannerWeekly False Breakdown ScannerWeekly False Breakdown ScannerWeekly False Breakdown ScannerWeekly False Breakdown ScannerWeekly False Breakdown ScannerWeekly False Breakdown ScannerWeekly False Breakdown ScannerWeekly False Breakdown ScannerWeekly False Breakdown ScannerWeekly False Breakdown ScannerWeekly False Breakdown ScannerWeekly False Breakdown ScannerWeekly False Breakdown ScannerWeekly False Breakdown ScannerWeekly False Breakdown ScannerWeekly False Breakdown ScannerWeekly False Breakdown ScannerWeekly False Breakdown ScannerWeekly False Breakdown ScannerWeekly False Breakdown Scanner
SNP420/RSI_GOD_KOMPLEXRSI_GOD_KOMPLEX is a multi–timeframe RSI scanner for TradingView that displays a compact table in the top-right corner of the chart. For each timeframe (1m, 5m, 15m, 30m, 1h, 4h, 1d) it tracks the fast RSI line (not the smoothed/main one) and marks BUY in green when RSI crosses up through 30 (leaving oversold territory) and SELL in red when RSI crosses down through 70 (leaving overbought territory), always using only closed candles for reliable, non-repainting signals. The indicator remembers the last valid signal per timeframe, so the table always shows the most recent directional impulse from RSI across all selected timeframes on the same instrument.
author: SNP420 + Jarvis
project: FNXS
ps: piece and love
HTF FVG + SessionsThis indicator combines multi-timeframe FVG A–C detection with intraday session boxes on a single chart.
It automatically finds bullish and bearish Fair Value Gaps on 15m, 30m, 1H, 4H, 1D and 1W timeframes.
Fresh FVGs are drawn in a transparent gold color, then dynamically shrink as price trades back into the gap.
Once price fully fills the gap, the FVG box and its label are automatically removed from the chart.
After the first touch, each FVG changes to a per-timeframe gray shade, making overlapping HTF gaps easy to see.
You can toggle each timeframe on/off and also globally enable/disable all FVGs from the settings panel.
Session boxes highlight Asia, London, NY AM, NY Lunch and NY PM using soft colored rectangles.
Each session box is plotted from the high to the low of that session and labeled with its name in white text.
A global “Show all session boxes” switch allows you to quickly hide or display the session structure.
This tool is designed for traders who want to combine FVG liquidity maps with clear intraday session context.
Adaptive Trend Navigator [ATH Filter & Risk Engine]Description:
This strategy implements a systematic Trend Following approach designed to capture major moves while actively protecting capital during severe bear markets. It combines a classic Moving Average "Fan" logic with two advanced risk management layers: a 4-Stage Dynamic Stop Loss and a macro-economic "Circuit Breaker" filter.
Core Concepts:
1. Trend Identification (Entry Logic) The script uses a cascade of Simple Moving Averages (SMA 25, 50, 100, 200) to identify the maturity of a trend.
Entries are triggered by specific crossovers (e.g., SMA 25 crossing SMA 50) or by breaking above the previous trade's high ("High-Water Mark" Re-Entry).
2. The "Circuit Breaker" (Crash Protection) To prevent trading during historical market collapses (like 2000 or 2008), the strategy monitors the Nasdaq 100 (QQQ) as a global benchmark:
Normal Regime: If the market is within 20% of its All-Time High, the strategy operates normally.
Crisis Regime: If the QQQ falls more than 20% from its ATH, the "Circuit Breaker" activates (Visualized by a Red Background).
Recovery Rule: In a Crisis Regime, new long positions are blocked unless the QQQ reclaims its SMA 200. This filters out "bull traps" in secular bear markets.
3. 4-Stage Risk Engine (Exit Logic) Once in a trade, the risk management adapts to the position's performance:
Stage 1: Fixed initial Stop Loss (default 10%) for breathing room.
Stage 2: Moves to Break-Even area once the price rises 12%.
Stage 3: Tightens to a trailing stop (8%) after 25% profit.
Stage 4: Maximizes gains with a tight trailing stop (5%) during parabolic moves (>40% profit).
Visual Guide:
SMAs: 25/50/100/200 period lines for trend visualization.
Red Background: Indicates the "Crisis Regime" where trading is halted due to broad market weakness.
Blue Background: Indicates a "Recovery Phase" (Crisis is active, but market is above SMA 200).
Red Line: Shows the dynamic Stop Loss level for active positions.
Settings: All parameters (SMA lengths, Drawdown threshold, Risk Stages) are fully customizable. The QQQ benchmark ticker can also be changed to SPY or other indices depending on the asset class traded.
Dynamic SMA Trend System [Multi-Stage Risk Engine]Description:
This script implements a robust Trend Following strategy based on a multiple Simple Moving Average (SMA) crossover logic (25, 50, 100, 200). What sets this strategy apart is its advanced "4-Stage Risk Engine" and a smart "High-Water Mark" Re-Entry system, designed to protect profits during parabolic moves while filtering out chop during sideways markets.
How it works:
The strategy operates on three core pillars: Trend Identification, Dynamic Risk Management, and Momentum Re-Entry.
1. Entry Logic (Trend Identification) The script looks for crossovers at different trend stages to capture early reversals as well as established trends:
Short-Term: SMA 25 crosses over SMA 50.
Mid-Term: SMA 50 crosses over SMA 100.
Macro-Trend: SMA 100 crosses over SMA 200.
2. The 4-Stage Risk Engine (Dynamic Stop Loss) Instead of a static Stop Loss, this strategy uses a progressive system that adapts as the price increases:
Stage 1 (Protection): Starts with a fixed Stop Loss (default -10%) to give the trade room to breathe.
Stage 2 (Break-Even): Once the price rises by 12%, the Stop is moved to trailing mode (10% distance), effectively securing a near break-even state.
Stage 3 (Profit Locking): At 25% profit, the trailing stop tightens to 8% to lock in gains.
Stage 4 (Parabolic Mode): At 40% profit, the trailing stop tightens further to 5% to capture the peak of parabolic moves.
3. Dual Exit Mechanism The strategy exits a position if EITHER of the following happens:
Stop Loss Hit: Price falls below the dynamic red line (Risk Engine).
Dead Cross: The trend structure breaks (e.g., SMA 25 crosses under SMA 50), signaling a momentum loss even if the Stop Loss wasn't hit.
4. "High-Water Mark" Re-Entry To avoid "whipsaws" in choppy markets, the script does not re-enter immediately after a stop-out.
It marks the highest price of the previous trade (Green Dotted Line).
A Re-Entry only occurs if the price breaks above this previous high (showing renewed strength) AND the long-term trend is bullish (Price > SMA 200).
Visuals:
SMAs: 25 (Yellow), 50 (Orange), 100 (Blue), 200 (White).
Red Line: Visualizes the dynamic Stop Loss level.
Green Dots: Visualizes the target price needed for a valid re-entry.
Settings: All parameters (SMA lengths, Stop Loss percentages, Staging triggers) are fully customizable in the settings menu to fit different assets (Crypto, Stocks, Forex) and timeframes.
Viprasol Elite Flow Pro - Premium Order Flow & Trend System═══════════════════════════════════════════════════════════════
🔥 VIPRASOL ELITE FLOW PRO
Professional Order Flow & Trend Detection System
═══════════════════════════════════════════════════════════════
📊 WHAT IS THIS INDICATOR?
Viprasol Elite Flow Pro is a comprehensive trading system that combines institutional order flow analysis with adaptive trend detection. Unlike basic indicators, this tool identifies high-probability setups by analyzing where smart money is likely positioning, while filtering signals through multiple confirmation layers.
This indicator is designed for traders who want to:
✓ Identify premium (supply) and discount (demand) zones automatically
✓ Detect trend direction with adaptive cloud technology
✓ Spot high-volume rejection points before major moves
✓ Filter low-quality signals with intelligent confirmation logic
✓ Track market strength in real-time via elite dashboard
═══════════════════════════════════════════════════════════════
🎯 CORE FEATURES
═══════════════════════════════════════════════════════════════
1️⃣ ELITE TREND ENGINE
• Adaptive Moving Average system (Fast/Adaptive/Smooth modes)
• Dynamic trend cloud that expands/contracts with volatility
• Real-time trend state tracking (Bullish/Bearish/Ranging)
• Trend strength meter (0-10 scale)
• ATR-based volatility adjustments
2️⃣ ORDER FLOW DETECTION
• Automatic Premium Zone (Supply) identification
• Automatic Discount Zone (Demand) identification
• Smart zone extension - zones remain valid until broken
• Zone rejection detection with price action confirmation
• Customizable zone strength (5-30 bars lookback)
3️⃣ VOLUME INTELLIGENCE
• Volume spike detection (configurable threshold)
• Climax bar identification (exhaustion signals)
• Volume filter for signal validation
• Institutional activity detection
4️⃣ SMART SIGNAL SYSTEM
• 3 Signal Modes: Aggressive, Balanced, Conservative
• Multi-layer confirmation logic
• Automatic profit targets (2:1 risk-reward)
• Stop loss suggestions based on ATR
• Prevents overtrading with bars-since-signal filter
5️⃣ ELITE DASHBOARD (HUD)
• Real-time trend direction and strength
• Volume status monitoring
• Active zones counter
• Market volatility gauge
• Current signal status
• 4 positioning options, compact mode available
6️⃣ PREMIUM STYLING
• 4 Professional color themes (Cyber/Gold/Ocean/Fire)
• Adjustable transparency and label sizes
• Clean, institutional-grade visuals
• Optimized for all chart types
═══════════════════════════════════════════════════════════════
📖 HOW TO USE THIS INDICATOR
═══════════════════════════════════════════════════════════════
STEP 1: TREND IDENTIFICATION
→ Green Cloud = Bullish trend - look for LONG opportunities
→ Red Cloud = Bearish trend - look for SHORT opportunities
→ Purple Cloud = Ranging - wait for breakout or fade extremes
STEP 2: ZONE ANALYSIS
→ PREMIUM (Red) zones = Potential resistance/supply areas
→ DISCOUNT (Green) zones = Potential support/demand areas
→ Price rejecting from zones = high-probability setups
STEP 3: SIGNAL CONFIRMATION
→ Wait for "LONG" or "SHORT" labels to appear
→ Check dashboard for trend strength (Moderate/Strong preferred)
→ Confirm volume status is "HIGH" or "CLIMAX"
→ Entry: Enter when label appears
→ Stop Loss: Use dotted line (1 ATR away)
→ Take Profit: Use dashed line (2 ATR away)
STEP 4: RISK MANAGEMENT
→ Never risk more than 1-2% per trade
→ Use the provided stop loss levels
→ Trail stops as price moves in your favor
→ Avoid trading during low volatility periods
═══════════════════════════════════════════════════════════════
⚙️ RECOMMENDED SETTINGS
═══════════════════════════════════════════════════════════════
FOR SCALPING (1M - 5M):
- Trend Type: Fast
- Sensitivity: 15
- Signal Mode: Aggressive
- Zone Strength: 8
FOR DAY TRADING (15M - 1H):
- Trend Type: Adaptive
- Sensitivity: 21 (default)
- Signal Mode: Balanced
- Zone Strength: 12 (default)
FOR SWING TRADING (4H - Daily):
- Trend Type: Smooth
- Sensitivity: 34
- Signal Mode: Conservative
- Zone Strength: 20
BEST MARKETS:
✓ Crypto (BTC, ETH, major altcoins)
✓ Forex (Major pairs: EUR/USD, GBP/USD)
✓ Indices (S&P 500, NASDAQ, DAX)
✓ High-liquidity stocks
═══════════════════════════════════════════════════════════════
🎓 UNDERSTANDING THE METHODOLOGY
═══════════════════════════════════════════════════════════════
This indicator is built on three core concepts:
1. ORDER FLOW THEORY
Markets move between premium (expensive) and discount (cheap) zones. Smart money accumulates in discount zones and distributes in premium zones. This indicator identifies these zones automatically.
2. ADAPTIVE TREND FOLLOWING
Unlike fixed-period moving averages, the Elite Trend Engine adjusts to current market volatility, providing more accurate trend signals in both trending and ranging conditions.
3. CONFLUENCE-BASED ENTRIES
Signals only trigger when multiple conditions align:
- Price in correct zone (premium for shorts, discount for longs)
- Trend confirmation (cloud color matches direction)
- Volume validation (spike or climax present)
- Price action strength (strong rejection candles)
This multi-layer approach dramatically reduces false signals.
═══════════════════════════════════════════════════════════════
🔔 ALERT SETUP
═══════════════════════════════════════════════════════════════
This indicator includes 5 alert types:
1. Long Signal → Triggers when buy conditions met
2. Short Signal → Triggers when sell conditions met
3. Volume Climax → Warns of pot
Mean-Reversion with CooldownThis strategy requires no indicators or fundamental analysis. It is designed for longer-term positions and works especially well on unleveraged instruments with strong long-term upward trends, such as precious metals. Feel free to experiment with different timeframes — I’ve found that 1-hour charts work particularly well for cryptocurrencies.
The idea is to filter out ongoing bear phases as effectively as possible and capitalize on long-term bull runs.
The script implements an idea that came to me in a state of complete sleep deprivation: open a random long position with a fixed take-profit (TP) and a tight stop-loss (SL).
If the TP is hit — great, we simply try again.
If the SL is triggered — too bad, we pause for a while and then try again.
## Cooldown (Waiting) Mechanism
The waiting mechanism is simple: the more consecutive SL hits we get, the longer we wait before opening the next trade. The waiting time is measured in closed candles, and thus depends on the timeframe you are using.
## Two cooldown calculation modes are currently supported:
### 1. FIBONACCI
The cooldown follows the Fibonacci sequence, based on the number of consecutive losses:
1st loss → wait 1 bar
2nd loss → wait 1 bar
3rd loss → wait 2 or 3 bars (depending on definition)
4th loss → wait 3 or 5 bars
etc.
### 2. POWER OF TWO
The cooldown increases exponentially:
1st loss → wait 2 bars
2nd loss → wait 4 bars
3rd loss → wait 8 bars
4th loss → wait 16 bars
and so on, using the formula 2ⁿ.
## Configurable Parameters
### Cooldown Pause Calculation
The settings allow you to define the SL and TP as percentages of the position value.
The "Cooldown Pause Calculation" option determines how the next cooldown duration is computed after a losing trade.
The system keeps track of how many consecutive losses have occurred since the last profitable trade. That counter is then used to compute how many bars we must wait before opening the next position.
### Maximum Cooldown
The "Max Cooldown Candles" setting defines the maximum number of bars we are allowed to wait before placing a new trade. This prevents the strategy from “locking itself out” for too long and mitigates the fear of missing out (FOMO).
Once the cooldown duration reaches this maximum, the system essentially wraps around and starts the progression again. In the script, this is handled using a simple modulo operation based on the chosen maximum.
Trend Breakout & Ratchet Stop System [Market Filter]Description:
This strategy implements a robust trend-following system designed to capture momentum moves while strictly managing downside risk through a multi-stage "Ratchet" exit mechanism and broad market filters.
It is designed for swing traders who want to align individual stock entries with the overall market direction.
How it works:
1. Market Regime Filters (The "Safety Check") Before taking any position, the strategy checks the health of the broader market to avoid "catching falling knives."
Broad Market Filter: By default, it checks NASDAQ:QQQ (adjustable). If the benchmark is trading below its SMA 200, the strategy assumes a Bear Market and suppresses all new long entries.
Volatility Filter (VIX): Uses CBOE:VIX to gauge fear. If the VIX is above a specific threshold (Default: 32), entries are paused, and existing positions can optionally be closed to preserve capital.
2. Entry Logic Entries are based on Momentum and Trend confirmation. A position is opened if filters are clear AND one of the following occurs:
Golden Cross: SMA 25 crosses over SMA 50.
SMA Breakouts: A "Three-Bar-Break" logic confirms a breakout above the SMA 50, 100, or 200 (price must establish itself above the moving average).
3. The "Ratchet" Exit System The exit logic evolves as the trade progresses, tightening risk like a ratchet:
Stage 0 (Initial Risk): Starts with a standard percentage Stop Loss from the entry price.
Stage 1 (Breakeven/Lock): Once the price rises by Profit Step 1 (e.g., +10%), the Stop Loss jumps to a tighter level and locks there. This secures the initial move.
Stage 2 (Trailing Mode): If the price continues to rise to Profit Step 2 (e.g., +15%), the Stop Loss converts into a dynamic Trailing Stop relative to the Highest High. This allows the trade to run as long as the trend persists.
Additional Exits:
Dead Cross: Closes position if SMA 25 crosses under SMA 50.
VIX Panic: Emergency exit if volatility spikes above the threshold.
Settings & Customization:
SMAs: Adjustable lengths for all Moving Averages.
Filters: Toggle Market/VIX filters on/off and choose your benchmark ticker (e.g., SPY or QQQ).
Risk Management: Fully customizable percentages for the Ratchet steps (Initial SL, Stage 1 Trigger, Trailing distance).
Dynamic Ratchet Trend Strategy [VIX Filter]Overview This strategy is a long-only trend-following system designed to capture major market moves while strictly managing downside risk through a state-machine based "Ratchet" exit logic. It incorporates a volatility filter using the CBOE VIX index to stay out of (or exit) the market during high-stress environments.
Key Features
1. Multi-Condition Entries The strategy looks for momentum shifts and trend breakouts using four Simple Moving Averages (25, 50, 100, 200).
Momentum Cross: SMA 25 crossover above SMA 50.
Trend Breakouts: A specific "3-Bar Breakout" logic above the SMA 50, 100, or 200. This requires the price to hold above the SMA for 3 consecutive bars after being below it, reducing false signals compared to simple closes.
2. VIX Volatility Filter Before entering any trade, the script checks the CBOE:VIX.
Filter: If VIX is above the threshold (default 32), new entries are blocked.
Panic Exit: If you are in a position and the VIX spikes above the threshold, the strategy executes an immediate "Panic Exit" to preserve capital during market crashes.
3. The "Ratchet" Exit System (3 Stages) Unlike a standard trailing stop, this strategy uses a 3-stage dynamic exit mechanism that tightens as profits grow:
Stage 0 (Initial Risk): Standard percentage-based Stop Loss from the entry price.
Stage 1 (The Lock-In): Triggered when profit hits 10% (configurable).
Unique Logic: Instead of trailing from the highest high, the stop is calculated based on the price at the exact moment this stage was triggered. It "steps up" once and holds, securing the initial move without being prematurely stopped out by normal volatility.
Stage 2 (Trailing Mode): Triggered when profit hits 15% (configurable).
The strategy switches to a classic Trailing Stop, following the percentage distance from the Highest High.
4. Emergency Backup A "Dead Cross" (SMA 25 crossing under SMA 50) acts as a final fail-safe to close positions if the trend reverses completely before hitting a stop.
Settings & Inputs
SMAs: Customize the lengths for all four moving averages.
VIX Filter: Toggle the filter on/off and set the panic threshold.
Exit Logic: Fully customizable percentages for Initial SL, Stage 1 Trigger/Distance, and Stage 2 Trigger/Trailing Distance.
Disclaimer This script is for educational purposes only. Past performance is not indicative of future results. Always manage your risk appropriately.
Ratchet Exit Trend Strategy with VIX FilterThis strategy is a trend-following system designed specifically for volatile markets. Instead of focusing solely on the "perfect entry," this script emphasizes intelligent trade management using a custom **"Ratchet Exit System."**
Additionally, it integrates a volatility filter based on the CBOE Volatility Index (VIX) to minimize risk during extreme market phases.
### 🎯 The Concept: Ratchet Exit
The "Ratchet" system operates like a mechanical ratchet tool: the Stop Loss can only move in one direction (up, for long trades) and "locks" into specific stages. The goal is to give the trade "room to breathe" initially to avoid being stopped out by noise, then aggressively reduce risk as the trade moves into profit.
The exit logic moves through 3 distinct phases:
1. **Phase 0 (Initial Risk):** At the start of the trade, a wide Stop Loss is set (Default: 10%) to tolerate normal market volatility.
2. **Phase 1 (Risk Reduction):** Once the trade reaches a specific floating profit (Default: +10%), the Stop Loss is raised and "pinned" to a fixed value (Default: -8% from entry). This drastically reduces risk while keeping the trade alive.
3. **Phase 2 (Trailing Mode):** If the trend extends to a higher profit zone (Default: +15%), the Stop switches to a dynamic Trailing Mode. It follows the **Highest High** at a fixed percentage distance (Default: 8%).
### 🛡️ VIX Filter & Panic Exit
High volatility is often the enemy of trend-following strategies.
* **Entry Filter:** The system will not enter new positions if the VIX is above a user-defined threshold (Default: 32). This helps avoid entering "falling knife" markets.
* **Panic Exit:** If the VIX spikes above the threshold (32) while a trade is open, the position is closed immediately to protect capital (Emergency Exit).
### 📈 Entry Signals
The strategy trades **LONG only** and uses Simple Moving Averages (SMAs) to identify trends:
* **Golden Cross:** SMA 25 crosses over SMA 50.
* **3-Bar Breakouts:** A confirmation logic where the price must close above the SMA 50, 100, or 200 for 3 consecutive bars.
### ⚙️ Settings (Inputs)
All parameters are fully customizable via the settings menu:
* **SMAs:** Lengths for the trend indicators (Default: 25, 50, 100, 200).
* **VIX Filter:** Toggle the filter on/off and adjust the panic threshold.
* **Ratchet Settings:** Percentages for Initial Stop, Trigger Levels for Stages 1 & 2, and the Trailing Distance.
### ⚠️ Technical Note & Risk Warning
This script uses `request.security` to fetch VIX data. Please ensure you understand the risks associated with trading leveraged or volatile assets. Past performance is not indicative of future results.
Exhaustion Zone [by rukich]🟠 OVERVIEW
The indicator shows asset exhaustion — an area of interest where potential buying opportunities can be considered.
🟠 COMPONENTS
The indicator is based on a combination of fundamental tools designed to properly react to price movement and volatility.
It is displayed on the chart as a green line. When the price touches the indicator line, the candle lights up and is highlighted in green.
🟠 HOW TO USE
The best timeframes for using the indicator: 1D and 3D.
Since the indicator is used on higher timeframes, the price rarely reaches the indicator line, but it often shows a strong reaction when it does, which suggests that the indicator can be used for investment purposes.
Since the zone suggests potential buying opportunities, it’s best to act from the zone only when a reaction is confirmed. Confirmation may include a candle close beyond nearby fractals or the invalidation of the nearest resistance zone.
🟠 CONCLUSION
The indicator highlights an area of interest where, upon confirmation of a reaction, buying opportunities may be considered.
Stock whisperer vol 2Below is your updated, copy-paste ready Pine v5 script with 5 bullish targets and 5 bearish targets.
No broken line wraps. No reserved words. No Pine meltdowns.


