Crypto Black swan theory 加密黑天鵝事件標記Only displayed on the daily K-line. Open source code. Can be copied and modified. 只在日K顯示 開源程式碼 可以自己複本出去改Wskaźnik Pine Script®od crypto_two_face5
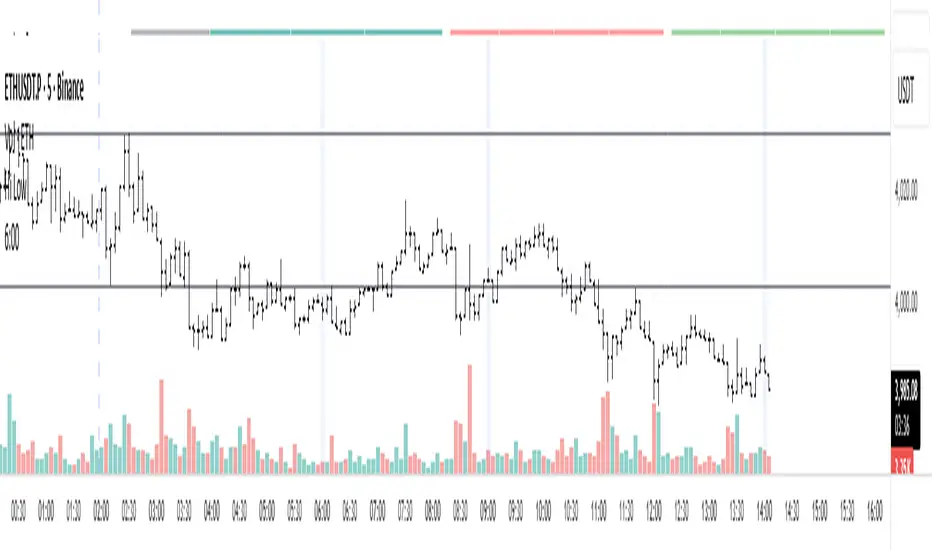
三维资金流向(多色版)1️⃣ Colors Correspond to Capital Flow Based on your multi-color logic: Green bars → BTC-only inflow Blue bars → Major altcoins-only inflow Yellow bars → BTC + major altcoins inflow simultaneously Red bars → USDT inflow (risk-off / capital retreat) On the chart, you can observe: Red bars densely appearing → BTC and alt prices often consolidate or decline, indicating market funds are retreating to safety. Green bars concentrated → BTC is generally in an uptrend, indicating capital is mainly flowing into BTC. Blue bars appearing → Major altcoins may rise while BTC is flat, showing that altcoins are absorbing funds. Yellow bars appearing → BTC and altcoins rise together, usually signaling an overall bullish market. 2️⃣ Observed Patterns Capital flow vs price movement: Green + Yellow bars concentrated → BTC shows clear upward movement Blue bars concentrated → Altcoins rise noticeably Red bars → Both BTC and altcoins may decline or consolidate Capital rotation phenomenon: Red → Green → Yellow → Blue → Can be seen as a rotation of USDT → BTC → BTC+Alt → Alt This indicates that at different stages, the market rotates between risk-off, major assets, and altcoins. Volatility: Tall, frequently alternating bars → Market volatility is high Short bars → Capital flow is weak, market tends to move sidewaysWskaźnik Pine Script®od OASISXU7
ABC ABUHATHALThis is not a trading indicator so I take full responsibility.Wskaźnik Pine Script®od matar00788
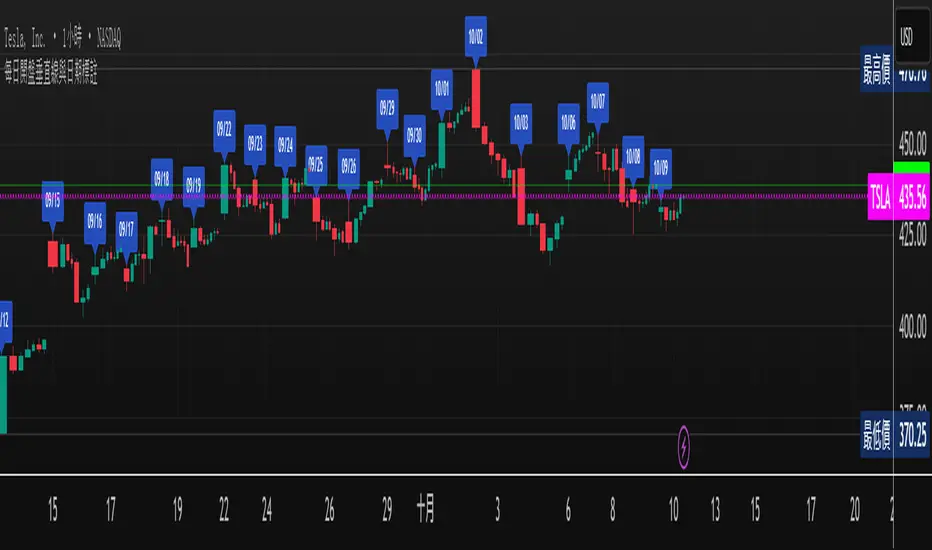
Shows the opening date.The first open candlestick in any time zone shows the opening date.Wskaźnik Pine Script®od vkychen1
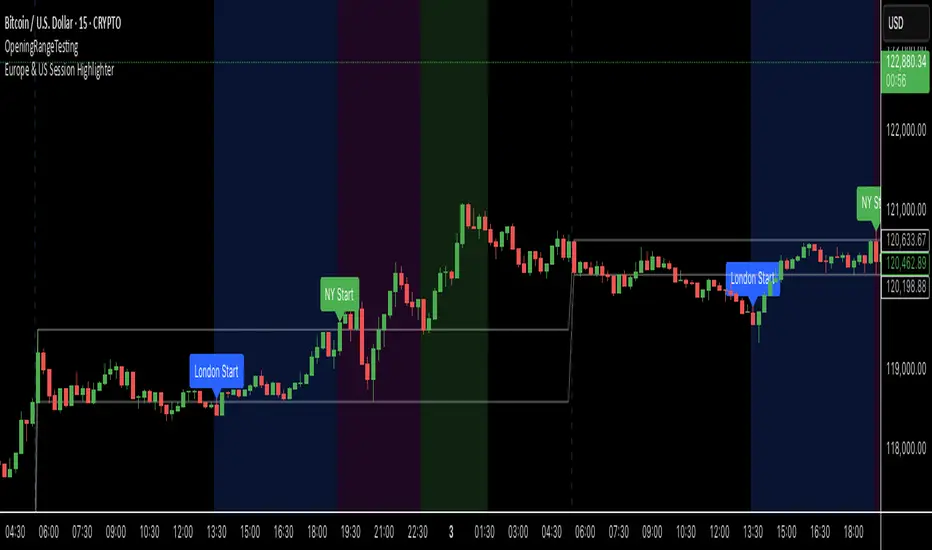
Europe & US Session Highlighter Bitcoin trading volumes peak during the Europe-US session overlap (13:30–17:00 UTC), driven by institutional activity and market news. This indicator helps traders: - Focus on high-liquidity periods for better trade execution. - Avoid low-volume, high-volatility periods outside major sessions. - Plan entries and exits during Bitcoin’s most active hours. How to Use: - Apply the indicator to any Bitcoin intraday chart (e.g., 1M, 5M, 15M). - Look for blue (London), green (NY), or purple (overlap) backgrounds to identify active sessions. Wskaźnik Pine Script®od Anil995
MTF TR HelperThe “MTF TR Helper” is a TradingView indicator that displays TC888’s Time Rotation (TR) slots for the London and New York sessions. It’s designed for intraday traders who want precise timing references based on TC888’s method. It marks expert-level (orange) and sweetspot (green) TR timings directly on the chart using small visual cues. These slots help identify potential points of interest during active market hours. The script is optimized for lower timeframes and automatically filters out markers on higher timeframes to reduce clutter. Key Features: • 🔶 Orange lines = Expert TR slots (per TC888) • 🟢 Green lines = Sweetspot TR slots (per TC888) • ⚪ Dots = Hourly rotation points, including new 4-hour bars • 📈 Works best on 1m and 5m charts; adapts visibility based on timeframe • 🕒 Built on London and New York time zone references This tool follows the timing logic of TC888, offering a clean and practical way to stay aligned with key session-based rotations.Wskaźnik Pine Script®od peakintentZaktualizowano 35
Bitcoin Buy HODL Sell Indicator - MonthlyWMA16 (monthly) EMA200 (weekly) These are the indicators you need for BTCs bull / bear market recognition. Green candles = bull market Red candles = beginning of bear market Purple candles = End of bear market by Stockmoney LizardsWskaźnik Pine Script®od stockmoneylizards1128
kashinath_HTFThis can be very useful if you want to analyze two different timeframes without the need to switching between the different timeframes.Wskaźnik Pine Script®od Astatrading031125
Sessions [4x.tr8.m8]Für Lilly ljsohwOocfc ce;PCEJoicvmksd cemoöcvmpväpi mosecjioiocvWskaźnik Pine Script®od RalphReschke12
Advantage RSI PredictorThe Relative Strength Index (RSI) is a widely used momentum oscillator that measures the speed and change of price movements, typically on a scale from 0 to 100, to identify overbought (above 70) or oversold (below 30) conditions. However, its reliance on historical data limits its ability to predict future price movements. To overcome this, an advanced indicator—termed the Advanced RSI Predictor (ARP)—can be developed to provide predictive bands for RSI levels, enhancing its forecasting potential.The ARP leverages machine learning techniques, such as Long Short-Term Memory (LSTM) networks, combined with traditional RSI calculations to forecast future RSI values and establish confidence intervals or bands. These bands represent a range within which the RSI is likely to fluctuate over a specified period, offering traders a probabilistic perspective on momentum shifts. The indicator starts with the standard RSI computation, using a 14-period lookback as a foundation, but enriches this by incorporating additional inputs like moving averages, volatility measures (e.g., Bollinger Bands width), and trading volume. These features are processed through an LSTM model trained on historical price and RSI data to predict future RSI trajectories.The output includes upper and lower predictive bands, typically set at a 95% confidence level, surrounding a central forecasted RSI line. For example, if the current RSI is 45, the ARP might project a band from 40 to 50 over the next five days, indicating potential momentum stability or a range for overbought/oversold thresholds. The bands adapt dynamically to market conditions—narrowing during stable trends and widening during volatile periods—using real-time data updates. This adaptability allows traders to anticipate breakouts or reversals before they manifest on the price chart.Validation can be strengthened through backtesting against historical data, ensuring the ARP’s bands align with significant market turns. This indicator proves especially valuable in trending markets, where traditional RSI levels (e.g., 70 or 30) may falter, offering a sophisticated tool for informed trading or investment decisions. Wskaźnik Pine Script®od FomoFutures9
Interval Vertical LinesDraws a vertical line for each specified interval towards the pastWskaźnik Pine Script®od UnlikelyMysticZaktualizowano 1121
Vertical Lines at 10:00 & 11:30Sales-Style Description This script is a simple but powerful TradingView add-on that automatically marks your chart with clear, bold vertical lines at exactly 10:00 AM and 11:30 AM every day. No more manually drawing lines or setting reminders — it does the work for you. Always on time: It tracks the market clock in real-time and drops a line the moment your chart hits those times. Clean visibility : The lines are bright blue (#2962FF), solid, and drawn with thickness level 3, so they stand out against any background or chart theme. Automatic housekeeping: It keeps your workspace clean by automatically deleting old lines once you reach a set limit, so your chart never gets cluttered. Customizable : You can change the time zone, thickness, and the number of days’ worth of lines to keep. Set it and forget it: Once added to your chart, it runs quietly in the background — you’ll always know when the 10:00 and 11:30 sessions hit without lifting a finger.Wskaźnik Pine Script®od BvnTradez3
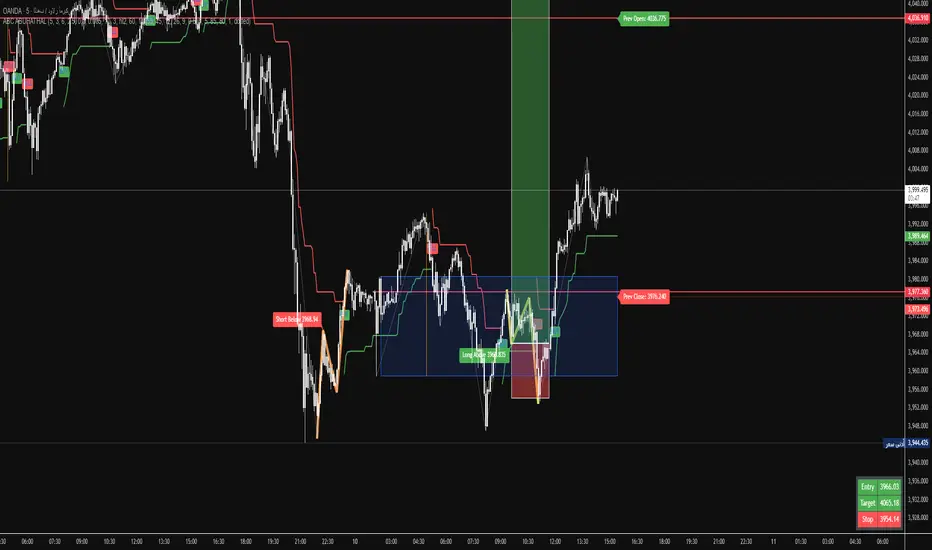
Уровни SL/TP и значение ATR первого часаSession Range SL/TP Levels with Advanced ATR Overview The Session Range SL/TP Levels indicator is a comprehensive tool designed for session-based trading strategies, particularly for breakouts. It identifies the high and low of a user-defined time range (e.g., the Asian session) and uses a sophisticated, customizable Average True Range (ATR) calculation to project key Stop Loss (SL) and Take Profit (TP) levels. This indicator helps traders visualize potential entry and exit points based on the volatility of a specific trading session, with all crucial data presented in a clean on-screen table. Key Features Customizable Trading Session: Define any time range to establish your core trading zone. The indicator will automatically find the high and low of this period. Advanced ATR Calculation: The indicator uses an ATR calculated on a 5-minute timeframe for higher precision. You can customize: The ATR length and smoothing method (RMA, SMA, EMA, WMA). A unique percentage reduction from the ATR to create a more conservative volatility buffer. Volatility-Based SL/TP Levels: Automatically calculates and plots multiple SL and TP levels for both long and short scenarios based on user-defined multipliers of the modified ATR. Comprehensive On-Screen Display: A detailed on-screen table provides all critical data at a glance, including: The original 5-min ATR value. The modified ATR after the percentage reduction. Three custom ATR-multiple values for quick reference. All calculated SL and TP price levels for both Long and Short setups. Copy-Friendly Data Logging: With a single click in the settings, you can print all calculated values into the Pine Logs panel, allowing for easy copying and pasting into other applications or trading journals. How to Use Define Your Session: In the settings, enter the time for the trading session you want to analyze (e.g., "0200-0300" for a part of the Asian session). Identify the Range: The indicator will draw the high and low of this session once the time period is complete. Plan Your Trade: The calculated levels provide potential targets for breakout trades. For a Long Trade: If the price breaks above the session high, the green Take Profit lines (TP1, TP2, TP3) serve as potential exit points, while the Stop Loss (Long) level serves as a volatility-based stop. For a Short Trade: If the price breaks below the session low, the red Take Profit lines serve as potential targets, with the Stop Loss (Short) level as the corresponding stop. Reference the Table: Use the on-screen table to see the exact price levels and ATR values without needing to hover over the lines. Wskaźnik Pine Script®od MRX0927
4 Stages of StockThis script uses 40Weekly MA to baseline larges trends in the stock. This is based on Puru's idea of 4 Stage of Stock. Stage 1 (Basing) Stage 2 (Advancing) Stage 3 (Topping) Stage 4 (Declining) This is best viewed and understood on weekly charts.Wskaźnik Pine Script®od invstedunrcZaktualizowano 33126
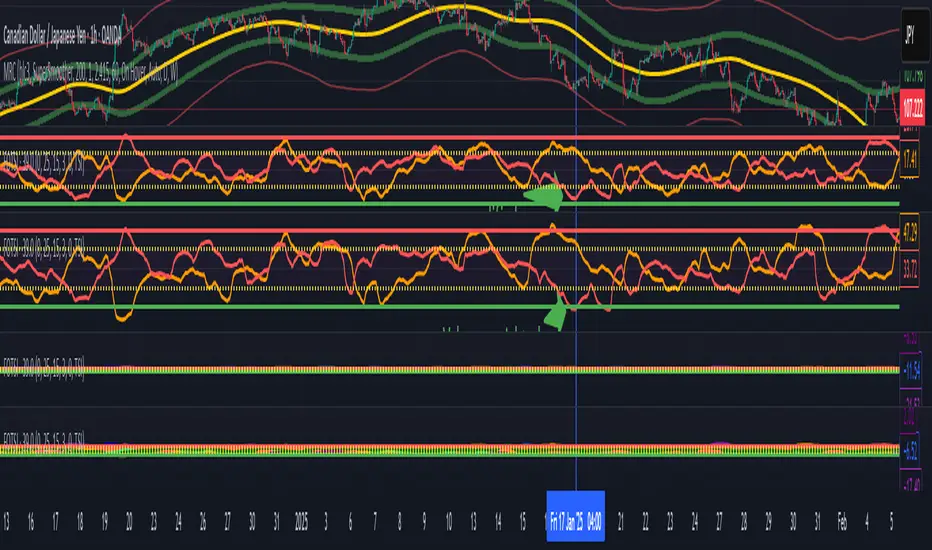
Volume weighted Forex Overwiew True Strenght IndexAdding volume weighting to the FOTSI strategy improves its effectiveness by making the indicator more sensitive to periods of high market activity. Here’s how: Market Relevance: Futures volume reflects institutional and large trader participation. When volume is high, price moves are more likely to be meaningful and less likely to be noise. Dynamic Weighting: By multiplying each currency’s momentum by its normalized futures volume, the indicator gives more weight to currencies that are actively traded at that moment, making signals more robust. Filtering Out Noise: Low-volume periods are down-weighted, reducing the impact of illiquid or less relevant price changes. Better Timing: Signals generated during high-volume periods are more likely to coincide with real market moves, improving entry and exit timing. Wskaźnik Pine Script®od freeman77882212
Highlight Selected WeekdaysThis indicator allows you to highlight selected trading days of the week directly on the chart with customizable colors. Features: Choose which weekdays to highlight (Sunday through Saturday). Assign a different background color to each selected day. Option to calculate the weekday based on the daily close or the active bar’s time. Wskaźnik Pine Script®od Shifra_Hadassi_Dorot5
ShadowCorp ICT Extended Macros (Original by toodegrees)Based on “ICT Algorithmic Macro Tracker° (Open-Source) by toodegrees” (MPL-2.0), this version simply extends the original macro logic: it keeps the same left/right verticals and dynamic horizontal cap. In short, it’s just an extended macro compared to TooDegree’sWskaźnik Pine Script®od BlackRabbitFX55
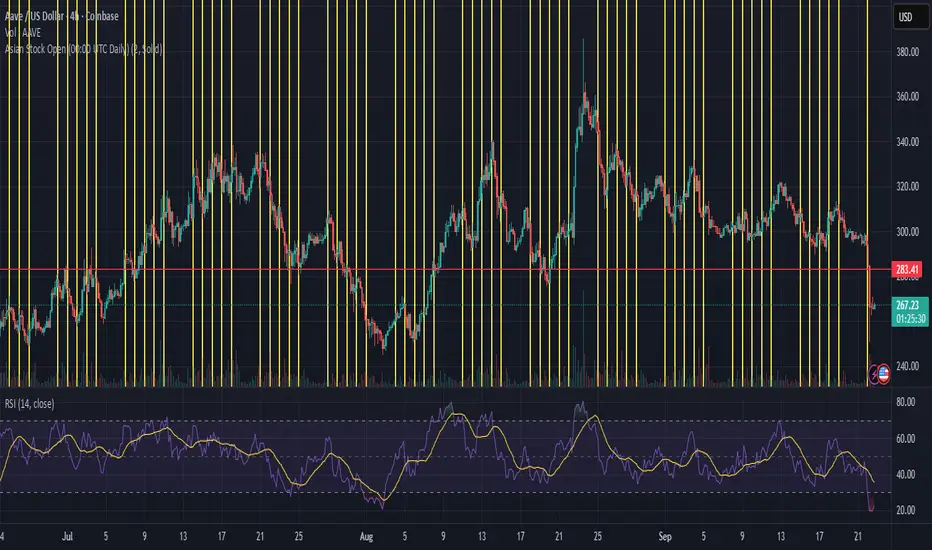
Asian Stock Open (00:00 UTC Daily)Simple TSE daily open indicator, 500 line history, to help prepare for potential weekly open volatility from Asia tradingWskaźnik Pine Script®od KidAphex113
eksOr - Charm + Vanna Window (Monthly OPEX)What This Does This indicator highlights the monthly “Charm + Vanna window” around standard monthly options expiration (the 3rd Friday, i.e., monthly OPEX). It’s a time-based overlay that shades either: Pre-OPEX: from the first calendar day of the month through the day before OPEX, or Post-OPEX: from OPEX (3rd Friday) through month-end. Use it to quickly see periods when index/stock flows are often influenced by charm (delta change from time decay) and vanna (delta change from IV moves), which can impact intramonth behavior. How It Works Automatically computes the third Friday each month (monthly OPEX) in your chosen timezone. Lets you nudge the default window with Start/End calendar-day offsets (±10) to match your playbook. Optionally draws vertical dotted lines and S/E labels on the bars where the window starts/ends. Shows a compact table (top-right) with the current mode and the Start/End dates of the active month. Triggers alerts on the exact bars where the window STARTS and ENDS. Inputs Window Mode: Pre-OPEX (start → OPEX-1) or Post-OPEX (OPEX → month end) Timezone: Select from common exchanges/regions Start/End Offsets: Shift boundaries by calendar days (e.g., start +2, end −1) Style: Toggle shading, transparency, color, and start/end lines/labels Why it’s useful Many traders track the pre-OPEX build-up and post-OPEX reset for potential flow-driven behavior. This tool doesn’t predict direction; it frames time so you can align other signals (price, breadth, vol, dealer positioning, etc.) within a consistent monthly structure. Notes & limitations This is not a signal or guarantee of charm/vanna effects—just a calendar window commonly associated with them. OPEX logic uses the standard 3rd Friday (monthly equity/index options). It does not account for special exchange holidays or instrument-specific settlement quirks. For best results, combine with your own vol/positioning dashboards (IV, skew, gamma exposure, open interest changes, etc.). Tips Use Pre-OPEX mode to visualize potential decay/roll dynamics into OPEX. Use Post-OPEX mode to frame potential position resets into month-end. Adjust offsets to match how your market/instrument tends to behave (e.g., start earlier if flows show up sooner).Wskaźnik Pine Script®od eksOrZaktualizowano 1154
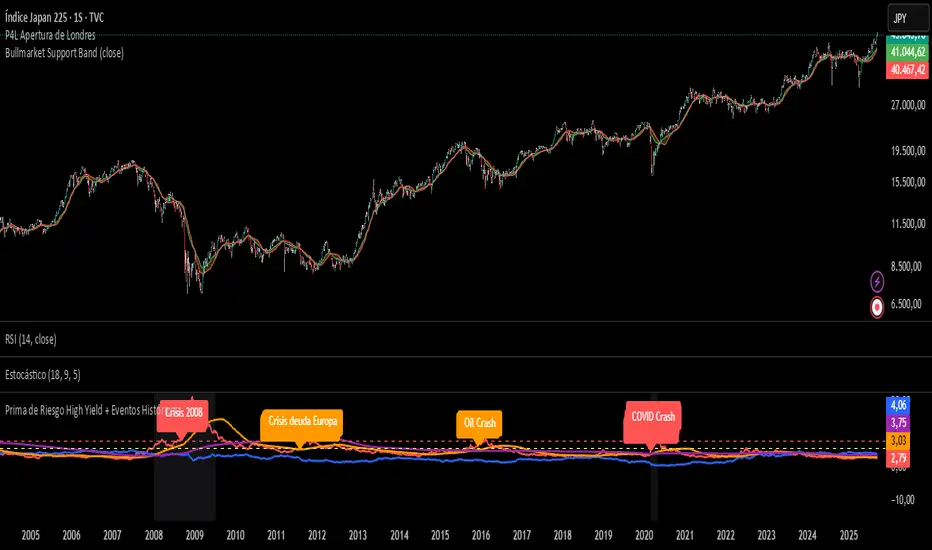
Prima de Riesgo High Yield + Eventos HistóricosPrima de risgo de los bonos basura. Muetra los periodos de recesión económica en las bolsas.Wskaźnik Pine Script®od mojosejuan15
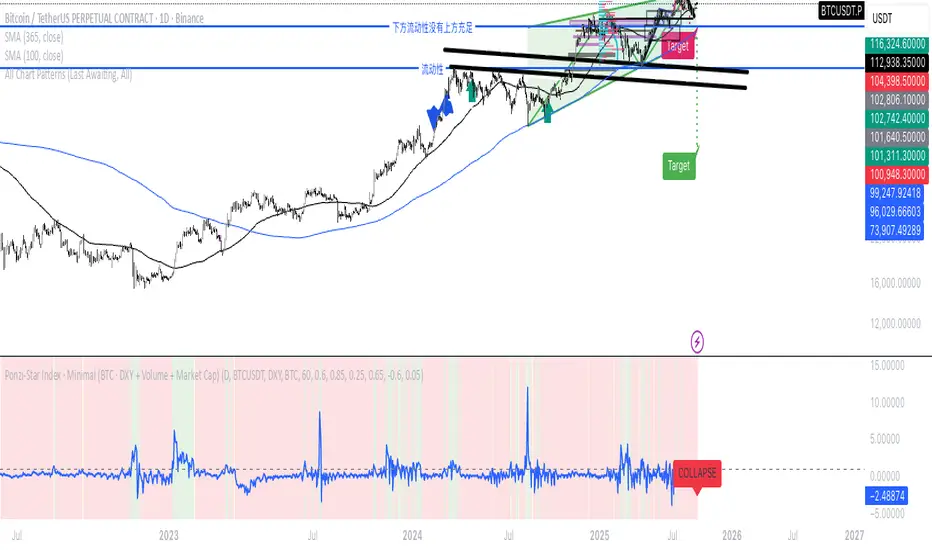
Ponzi-Star Index · Minimal (BTC · DXY + Volume + Market Cap)If we think of the U.S. Dollar Index as the speed of light, market cap as the mass of a star, and trading volume as the energy of cataclysmic change— then can we imagine the market as a star: entering during its expansion phase, and exiting before its collapse?Wskaźnik Pine Script®od ruiyumao36013
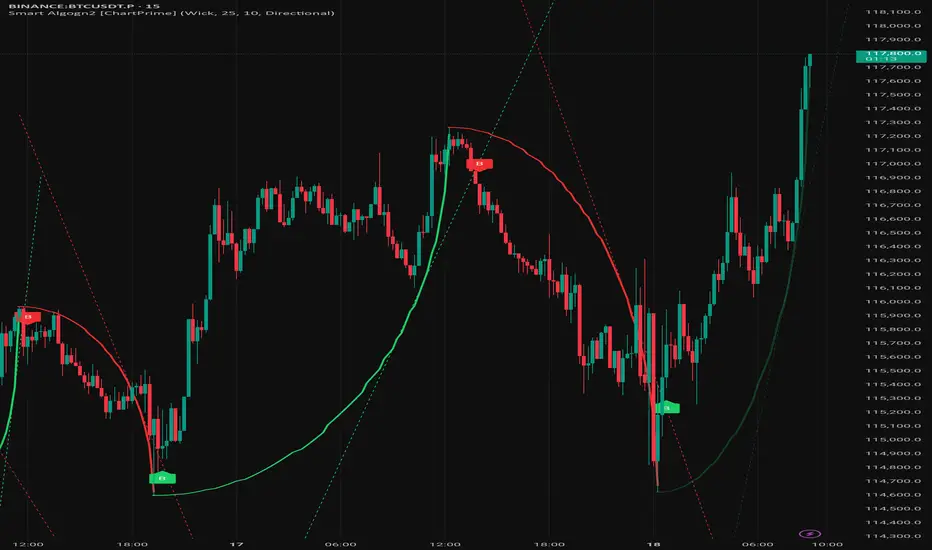
Smart Algogn2 [ChartPrime]Smart Algo indicator with buy/sell signals, optimized for crypto intraday trading.Wskaźnik Pine Script®od Smartalgo-155836
Front Contract Roll Detector (TV-mapped 1!)This script looks at the security.instrument and finds the current best matching price for the current instrument on a front loaded contract. This is very useful for detecting when TradingView rolls over contracts and an alert can be put in place for this.Wskaźnik Pine Script®od gmathis199513