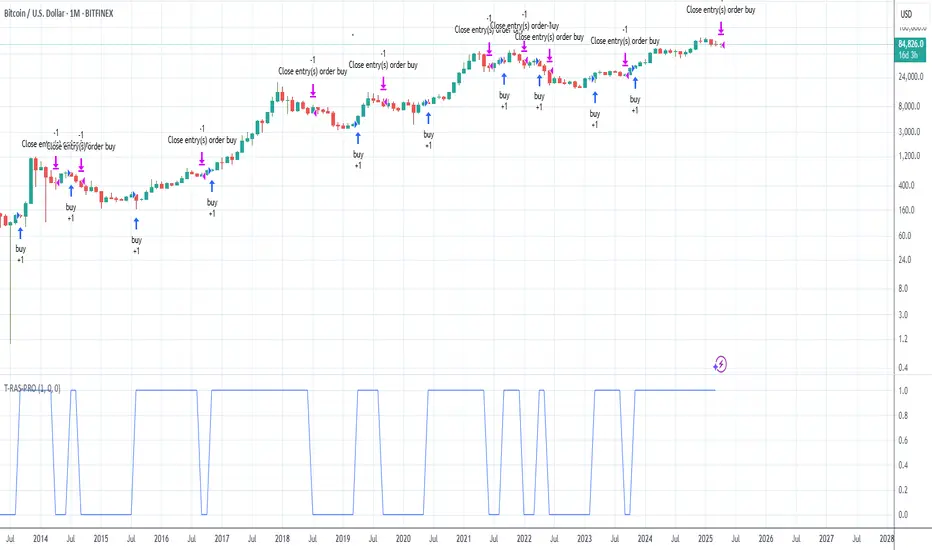
U&Dif price has moved up since 1 to 3 candles ago = buy
if price has moved down since 1 to 3 candles ago = sell
has internal SL & TP
tested on
BITFINEX:ETHUSD
BITFINEX:BTCUSD
BITFINEX:LTCUSD
BITFINEX:ETHBTC
4 hour charts
Wyszukaj w skryptach "Candlestick"

Trend Reversal Alerts Strategy [4H/3M]This is advanced version of T-R.A.S with better logic adapted for 4hour / 3month timeframes
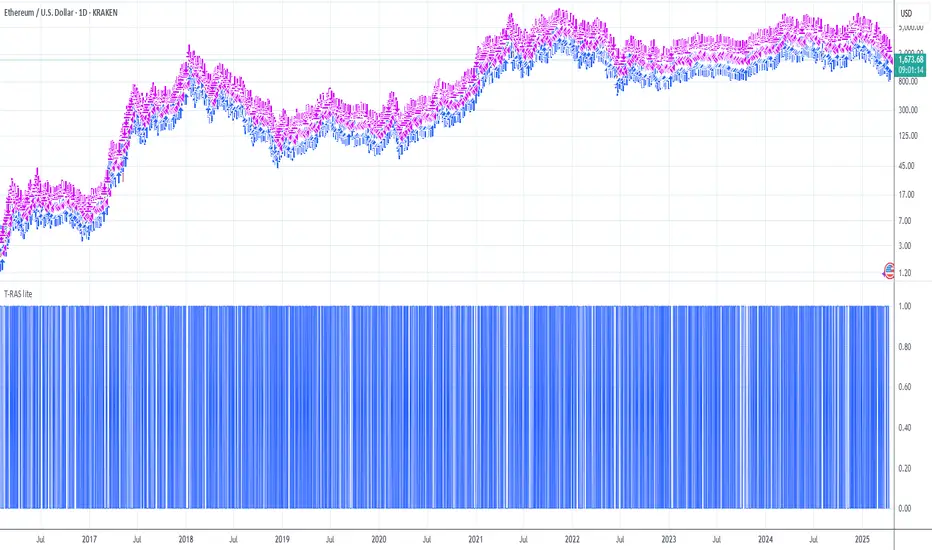
Trend Reversal Alerts Strategy [Advanced]This is a hourly version of T-R.A.S
It's better for houry timeframes : 2h, 3h, 4h, 6h, 12h, 1d, 4d ; otherwise use version for weekly

Trend Reversal Alerts Strategy [lite]This strategy was created as experimental and after playing around with it, I was able to realize what is a good way to base your strategy on and what is not.
This one is most primitive way and you should not expect gains from it(it's best on the weekly btw).
Anyway, all my attempts to advance this strategy in the end gave me around 1%2% +Net Profit on the hourly timeframe and drastically reduced the Net Profit by 50% on the weekly, so I think it is a waste of my time, but if you feel like you have ideas to share with me, please feel free to comments below!
Jeremy: Candle StrategyPrice action strategy developed for a Backtest Rookies service customer. Published for verification and acceptance.
Please visit the Backtest Rookies website if you are interested in Development services
Features
Hammer / Hanging man candle detection with variable inputs
2 position entries
2 different SL and TP ratios
Custom position sizing algorithm
Move the second position to break even once the first take profit is hit

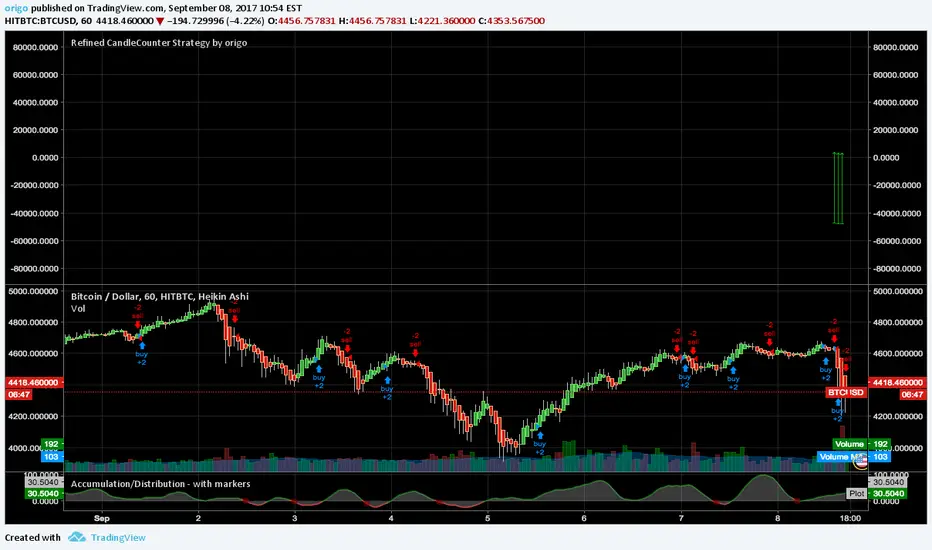
Refined CandleCounter Strategy A while ago I published a Candle Counter strategy that got quite some attention. Unfortunately it didn't work for all charts for some reason, so I decided to rewrite it. The result is, to me, astonishing. Judge for yourselves!
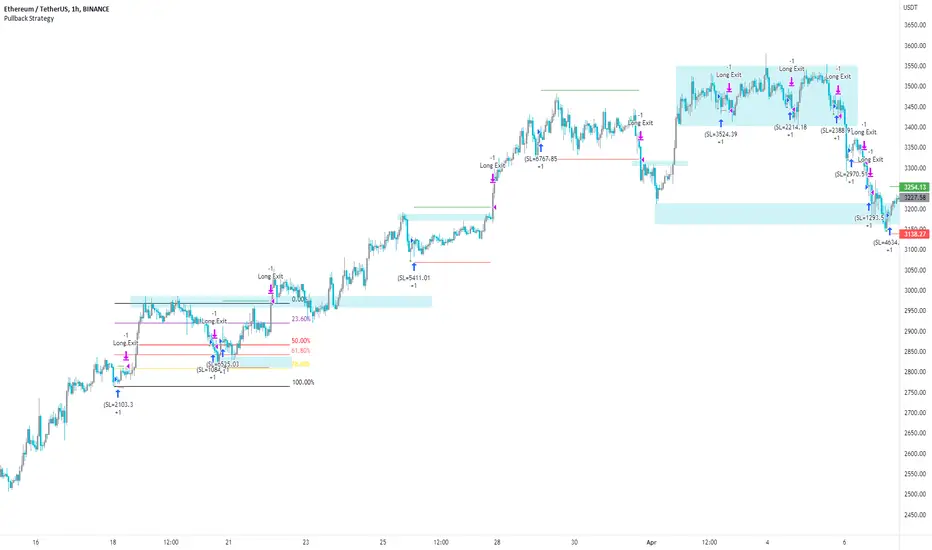
Pullback Strategy (Candle Analysis) New VersionFollowing on from the previous Pullback Candle which smashed over 100 likes - here we have the strategy behind the indicator.
Signal = Pullback Candle (This will alert on all timeframes and markets when selecting the Alert function for the Signal
Entry = When the Pullback Candle is confirmed ie 16:00 - the strategy will enter within the next two candles.
Stop loss = 0.25 ATR multiple which means we have a tighter stop loss - if greater than 1 then the stop loss will be more in percentages!!!
Take Profit = 1.5 Risk to Reward Model
Ema filter - There is a function to modify when looking into trades so as this is a bullish setup we want trades to be over the ema and using this filter will only show trades above the 200ema
Time filter - If you want to backtest Uptrends - locate the time of the start and the end of the uptrend - input this data into the settings and this will bring up the trades in that time period.
Most efficient to use this script is only in uptrends and this signal is a bullish signal - when using a ema filter we wont get trades under this so narrow down good trades for automation.
!!!!TO ENHANCE THE SYSTEM - USE TECHNICAL ANANLYSIS FOR CONFLUENCES
Most inefficient way to use the script is when price is in a downtrend and the win rate falls dramatically.
The pullback candle has a R-Expectancy of R5 so profits can be elongated when trading manually.
As the pullback candle occurs often in a trend we could pyramided trades to say have 5 trades in the same direction but the way i would trade this is to alert R1.5 then look to R2 and above to take profits manually.
(((P.S coders.... i need help to work on a profit extension code where exit long when price is below the 9ema (this seems simple but proving difficult) - this would be included onto the script if received.
Simple Candle Strategy# Candle Pattern Strategy - Pine Script V6
## Overview
A TradingView trading strategy script (Pine Script V6) that identifies candlestick patterns over a configurable lookback period and generates trading signals based on pattern recognition rules.
## Strategy Logic
The strategy analyzes the most recent N candlesticks (default: 5) and classifies their patterns into three categories, then generates buy/sell signals based on specific pattern combinations.
### Candlestick Pattern Classification
Each candlestick is classified as one of three types:
| Pattern | Definition | Formula |
|---------|-----------|---------|
| **Close at High** | Close price near the highest price of the candle | `(high - close) / (high - low) ≤ (1 - threshold)` |
| **Close at Low** | Close price near the lowest price of the candle | `(close - low) / (high - low) ≤ (1 - threshold)` |
| **Doji** | Opening and closing prices very close; long upper/lower wicks | `abs(close - open) / (high - low) ≤ threshold` |
### Trading Rules
| Condition | Action | Signal |
|-----------|--------|--------|
| Number of Doji candles ≥ 3 | **SKIP** - Market is too chaotic | No trade |
| "Close at High" count ≥ 2 + Last candle closes at high | **LONG** - Bullish confirmation | Buy Signal |
| "Close at Low" count ≥ 2 + Last candle closes at low | **SHORT** - Bearish confirmation | Sell Signal |
## Configuration Parameters
All parameters are adjustable in TradingView's "Settings/Inputs" tab:
| Parameter | Default | Range | Description |
|-----------|---------|-------|-------------|
| **K-line Lookback Period** | 5 | 3-20 | Number of candlesticks to analyze |
| **Doji Threshold** | 0.1 | 0.0-1.0 | Body size / Total range ratio for doji identification |
| **Doji Count Limit** | 3 | 1-10 | Number of dojis that triggers skip signal |
| **Close at High Proximity** | 0.9 | 0.5-1.0 | Required proximity to highest price (0.9 = 90%) |
| **Close at Low Proximity** | 0.9 | 0.5-1.0 | Required proximity to lowest price (0.9 = 90%) |
### Parameter Tuning Guide
#### Proximity Thresholds (Close at High/Low)
- **0.95 or higher**: Stricter - only very strong candles qualify
- **0.90 (default)**: Balanced - good for most market conditions
- **0.80 or lower**: Looser - catches more patterns, higher false signals
#### Doji Threshold
- **0.05-0.10**: Strict doji identification
- **0.10-0.15**: Standard doji detection
- **0.15+**: Includes near-doji patterns
#### Lookback Period
- **3-5 bars**: Fast, sensitive to recent patterns
- **5-10 bars**: Balanced approach
- **10-20 bars**: Slower, filters out noise
## Visual Indicators
### Chart Markers
- **Green Up Arrow** ▲: Long entry signal triggered
- **Red Down Arrow** ▼: Short entry signal triggered
- **Gray X**: Skip signal (too many dojis detected)
### Statistics Table
Located at top-right corner, displays real-time pattern counts:
- **Close at High**: Count of candles closing near the high
- **Close at Low**: Count of candles closing near the low
- **Doji**: Count of doji/near-doji patterns
### Signal Labels
- Green label: "✓ Long condition met" - below entry bar
- Red label: "✓ Short condition met" - above entry bar
- Gray label: "⊠ Too many dojis, skip" - trade skipped
## Risk Management
### Exit Strategy
The strategy includes built-in exit rules based on ATR (Average True Range):
- **Stop Loss**: ATR × 2
- **Take Profit**: ATR × 3
Example: If ATR is $10, stop loss is at -$20 and take profit is at +$30
### Position Sizing
Default: 100% of equity per trade (adjustable in strategy properties)
**Recommendation**: Reduce to 10-25% of equity for safer capital allocation
## How to Use
### 1. Copy the Script
1. Open TradingView
2. Go to Pine Script Editor
3. Create a new indicator
4. Copy the entire `candle_pattern_strategy.pine` content
5. Click "Add to Chart"
### 2. Apply to Chart
- Select your preferred timeframe (1m, 5m, 15m, 1h, 4h, 1d)
- Choose a trading symbol (stocks, forex, crypto, etc.)
- The strategy will generate signals on all historical bars and in real-time
### 3. Configure Parameters
1. Right-click the strategy on chart → "Settings"
2. Adjust parameters in the "Inputs" tab
3. Strategy will recalculate automatically
4. Backtest results appear in the Strategy Tester panel
### 4. Backtesting
1. Click "Strategy Tester" (bottom panel)
2. Set date range for historical testing
3. Review performance metrics:
- Win rate
- Profit factor
- Drawdown
- Total returns
## Key Features
✅ **Execution Model Compliant** - Follows official Pine Script V6 standards
✅ **Global Scope** - All historical references in global scope for consistency
✅ **Adjustable Sensitivity** - Fine-tune all pattern detection thresholds
✅ **Real-time Updates** - Works on both historical and real-time bars
✅ **Visual Feedback** - Clear signals with labels and statistics table
✅ **Risk Management** - Built-in ATR-based stop loss and take profit
✅ **No Repainting** - Signals remain consistent after bar closes
## Important Notes
### Before Trading Live
1. **Backtest thoroughly**: Test on at least 6-12 months of historical data
2. **Paper trading first**: Practice with simulated trades
3. **Optimize parameters**: Find the best settings for your trading instrument
4. **Manage risk**: Never risk more than 1-2% per trade
5. **Monitor performance**: Review trades regularly and adjust as needed
### Market Conditions
The strategy works best in:
- Trending markets with clear directional bias
- Range-bound markets with defined support/resistance
- Markets with moderate volatility
The strategy may underperform in:
- Highly choppy/noisy markets (many false signals)
- Markets with gaps or overnight gaps
- Low liquidity periods
### Limitations
- Works on chart timeframes only (not intrabar analysis)
- Requires at least 5 bars of history (configurable)
- Fixed exit rules may not suit all trading styles
- No trend filtering (will trade both directions)
## Technical Details
### Historical Buffer Management
The strategy declares maximum bars back to ensure enough historical data:
```pine
max_bars_back(close, 20)
max_bars_back(open, 20)
max_bars_back(high, 20)
max_bars_back(low, 20)
```
This prevents runtime errors when accessing historical candlestick data.
### Pattern Detection Algorithm
```
For each bar in lookback period:
1. Calculate (high - close) / (high - low) → close_to_high_ratio
2. If close_to_high_ratio ≤ (1 - threshold) → count as "Close at High"
3. Calculate (close - low) / (high - low) → close_to_low_ratio
4. If close_to_low_ratio ≤ (1 - threshold) → count as "Close at Low"
5. Calculate abs(close - open) / (high - low) → body_ratio
6. If body_ratio ≤ doji_threshold → count as "Doji"
Signal Generation:
7. If doji_count ≥ cross_count_limit → SKIP_SIGNAL
8. If close_at_high_count ≥ 2 AND last_close_at_high → LONG_SIGNAL
9. If close_at_low_count ≥ 2 AND last_close_at_low → SHORT_SIGNAL
```
## Example Scenarios
### Scenario 1: Bullish Signal
```
Last 5 bars pattern:
Bar 1: Closes at high (95%) ✓
Bar 2: Closes at high (92%) ✓
Bar 3: Closes at mid (50%)
Bar 4: Closes at low (10%)
Bar 5: Closes at high (96%) ✓ (last bar)
Result:
- Close at high count: 3 (≥ 2) ✓
- Last closes at high: ✓
- Doji count: 0 (< 3) ✓
→ LONG SIGNAL ✓
```
### Scenario 2: Skip Signal
```
Last 5 bars pattern:
Bar 1: Doji pattern ✓
Bar 2: Doji pattern ✓
Bar 3: Closes at mid
Bar 4: Doji pattern ✓
Bar 5: Closes at high
Result:
- Doji count: 3 (≥ 3)
→ SKIP SIGNAL - Market too chaotic
```
## Performance Optimization
### Tips for Better Results
1. **Use Higher Timeframes**: 15m or higher reduces false signals
2. **Combine with Indicators**: Add volume or trend filters
3. **Seasonal Adjustment**: Different parameters for different seasons
4. **Instrument Selection**: Test on liquid, high-volume instruments
5. **Regular Rebalancing**: Adjust parameters quarterly based on performance
## Troubleshooting
### No Signals Generated
- Check if lookback period is too large
- Verify proximity thresholds aren't too strict (try 0.85 instead of 0.95)
- Ensure doji limit allows for trading (try 4-5 instead of 3)
### Too Many False Signals
- Increase proximity thresholds to 0.95+
- Reduce lookback period to 3-4 bars
- Increase doji limit to 3-4
- Test on higher timeframes
### Strategy Tester Shows Losses
- Review individual trades to identify patterns
- Adjust stop loss and take profit ratios
- Change lookback period and thresholds
- Test on different market conditions
## References
- (www.tradingview.com)
- (www.tradingview.com)
- (www.investopedia.com)
- (www.investopedia.com)
## Disclaimer
**This strategy is provided for educational and research purposes only.**
- Not financial advice
- Past performance does not guarantee future results
- Always conduct thorough backtesting before live trading
- Trading involves significant risk of loss
- Use proper risk management and position sizing
## License
Created: December 15, 2025
Version: 1.0
---
**For updates and modifications, refer to the accompanying documentation files.**

HK Percentile Interpolation One
This script is designed to execute a trading strategy based on Heikin Ashi candlesticks, moving averages, and percentile levels.
Please note that you should keep your original chart in normal candlestick mode and not switch it to Heikin Ashi mode. The script itself calculates Heikin Ashi values from regular candlesticks. If your chart is already in Heikin Ashi mode, the script would be calculating Heikin Ashi values based on Heikin Ashi values, which would produce incorrect results.
The strategy begins trading from a start date that you can specify by modifying the `startDate` parameter. The format of the date is "YYYY MM DD". So, for example, to start the strategy from January 1, 2022, you would set `startDate = timestamp("2022 01 01")`.
The script uses Heikin Ashi candlesticks, which are plotted in the chart. This approach can be useful for spotting trends and reversals more easily than with regular candlestick charts. This is particularly useful when backtesting in TradingView's "Rewind" mode, as you can see how the Heikin Ashi candles behaved at each step of the strategy.
Buy and sell signals are generated based on two factors:
1. The crossing over or under of the Heikin Ashi close price and the 75th percentile price level.
2. The Heikin Ashi close price being above certain moving averages.
You have the flexibility to adjust several parameters in the script, including:
1. The stop loss and trailing stop percentages (`stopLossPercentage` and `trailStopPercentage`). These parameters allow the strategy to exit trades if the price moves against you by a certain percentage.
2. The lookback period (`lookback`) used to calculate percentile levels. This determines the range of past bars used in the percentile calculation.
3. The lengths of the two moving averages (`yellowLine_length` and `purplLine_length`). These determine how sensitive the moving averages are to recent price changes.
4. The minimum holding period (`holdPeriod`). This sets the minimum number of bars that a trade must be kept open before it can be closed.
Please adjust these parameters according to your trading preferences and risk tolerance. Happy trading!

STRATEGY Fibonacci Levels with High/Low Criteria - AYNET
Here is an explanation of the Fibonacci Levels Strategy with High/Low Criteria script:
Overview
This strategy combines Fibonacci retracement levels with high/low criteria to generate buy and sell signals based on price crossing specific thresholds. It utilizes higher timeframe (HTF) candlesticks and user-defined lookback periods for high/low levels.
Key Features
Higher Timeframe Integration:
The script calculates the open, high, low, and close values of the higher timeframe (HTF) candlestick.
Users can choose to calculate levels based on the current or the last HTF candle.
Fibonacci Levels:
Fibonacci retracement levels are dynamically calculated based on the HTF candlestick's range (high - low).
Users can customize the levels (0.000, 0.236, 0.382, 0.500, 0.618, 0.786, 1.000).
High/Low Lookback Criteria:
The script evaluates the highest high and lowest low over user-defined lookback periods.
These levels are plotted on the chart for visual reference.
Trade Signals:
Long Signal: Triggered when the close price crosses above both:
The lowest price criteria (lookback period).
The Fibonacci level 3 (default: 0.5).
Short Signal: Triggered when the close price crosses below both:
The highest price criteria (lookback period).
The Fibonacci level 3 (default: 0.5).
Visualization:
Plots Fibonacci levels and high/low criteria on the chart for easy interpretation.
Inputs
Higher Timeframe:
Users can select the timeframe (default: Daily) for the HTF candlestick.
Option to calculate based on the current or last HTF candle.
Lookback Periods:
lowestLookback: Number of bars for the lowest low calculation (default: 20).
highestLookback: Number of bars for the highest high calculation (default: 10).
Fibonacci Levels:
Fully customizable Fibonacci levels ranging from 0.000 to 1.000.
Visualization
Fibonacci Levels:
Plots six customizable Fibonacci levels with distinct colors and transparency.
High/Low Criteria:
Plots the highest and lowest levels based on the lookback periods as reference lines.
Trading Logic
Long Condition:
Price must close above:
The lowest price criteria (lowcriteria).
The Fibonacci level 3 (50% retracement).
Short Condition:
Price must close below:
The highest price criteria (highcriteria).
The Fibonacci level 3 (50% retracement).
Use Case
Trend Reversal Strategy:
Combines Fibonacci retracement with recent high/low criteria to identify potential reversal or breakout points.
Custom Timeframe Analysis:
Incorporates higher timeframe data for multi-timeframe trading strategies.

Why is it ok to backtest on TradingView from now on!TradingView backtester has bad reputation. For a good reason - it was producing wrong results, and it was clear at first sight how bad they were.
But this has changed. Along with many other improvements in its PineScript coding capabilities, TradingView fixed important bug, which was the main reason for miscalculations. TradingView didn't really speak out about this fix, so let me try :)
Have a look at this short code of a swing trading strategy (PLEASE DON'T FOCUS ON BACKTEST RESULTS ATTACHED HERE - THEY DO NOT MATTER). Sometimes entry condition happens together with closing condition for the already ongoing trade. Example: the condition to close Long entry is the same as a condition to enter Short. And when these two aligned, not only a Long was closed and Short was entered (as intended), but also a second Short was entered, too!!! What's even worse, that second short was not controlled with closing conditions inside strategy.exit() function and it very often lead to losses exceeding whatever was declared in "loss=" parameter. This could not have worked well...
But HOORAY!!! - it has been fixed and won't happen anymore. So together with other improvements - TradingView's backtester and PineScript is now ok to work with on standard candlesticks :)
Yep, no need to code strategies and backtest them on other platforms anymore.
----------------
Having said the above, there are still some pitfalls remaining, which you need to be aware of and avoid:
Don't backtest on HeikenAshi, Renko, Kagi candlesticks. They were not invented with backtesting in mind. There are still using wrong price levels for entries and therefore producing always too good backtesting results. Only standard candlesticks are reliable to backtest on.
Don't use Trailing Stop in your code. TradingView operates only on closed candlesticks, not on tick data and because of that, backtester will always assume price has first reached its favourable extreme (so 'high' when you are in Long trade and 'low' when you are in Short trade) before it starts to pull back. Which is rarely the truth in reality. Therefore strategies using Trailing Stop are also producing too good backtesting results. It is especially well visible on higher timeframe strategies - for some reason your strategy manages to make gains on those huge, fat candlesticks :) But that's not reality.
"when=" inside strategy.exit() does not work as you would intuitively expect. If you want to have logical condition to close your trade (for example - crossover(rsi(close,14),20)) you need to place it inside strategy.close() function. And leave StopLoss + TakeProfit conditions inside strategy.exit() function. Just as in attached code.
If you're working with pyramiding, add "process_orders_on_close=ANY" to your strategy() script header. Default setting ("=FIFO") will first close the trade, which was opened first, not the one which was hit by Stop-Loss condidtion.
----------------
That's it, I guess :) If you are noticing other issues with backtester and would like to share, let everyone know in comments. If the issue is indeed a bug, there is a chance TradingView dev team will hear your voice and take it into account when working on other improvements. Just like they heard about the bug I described above.
P.S. I know for a fact that more improvements in the backtesting area are coming. Some will change the game even for non-coding traders. If you want to be notified quickly and with my comment - gimme "follow".

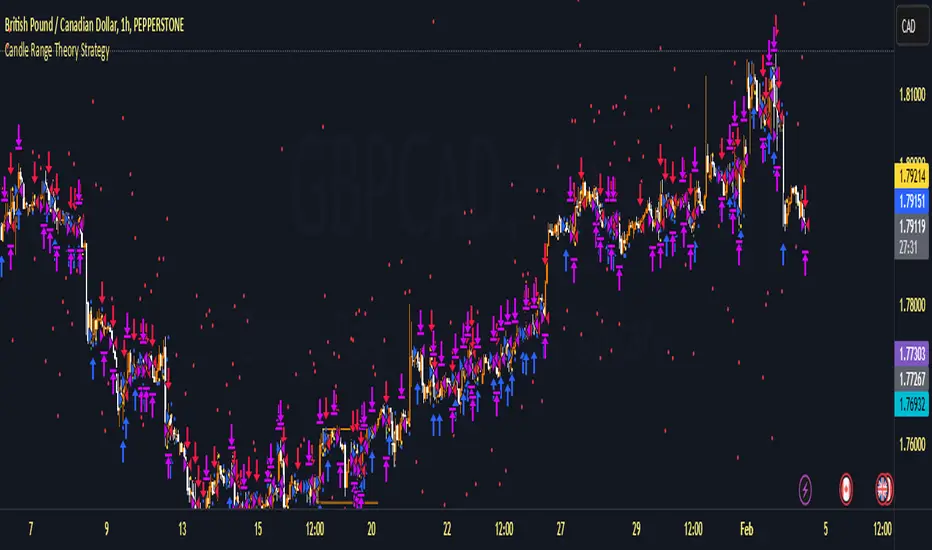
Candle Range Theory StrategyCandle Range Theory StrategyCandle Range Theory Strategy delves into the intricacies of price action analysis, focusing on the behavior of candlestick patterns within specific ranges. Traders employing this strategy aim to identify key support and resistance levels by analyzing the high and low points of significant candlesticks. The core principle lies in understanding that the range of a candle—defined by its opening, closing, high, and low prices—provides valuable insight into market sentiment and potential future movements.
To implement the Candle Range Theory Strategy effectively, one must first recognize the importance of different candle sizes. A long-bodied candle suggests strong momentum, pointing to a bullish or bearish bias, while a small-bodied candle indicates indecision or consolidation, often signaling potential reversals or breakouts. By plotting these candlesticks over a defined time frame, traders can ascertain whether the market is trending or range-bound.
Additionally, traders should consider the context in which these candles form. Analysis of the preceding price action can reveal whether current ranges are extensions of existing trends or indications of market fatigue. In particular, look for patterns such as engulfing candles, pin bars, or inside bars, as they often foreshadow forthcoming price fluctuations.
Moreover, combining the Candle Range Theory with other technical indicators, like moving averages or Fibonacci retracements, can offer a more comprehensive view of potential entry and exit points. By aligning candle patterns with broader market dynamics, traders can optimize their strategies, enhancing their probability of success while minimizing risk.
Lastly, maintaining a disciplined approach is crucial. Setting precise stop-loss and take-profit levels grounded in candle ranges can safeguard one's capital. Adhering to this framework allows traders to navigate the complexities of the market with greater confidence, ultimately leading to more informed and successful trading decisions. Embracing the nuances of Candle Range Theory not only sharpens analytical skills but also enriches one’s trading repertoire, paving the way for sustained profitability in the dynamic world of forex and equities.
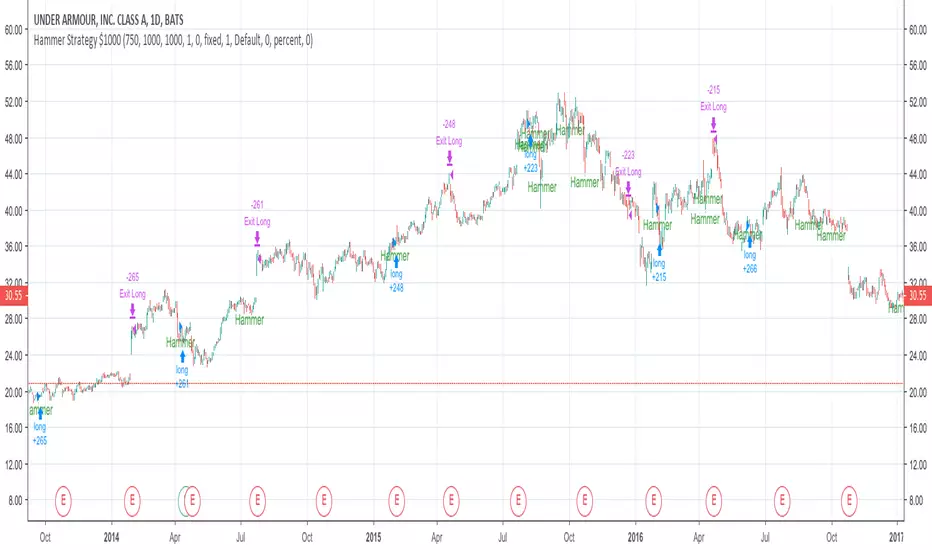
Basic Hammer StrategyThis is a basic strategy that will buy after a hammer is printed, and sell when a predetermined risk or reward price is hit. You can change the risk and reward values in the settings. Risk and reward values are in increments of $0.01. Default values are 75 ($0.75) and 200 ($2.00). If the strategy is producing losses, try adding a zero to the end of the risk value and the reward value. Example: Higher valued stocks may do better with a Risk of 750 ($7.50) and a Reward of 2000 ($20.00). Maybe even a Risk of 750 ($7.50) and reward of 1000 ($10.00). Play around with these values to get the best result for different charts. Initial investment is set to $1000
EMA Pullback Speed Strategy 📌 **Overview**
The **EMA Pullback Speed Strategy** is a trend-following approach that combines **price momentum** and **Exponential Moving Averages (EMA)**.
It aims to identify high-probability entry points during brief pullbacks within ongoing uptrends or downtrends.
The strategy evaluates **speed of price movement**, **relative position to dynamic EMA**, and **candlestick patterns** to determine ideal timing for entries.
One of the key concepts is checking whether the price has **“not pulled back too much”**, helping focus only on situations where the trend is likely to continue.
⚠️ This strategy is designed for educational and research purposes only. It does not guarantee future profits.
🧭 **Purpose**
This strategy addresses the common issue of **"jumping in too late during trends and taking unnecessary losses."**
By waiting for a healthy pullback and confirming signs of **trend resumption**, traders can enter with greater confidence and reduce false entries.
🎯 **Strategy Objectives**
* Enter in the direction of the prevailing trend to increase win rate
* Filter out false signals using pullback depth, speed, and candlestick confirmations
* Predefine Take-Profit (TP) and Stop-Loss (SL) levels for safer, rule-based trading
✨ **Key Features**
* **Dynamic EMA**: Reacts faster when price moves quickly, slower when market is calm – adapting to current momentum
* **Pullback Filter**: Avoids trades when price pulls back too far (e.g., more than 5%), indicating a trend may be weakening
* **Speed Check**: Measures how strongly the price returns to the trend using candlestick body speed (open-to-close range in ticks)
📊 **Trading Rules**
**■ Long Entry Conditions:**
* Current price is above the dynamic EMA (indicating uptrend)
* Price has pulled back toward the EMA (a "buy the dip" situation)
* Pullback depth is within the threshold (not excessive)
* Candlesticks show consecutive bullish closes and break the previous high
* Price speed is strong (positive movement with momentum)
**■ Short Entry Conditions:**
* Current price is below the dynamic EMA (indicating downtrend)
* Price has pulled back up toward the EMA (a "sell the rally" setup)
* Pullback is within range (not too deep)
* Candlesticks show consecutive bearish closes and break the previous low
* Price speed is negative (downward momentum confirmed)
**■ Exit Conditions (TP/SL):**
* **Take-Profit (TP):** Fixed 1.5% target above/below entry price
* **Stop-Loss (SL):** Based on recent price volatility, calculated using ATR × 4
💰 **Risk Management Parameters**
* Symbol & Timeframe: BTCUSD on 1-hour chart (H1)
* Test Capital: \$3000 (simulated account)
* Commission: 0.02%
* Slippage: 2 ticks (minimal execution lag)
* Max risk per trade: 5% of account balance
* Backtest Period: Aug 30, 2023 – May 9, 2025
* Profit Factor (PF): 1.965 (Net profit ÷ Net loss, including spreads & fees)
⚙️ **Trading Parameters & Indicator Settings**
* Maximum EMA Length: 50
* Accelerator Multiplier: 3.0
* Pullback Threshold: 5.0%
* ATR Period: 14
* ATR Multiplier (SL distance): 4.0
* Fixed TP: 1.5%
* Short-term EMA: 21
* Long-term EMA: 50
* Long Speed Threshold: ≥ 1000.0 (ticks)
* Short Speed Threshold: ≤ -1000.0 (ticks)
⚠️Adjustments are based on BTCUSD.
⚠️Forex and other currency pairs require separate adjustments.
🔧 **Strategy Improvements & Uniqueness**
Unlike basic moving average crossovers or RSI triggers, this strategy emphasizes **"momentum-supported pullbacks"**.
By combining dynamic EMA, speed checks, and candlestick signals, it captures trades **as if surfing the wave of a trend.**
Its built-in filters help **avoid overextended pullbacks**, which often signal the trend is ending – making it more robust than traditional trend-following systems.
✅ **Summary**
The **EMA Pullback Speed Strategy** is easy to understand, rule-based, and highly reproducible – ideal for both beginners and intermediate traders.
Because it shows **clear visual entry/exit points** on the chart, it’s also a great tool for practicing discretionary trading decisions.
⚠️ Past performance is not a guarantee of future results.
Always respect your Stop-Loss levels and manage your position size according to your risk tolerance.

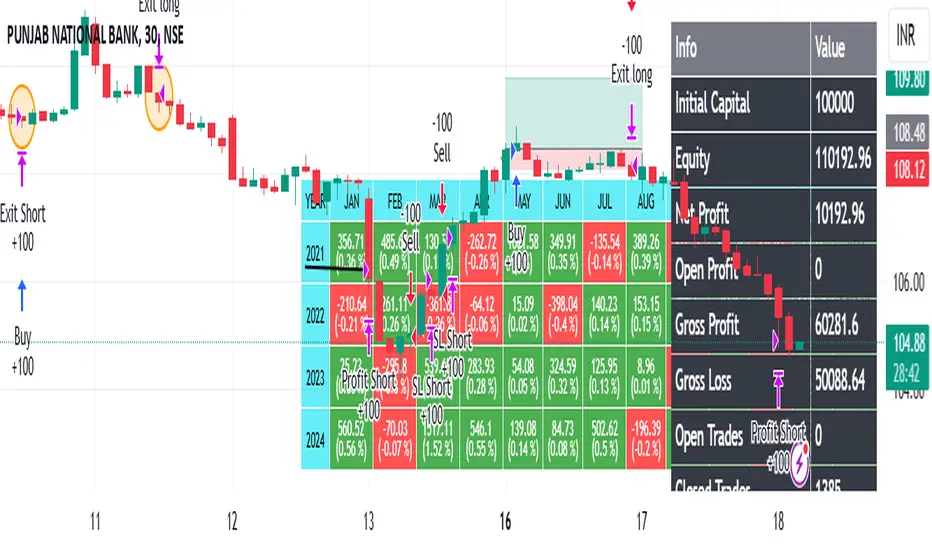
ROBO STB GainCraft strategyPure Price Action Candlestick Strategy by ROBO STB
Overview
This strategy is built entirely on the principles of price action and candlestick analysis, designed for traders who prefer raw market data over traditional indicators. By focusing solely on candlestick patterns and their context within recent price movements, the strategy identifies high-probability entry and exit points in liquid markets.
Entry signals are generated based on these patterns appearing at significant market locations, such as after consolidations, pullbacks, or at key support/resistance levels.
Price Action Integration:
Instead of relying on oscillators or moving averages, the script leverages the inherent market structure provided by candlesticks to interpret potential trend reversals or continuations.
This approach provides a clearer view of market sentiment.
No External Indicators:
This script avoids the use of traditional indicators like RSI, MACD, or Bollinger Bands, offering a clean, uncluttered chart.
Risk Management (Optional):
Fixed-percentage risk management options can also be enabled, ensuring trades remain within acceptable risk parameters.
How the Strategy Works
Entry Conditions:
Buy Entry: A bullish candlestick pattern (e.g., bullish engulfing) forms after a period of consolidation or pullback, indicating potential upward momentum.
Sell Entry: A bearish candlestick pattern (e.g., bearish engulfing) suggests a downturn is likely.
Exit Conditions:
Exits are triggered by the appearance of reversal candlestick patterns or through predefined SL/TP levels.
The strategy adapts to varying market conditions by analyzing candlestick structures dynamically.
Ideal Use Cases
Short-Term Trading: Designed for day traders and scalpers targeting quick moves on shorter timeframes.
Highly Liquid Markets: Performs best in markets with high liquidity, such as Nifty, Bank Nifty, or major forex pairs, where candlestick patterns provide reliable signals.
30-Minute Timeframe: For optimal results, the strategy is recommended for use on a 30-minute timeframe.
Transparency and Realism
Backtesting Parameters:
The default backtesting settings simulate realistic trading conditions, including commissions and slippage, ensuring that results are not misleading.
Trade sizes are calibrated to risk sustainable amounts (.05% maximum equity per trade).
Dataset Selection:
This strategy has been tested on diverse datasets to produce a statistically significant number of trades, ensuring robust performance evaluation.
Why This Strategy is Unique
This script stands apart by offering a refined approach to price action trading. Unlike generic indicator mashups, it provides traders with an actionable, candlestick-focused methodology tailored for volatile, high-liquidity markets.
The strategy is both simple to understand and powerful in execution, making it an excellent tool for traders who want to develop their skills in raw price action analysis while maintaining strict risk management.
Key Features
Candlestick-Based Entry and Exit Signals:
1. Risk Management:
- Risk-to-Reward Ratio (RTR):
Set a customizable risk-to-reward ratio to calculate target prices based on stop-loss levels.
Default: 3:1
order size added -100
2. Opening Range Identification
- Opening Range High and Low:
The script detects the high and low of the first trading session using Pine Script's session functions.
These levels are plotted as visual guides on the chart:
- High: Lime-colored circles.
- Low: Red-colored circles.
3. Trade Entry Logic
- Long Entry:
A long trade is triggered when the price closes above the opening range high.
- Entry condition: Crossover of the price above the opening range high.
-Short Entry:
A short trade is triggered when the price closes below the opening range low.
- Entry condition: Crossunder of the price below the opening range low.
Both entries are conditional on the absence of an existing position.
4. Stop Loss and Take Profit
- Long Position:
- Stop Loss: Previous candle's low.
- Take Profit: Calculated based on the RTR.
- **Short Position:**
- **Stop Loss:** Previous candle's high.
- **Take Profit:** Calculated based on the RTR.
The strategy plots these levels for visual reference:
- Stop Loss: Red dashed lines.
- Take Profit: Green dashed lines.
5. Visual Enhancements
-Trade Level Highlighting:
The script dynamically shades the areas between the entry price and SL/TP levels:
- Red shading for the stop-loss region.
- Green shading for the take-profit region.
How to Use:
1.Input Configuration:
Adjust the Risk-to-Reward ratio, max trades per day, and session end time to suit your trading preferences.
2.Visual Cues:
Use the opening range high/low lines and shading to identify potential breakout opportunities.
3.Execution:
The strategy will automatically enter and exit trades based on the conditions. Review the plotted SL and TP levels to monitor the risk-reward setup.
Important Notes:
- This strategy is designed for intraday trading and works best in markets with high volatility during the opening session.
- Backtest the strategy on your preferred market and timeframe to ensure compatibility.
- Proper risk management and position sizing are essential when using this strategy in live markets.
Please let me know if you have any doubts.
Easy Trade Pro [Buy and Sell Strategy + Backtesting System]Hello Traders,
Easy Trade Pro is a comprehensive tool that combines multiple technical indicators into a single customizable one. This tool is the culmination of an extensive trading career, it is designed to help traders navigate the markets in any timeframe and financial asset, like Equities, Futures, Crypto, Forex and Commodities.
Before we deep dive into the comprehensive guide on what Easy Trade Pro is, let's kick off by showcasing the strategy used in this example. Please note, we have adopted an extremely conservative approach strictly following the Tradingview House Rules, which you can review here: www.tradingview.com
The backtest strategy parameters:
Currency pair: EUR USD
Timeframe: 15-min chart
Market: Spot, no leverage
Broker: FXCM
Trading range: 2022-09-01 07:30 — 2023-06-26 20:00
Backtesting range: 2022-08-31 23:00 — 2023-06-26 20:00
Initial Capital: $10,000
Buy Order Size: 20% of the capital, $2,000
Stop Loss: 0.50%
Sell orders: Four different take profits where we unload the position by 25% each time
Broker Fees: Commission set at 0.08$
Slippage: 10 ticks
Understanding FXCM Commissions and Setting Realistic Slippage for EUR/USD Spot Trading:
◉I would like to provide some clarity on the commission structure and slippage setting used in the study for trading the EUR/USD pair on the FXCM spot market. Based on the information available, FXCM charges a commission of $4.00 per standard lot (100,000) on both sides of the trade (meaning at open and close) for the EUR/USD pair. Since the study involve an order size of $2,000 USD, which is equivalent to 0.02 lots, the commission fee for one side of the trade (either buying or selling) would be calculated as $4.00 multiplied by 0.02, which is $0.08. This means that for each individual trade, whether it be a buy or sell, the commission fee would be $0.08.
◉As for slippage, it is crucial to account for the inherent uncertainty in the execution price due to market fluctuations. In the forex market, the EUR/USD pair is quoted with a precision of five decimal places, with the smallest price change being a "pipette" (0.00001). Given that slippage can vary based on market conditions, it is considered fair practice to use a slippage of around 10 ticks under normal market conditions for the EUR/USD pair. This allows for a more realistic representation of the execution price, especially in a liquid and fast-moving market such as forex.
More detailed information about FXCM fees structure in the link below:
docs.fxcorporate.com
Enter a Trade conditions:
For our buy order, we utilize a custom buy signal called 'Bullish Reversal'. A detailed explanation of this and other buy orders can be found later in the guide, specifically in section 1).
To enhance realism in our trading strategy, we have implemented a confirmation mechanism. When utilizing the strategy tester, you have the option to input a value to determine the number of confirmation candles to consider.
For example, if you set the input to 1, the system will check if the next candle following the signal meets the criteria for confirmation. If set to 2, the system will evaluate the second candle, and so on for higher values. The confirmation is determined by comparing the closing or opening price of the selected buy signal candle with the corresponding closing price of the confirmation candle.
In this case we choose as buy signal: 'Bullish Reversal' + 2 candle of confirmation
Exit a trade conditions:
On the sell side, we exit a trade in four different types of sell orders where we take profits. Inside '', you will encounter unique labels attributed to our custom sell signals. A detailed explanation of these sell orders can be found later in the guide, specifically in section 1). We used custom order called:
1TP 'Good Sell'
2TP 'Good Sell'
3TP 'Good Sell'
4TP 'Bearish Reversal' + 4 confirmation candles
Our confirmation logic, for sell signals, is applied only to 'Bearish Reversal' signal. The confirmation is determined by comparing the closing or opening price of the selected 'Bearish Reversal' candle with the corresponding closing price of the confirmation candle. In this case, we wait for the fourth candle from the 'Bearish Reversal' signal to confirm the sell trade.
Protect your capital:
This super-conservative study involves a clear low risk, with the use of $2,000, 20% of our capital. If the stop loss of 0.5% were triggered, we lose 10$, equating to 0.10% of $10,000 - thus affecting only 0.10% of our capital.
Super Conservative Approach & Results:
With 353 closed trades, we achieved a net profit of 2.03%, or $203.34$ relative to our initial $10,000 capital, and a win rate of 73.37%.
Less Conservative Approach & Results:
We could also consider increasing our risk to 0.5% of our capital per trade. We would maintain our stop loss at 0.50%, but we would need to use all our capital to enter the market. If the stop loss of 0.5% will be triggered, we would lose 50$, equating to 0.5% of $10,000.
In this scenario, our net profit would have increased to 10.15%, equivalent to $1015.
Please be aware:
While fully automated strategies can bring considerable advantages, they are not without their cons. For one, relying solely on an automated system may not take into account the potential confluence of other strategies or indicators, such as the significance of support and resistance zones. These elements often require a more nuanced, human understanding of the markets and cannot always be perfectly replicated by an algorithm.
Additionally, it's essential to remember that a significant percentage of traders are not consistently profitable. As such, prudent risk management, a conservative approach, and acceptance of a reasonable profit are crucial aspects of successful trading. While the allure of high returns can be tempting, the sustainability of your trading strategy should always take precedence. Achieving steady, reliable profits over time often outweighs the appeal of a risky, high-return strategy that could potentially lead to substantial losses.
So, while automation can be a powerful tool in your trading arsenal, it's also important to consider other strategies and factors. Always ensure you're managing your risk effectively and approaching trading with a realistic and informed perspective.
------------------------------------------------------------------------ Why Easy Trade Pro is Original? ----------------------------------------------------------------------------------
We developed Easy Trade Pro as a unique and comprehensive solution, and we decided to protect our code to preserve its originality. We invested significant time and effort into making it a realistic trading strategy simulator. The standout features that set Easy Trade Pro apart include:
☀ Versatile Stop Loss Mechanisms: Stop loss execution can be complex and often requires careful coding to work as intended. In most freely available open-source codes, stop losses are implemented using the Average True Range (ATR). ATR can be beneficial but has limitations:
☁ Lagging Indicator - Like most technical indicators, the ATR is a lagging indicator. This means it is based on past data, and so it may not accurately reflect future market volatility. If market conditions change rapidly, the ATR may not adjust quickly enough, potentially leading to suboptimal stop loss levels.
☁ No Directional Information - The ATR measures volatility, but it does not provide any indication of the direction of the trend. Therefore, it should not be used as a standalone tool for making trading decisions, but should be used in conjunction with other technical analysis tools that can provide directional cues.
☁ Inefficiency in Trending Markets - In strongly trending markets, ATR-based stops can sometimes be too far from the current price level. This could lead to larger losses if the price moves against your trade before hitting the stop loss. On the flip side, in less volatile, sideways markets, an ATR-based stop might be set too close to the entry point, leading to premature stop outs.
☁ Overoptimization Risk - If you're backtesting a trading strategy, there's a risk of overoptimizing your stop loss settings by fine-tuning them to past data. The best ATR multiplier that worked in the past might not necessarily work in the future, leading to potential performance issues.
☀ We countered these by implementing four different types of 'protect the trade' mechanisms:
✔ Fixed Percentage Stop Loss
✔ Trailing Stop Loss
✔ Stop Loss Moved to Entry Upon Reaching Certain Gain
✔ Stop Loss Moved to Entry Upon Reaching First Take Profit Order ("Custom Order").
☀ Dual Exit Strategy: We incorporated two distinct methods of exiting a trade. The first uses our custom signals, while the second triggers exit at a certain percentage of gain.
☀ Multiple Take Profit Orders: You have the flexibility to establish up to four different sell orders. This feature enables you to fractionate your exit strategy according to your needs. You can choose to trigger these fractions based on our custom signals or determine your own exit points by setting targeted gains at a fixed percentage.
☀ Confirmation Candle System: This feature enhances trade precision by requiring confirmation candles after a buy or sell signal. This confirmation, dependent on the next candle's closing price, helps reduce false signals and improves entry and exit points. While our confirmation system is applicable to all custom buy signals, it's solely dedicated for the bearish reversal when it comes to sell signals.
☀ Universal Compatibility: Easy Trade Pro's Strategy Tester works perfectly with any asset class. The code can handle different contract types, including the SPX contracts and fractional assets like Bitcoin. It's optimized to ensure proper execution of trades without rounding issues.
☀ Bullish and Bearish Reversal candles: Our method of detecting these pivotal candles combines conditions from buy and sell signals with pertinent divergences in Price, RSI, and Volume (OBV). The distinguishing factor, however, lies in recognizing significant shifts in market structure and liquidity grabs. To further enhance the credibility of our indicator, we've incorporated Bollinger Bands, serving as an additional layer in spotting potential trend reversals, particularly when aligned with long-wick candlesticks, engulfing patterns, and morning or evening star formations.
☀ Non-Repainting Indicator: Our indicator signals are designed not to repaint. Once a signal appears, it stays fixed, offering a reliable tool for your trading decisions.
================================================== EXTENSIVE TECHNICAL DESCRIPTION ====================================================
Easy Trade Pro is versatile, allowing you to analyze market trends across any financial asset. With its rigorous testing, our tool can be used confidently on any timeframe, from 1D to 1min, whether you prefer longer-term or shorter-term trades.
Although we recommend trading on timeframes between 1D and 1min, higher timeframes like 1W chart, can also provide broader insights.
Our study combines a variety of popular technical indicators, such as RSI, Stochastic RSI, MACD, DMI, Bollinger Bands as well as relevant EMAs. On the volume side OBV and MFI. Using a data-driven approach, “Easy Trade Pro” analyzes historical market trends to identify optimal ways to combine these indicators with significant divergences between price and oscillators. On top of that the code considers relevant changes in market structure and liquidity grabs, to generate reliable and accurate signals for potential buy and sell opportunities.
* ☎ --> Please not that MACD, BBs, and EMAs account for a minimal part of our script <--- ☎, If you're looking for a simpler tool, consider checking out our open-source indicator, 'RSI, SRSI, MACD, and DMI cross - Open source code'. You can find it here:
With our customizable system, traders will be able to identify:
1) Three types of buy signals🐂,💰,💎 and sell signals 🐻,🔨,💀
2) Bullish and bearish reversal candles with support and resistance lines
3) Bull and bear momentum signals
4) A function that utilizes Color bars to identify the strength of the trend
5) Three customizable moving averages
6) Alerts direct to your email or phone
7) Advanced and customizable settings menu
8) Our software also includes a backtesting system that that allows users to test their trading strategies on historical data, to check how they would have performed in real-world market conditions. This can help refine a trading strategy and make more informed decisions.
------------------------------------------------------------------------------ 1) BUY AND SELL SIGNALS ---------------------------------------------------------------------------------
Our buy and sell signals are generated using a custom combination of RSI, MFI, and Stochastic RSI levels, as well as relevant MACD and Stochastic RSI crosses. These indicators are carefully analyzed to identify potential trading opportunities and determine optimal entry and exit points for trades.
RSI (Relative strength index) measures the strength of a security's price action, while the SRSI (Stochastic Relative Strength Index) is a momentum oscillator that measures the current price relative to its high and low range over a set period. The Money Flow Index (MFI) is another momentum indicator that uses both price and volume data to measure buying and selling pressure. MACD (Moving Average Convergence Divergence) is a popular technical indicator used in financial markets to analyze price trends and momentum.
▶ With our system, you'll be able to identify three different levels of buy signals:
◉ The first level of buy signal is represented by a 🐂 emoji and is a "Good Buy". This signal indicates a possible buying opportunity. It indicates that could be a good opportunity to enter in a long trade. It's important to note that, the "Good Buy" signal can sometimes be supplemented with a green "Bull" text and a flag plotshape positioned beneath the signal. In these scenarios, we categorize this as a "Good Buy Bull" signal.
◉ The second level of buy signal is represented by a 💰 emoji and is a "Great Buy". This signal indicates a stronger buying opportunity than the "Good Buy" signal.
◉ The third and strongest buy signal is represented by a 💎 emoji and is an "Incredible Buy". This signal indicates a stronger buying opportunity than the "Good Buy" and "Great Buy" signals
▶ With our system, you'll be able to identify three different levels of sell signals:
◉ On the sell side, the first level is represented by a 🐻 emoji and is a "Good Sell". This signal indicates a possible selling opportunity. It indicates that could be a good opportunity to exit a trade or open a short position. It's important to note that, the "Good Sell" signal can occasionally be accompanied by a red "Bear" text and a flag plotshape positioned beneath the signal. In such instances, we refer to this as a "Good Sell Bear" signal.
◉ The second sell signal is represented by a 🔨 emoji and is a "Great Sell". This signal indicates a stronger selling opportunity than the "Good Sell" signal.
◉ The third and strongest sell signal is represented by a 💀 emoji and is an "Incredible Sell". This signal indicates a stronger selling opportunity than the "Good Sell" and "Great Sell" signals.
------------------------------------------2) "BULLISH AND BEARISH REVERSAL CANDLES PLUS SUPPORT AND RESISTANCE LINES" ------------------------------------------------
Bullish and bearish reversal candles are specific candles that have more probability to reverse the trend.
Our trading indicator is designed to identify bullish and bearish reversal candles. Our method of detecting these pivotal candles combines conditions from buy and sell signals with pertinent divergences in Price, RSI, and Volume (OBV). The distinguishing factor, however, lies in recognizing significant shifts in market structure and liquidity grabs. To further enhance the credibility of our indicator, we've incorporated Bollinger Bands, serving as an additional layer in spotting potential trend reversals, particularly when aligned with long-wick candlesticks, engulfing patterns, and morning or evening star formations.
These candles are represented by blue and orange colors respectively by default. Additionally, the indicator also uses lines that are drawn at either the opening or closing of candles to help identify pivot points of support or resistance. These candles, lines color or shape are customizable in the settings menu.
How can I benefit the most from bullish reversal candles? To make the most of bullish reversal candles, a powerful strategy is:
E.g, 1D chart - Wait for the next 1 or 2 candles to close above the support line linked to the bullish reversal candle. For lower timeframes, it is recommended to wait for 2 or 3 candles before making a trading decision. A good tip is also to look for other signals (confluence), like a buy signal. Traders should decide based on their risk tolerance.
Here below we can see an example of a bullish reversal candle in the BTC/USDT, 1D, chart. The system identify a bullish reversal candle (blue color), the next 2 candles are green and closed above the support blue line, in addition we have other bullish signals (confluence).
How can I benefit the most from bullish reversal lines? Bullish reversal lines can help traders to identify key level of support and maintain control of their position until a clear break below occurs.
In the example below we se how the price retrace to the support line:
After touching the price bounce up.
How can I benefit the most from bearish reversal candles? To make the most of bearish reversal candles, a powerful strategy is:
E.g, 1D chart - Wait for the next 1 or 2 candles to close below the resistance line linked to the bearish reversal candle. For lower timeframes, it is recommended to wait for 2 or 3 candles before making a trading decision. Traders should decide based on their risk tolerance.
Here below we can see an example of a bearish reversal candle in the ETH/USDT, 1D, chart. The system identify a bearish reversal candle (orange color), the next candle is red and closes below the resistance orange line. A good tip is also to look for other signals (confluence), like a sell signal.
How can I benefit the most from bearish reversal lines? Bearish reversal lines can help traders to identify key level of resistance and maintain control of their position until a clear break above occurs.
In the example below we se how the price bounce back to the resistance line and get rejected.
------------------------------------------------------------------------- 3) BULL AND BEAR MOMENTUM SIGNALS -----------------------------------------------------------------------
We analyzed factors such as buy or sell signals, long or short confirmation signals, DMI crossup or crossdown and breaks of market structure (BOS) or change of character (CHoCh) to determine the strength and direction of the trend. These study give us bull trend or bear trend signals that can help traders identify potential trading opportunities and make informed decisions.
These conditions are represented by a green word "BULL" and a flag shape below (bull momentum) and by a red word "BEAR" and a flag shape above (bear momentum) respectively by default. These plots shapes are customizable in the settings menu.
How can I benefit the most from bull momentum signals? To make the most of bull momentum signals, a powerful strategy is:
E.g, 1D chart - Look for confluence. If bull signal comes with a "Good Buy 🐂" in the same candle the signal is more strong. Another good combo is to look for a bullish reversal candle prior or after this signal, usually within a range of 1/2 candles. For lower timeframes, it is recommended to wait 2/3 candles before making a trading decision.
In the picture below we can see an example of a bull momentum signal in the US500, 1D, chart.
How can I benefit the most from bear momentum signals? To make the most of bear momentum signals, a powerful strategy is:
E.g, 1D chart - Look for confluence. If bear signal comes with a "Good Sell 🐻" in the same candle the signal is more strong. Another good combo is to look for a bearish reversal candle prior or after this signal, usually within a range of 1/2 candles. For lower timeframes, it is recommended to wait 2/3 candles before making a trading decision.
In the picture below we can see an example of a bear momentum signal in combo with a sell signal, NETFLIX, 1D, chart.
-------------------------------------------------------------- 4) "COLOR BARS THAT INDICATE THE STRENGTH OF THE TREND -----------------------------------------------------
This code is responsible for changing the color of the bars on a chart based on certain conditions. The gradient colors are defined for green and red, and the algorithm checks if the current bar is within a certain range of either a bearish reversal or bullish reversal candle and whether the price is above or below certain exponential moving averages or if important break of market structure occurs.
Ultimately, this feature helps traders visually identify potential trends and market shifts and avoid getting distracted by price fluctuations. Please note that every gradient of color can be customize by the user. We set 3 different bullish colors and 3 different bearish colors.
Below the picture of the settings menu related to the bar color.
----------------------------------------------------------------------5)THREE CUSTOMIZABLE MOVING AVERAGES ----------------------------------------------------------------------
You can choose up to three moving averages, any length and any type like SMA, EMA, WMA, HMA, RMA, SWMA and VWMA. Furthermore, you have the freedom to adjust the color and width of the lines to your preference.
Below the picture of the settings menu related to the moving averages.
----------------------------------------------------------------------6) ALERTS DIRECT TO YOUR EMAIL OR PHONE --------------------------------------------------------------------
Our alert feature sends real-time notifications directly to your email or phone when a signal is generated, allowing you to take immediate action and stay ahead of the market.
With our system, you first establish your own rules for trading in the strategy tester - this includes your criteria for entering and exiting trades.
Once you've defined these conditions, our system will start sending you alerts. These alerts will be triggered whenever your specified conditions are met. So, if the market matches your 'enter trade' conditions, you'll receive an alert prompting. Similarly, when your 'exit trade' conditions are met, you'll receive another alert.
Remember, these alerts are purely based on the conditions you set.
Once the condition is met, you will receive alerts directly to your email or phone when enter and exit a trade based on your custom conditions. To make sure you receive these notifications click on notifications tab.
---------------------------------------------------------------7) ADVANCED AND CUSTOMIZABLE SETTINGS MENU----------------------------------------------------------------------
We designed Easy Trade indicators with traders in mind, so it's user-friendly, easy to navigate and users can customize inputs, style, and colors of every feature in the indicator's settings menu.
-----------------------------------------------------------------------8) EASY TRADE PRO - BACKTESTING SYSTEM----------------------------------------------------------------------
Easy Trade Pro features a highly effective and realistic backtesting system, designed to mirror as closely as possible the real-world scenarios of entering and exiting trades.
Step 1:
Open the settings menu of the Indicator.
Once opened the settings menu click on properties.
Decide on the capital you wish to invest. Choose whether to use contracts or USD and determine the size of your orders. For the sake of realism, we recommend not exceeding 25% of your capital per order. However, if you decide to utilize your entire capital, make sure to adjust your stop loss accordingly. For instance, if you have a capital of 10K and use 10K with a stop loss at 2%, your potential loss would be $200. Conversely, if you use only 2K of your 10K capital with a stop loss at 10%, you would still lose the same 2% of your capital. To make your simulation even more authentic, consider incorporating broker fees or commissions into your calculations. For example, spot market fees are typically around 0.10%. If you're backtesting markets with low liquidity, consider factoring in slippage as well.
Step 2:
Navigate to the 'Inputs' section and scroll down until you come across 'Backtesting System - Strategy Test'. Once you locate this, click on the box and activate the 'USE STRATEGY SYSTEM' option by checking the tick box.
Also You will then need to set a 'Start Date' and 'End Date', establishing a specific time period during which you wish to test your strategy.
Otherwise you can consider to use the deep backtesting feature.
Step 3:
It's now time to establish the conditions for entering a trade. You can choose from five different types of custom buy signals: Good Buy, Good Buy Bull, Great Buy, Incredible Buy, and Bullish Reversal. Note that 'Great Buy' and 'Incredible Buy' are rare signals, so we advise against using them frequently in mechanical strategy tests; instead, consider them more for manual live tests. For more consistent results, we recommend using the other buy signals.
After determining your preferred buy signal, you can choose how many confirmation candles you wish to wait for before entering a trade. A 'confirmation' means that if the next candle closes above the opening or closing price of the chosen buy signal, it's considered a confirmation. This could be the opening or closing price, depending on whether the candle is green (close > open) or red.
You can set the number of confirmation candles in different time frames: below 2h, between 2h and 10h, and above 10h.
Step 4:
It's now time to safeguard your trade by managing risk. You can choose to implement a stop loss, expressed in percentage terms, or opt for a trailing stop. A trailing stop is a type of stop loss order that moves with the market price. It is designed to protect gains by enabling a trade to remain open and continue to profit as long as the market price is moving in a favorable direction. However, the trade closes if the market price changes direction by a specified amount (the 'trailing stop distance').
Additionally, you can minimize losses and move the stop loss to your entry point once the price reaches a certain percentage of profit. This strategy can help secure potential gains while limiting the potential for losses.
Step 5:
Now it's time to set the conditions for exiting the trade. You have the option to divide your exit into a maximum of four parts, with each part representing 25% of the position size. For each take profit point, you can choose from three different custom sell signals: Good Sell, Good Sell Bear, and Bearish Reversal.
Similarly, the concept of confirmation candles also applies here, but in this case, the candles are not closing above. A 'confirmation' for a sell signal means that if the next candle closes below the opening or closing price of the selected sell signal, it's considered a confirmation. This could be the opening or closing price, depending on whether the candle is green (open > close) or red (close < open).
So, when you're looking to sell, a confirmation would occur if the next candlestick's closing price is lower than the opening or closing price of the candlestick that triggered the sell signal. This indicates a potential bearish trend, providing the confirmation to execute the sell order.
Additionally, we've introduced a feature that allows you to move your stop loss to the entry point whenever the first take profit (1TP) is reached, which equates to hitting one custom sell signal.
Step 6:
We've also designed an alternative method for taking profits. With this approach, you can choose to exit your position once a fixed percentage gain from the entry point is reached. For instance, you might decide to exit when a 10% profit is achieved. Similarly to the previous method, this approach allows you to choose up to four exit points and determine the proportion of your position you want to close at each stage.
Conclusion:
Easy Trade Pro provides users with various options for entering and exiting trades. To effectively utilize the indicator, we strongly recommend conducting thorough backtesting and considering the results across your preferred trading pairs. It is advisable to analyze a substantial number of trades, ideally exceeding 100 trades, to obtain reliable insights into the indicator's performance. This approach will help you gain a better understanding of how Easy Trade Pro aligns with your trading strategy and objectives.
❗Keep attention❗
It is important to note that no trading indicator or strategy is foolproof, and there is always a risk of losses in trading. While this indicator may provide useful information for making conclusions, it should not be used as the sole basis for making trading decisions. Traders should always use proper risk management techniques and consider multiple factors when making trading decisions.
It is also important to be aware of the limitations of simulated performance results. Hypothetical or simulated results do not represent actual trading, and since trades have not been executed, results may be over- or under-compensated for market factors such as lack of liquidity. Simulated trading programs are also designed with the benefit of hindsight, and no representation is being made that any account will achieve profits or losses similar to those shown. Therefore, our indicators are for informative purposes only and not intended to be used as financial advice.
We encourage traders to use our indicators as part of a well-rounded trading strategy and to always be aware of the risks involved in trading. Remember that past performance is not indicative of future results and always trade responsibly.

KCandle Strategy 1.0# KCandle Strategy 1.0 - Trading Strategy Description
## Overview
The **KCandle Strategy** is an advanced Pine Script trading system based on bullish and bearish engulfing candlestick patterns, enhanced with sophisticated risk management and position optimization features.
## Core Logic
### Entry Signal Generation
- **Pattern Recognition**: Detects bullish and bearish engulfing candlestick formations
- **EMA Filter**: Uses a customizable EMA (default 25) to filter trades in the direction of the trend
- **Entry Levels**:
- **Long entries** at 25% of the candlestick range from the low
- **Short entries** at 75% of the candlestick range from the low
- **Signal Validation**: Orange candlesticks indicate valid setup conditions
### Risk Management System
#### 1. **Stop Loss & Take Profit**
- Configurable stop loss in pips
- Risk-reward ratio setting (default 2:1)
- Visual representation with colored lines and labels
#### 2. **Break-Even Management**
- Automatically moves stop loss to break-even when specified R:R is reached
- Customizable break-even offset for added protection
- Prevents losing trades after reaching profitability
#### 3. **Trailing Stop System**
- **Activation Trigger**: Activates when position reaches specified R:R level
- **Distance Control**: Maintains trailing stop at defined distance from entry
- **Step Management**: Moves stop loss forward in incremental R steps
- **Dynamic Protection**: Locks in profits while allowing for continued upside
### Advanced Features
#### Position Management
- **Pyramiding Support**: Optional multiple position entries with size reduction
- **Order Expiration**: Pending orders automatically cancel after specified bars
- **Position Sizing**: Percentage-based allocation with pyramid level adjustments
#### Visual Interface
- **Real-time Monitoring**: Comprehensive information panel with all strategy metrics
- **Historical Tracking**: Visual representation of past trades and levels
- **Color-coded Indicators**: Different colors for break-even, trailing, and standard stops
- **Debug Options**: Optional labels for troubleshooting and optimization
## Key Parameters
### Basic Settings
- **EMA Length**: Trend filter period
- **Stop Loss**: Risk per trade in pips
- **Risk/Reward**: Target profit ratio
- **Order Validity**: Duration of pending orders
### Risk Management
- **Break-Even R:R**: Profit level to trigger break-even
- **Trailing Activation**: R:R level to start trailing
- **Trailing Distance**: Stop distance from entry when trailing
- **Trailing Step**: Increment for stop loss advancement
## Strategy Benefits
1. **Objective Entry Signals**: Based on proven candlestick patterns
2. **Trend Alignment**: EMA filter ensures trades align with market direction
3. **Robust Risk Control**: Multiple layers of protection (SL, BE, Trailing)
4. **Profit Optimization**: Trailing stops maximize winning trade potential
5. **Flexibility**: Extensive customization options for different market conditions
6. **Visual Clarity**: Complete visual feedback for trade management
## Ideal Use Cases
- **Swing Trading**: Medium-term positions with trend-following approach
- **Breakout Trading**: Capturing momentum from engulfing patterns
- **Risk-Conscious Trading**: Suitable for traders prioritizing capital preservation
- **Multi-Timeframe**: Adaptable to various timeframes and instruments
---
*The KCandle Strategy combines traditional technical analysis with modern risk management techniques, providing traders with a comprehensive tool for systematic market participation.*

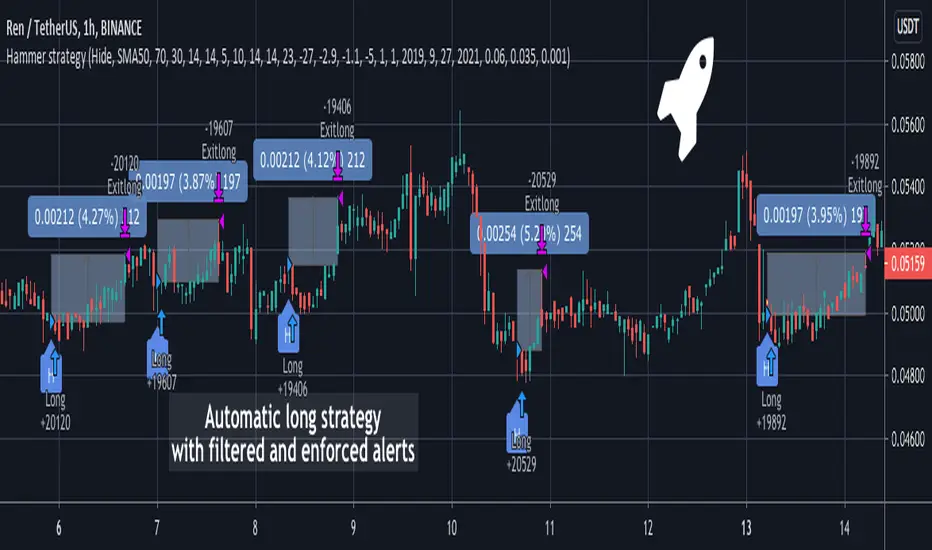
Hammer Long strategy with filtered and enforced alertsA Hammer Long strategy is a price pattern in candlestick charting that occurs when a security trades significantly lower than its opening, but rallies within the period to close near opening price. This pattern forms a hammer-shaped candlestick , in which the lower shadow is at least twice the size of the real body. The body of the candlestick represents the difference between the open and closing prices, while the shadow shows the high and low prices for the period.
Key takeaways:
Hammers have a small real body and a long lower shadow.
Hammers occur after a price decline.
The hammer candlestick shows sellers came into the market during the period but by the close the selling had been absorbed and buyers had pushed the price back to near the open.
The close can be above or below the open, although the close should be near the open in order for the real body to remain small.
The lower shadow should be at least two times the height of the real body.
Hammer candlesticks indicate a potential price reversal to the upside.
The strategy enhances standard Hammer pattern accuracy by clearing out market noises and manipulations from the indicator's triggers. Combination of Volume oscillator filter and Directional Movement Index (DMI) components values adjustments allows to detect only strong signals. The strategy is developed to forecast Long positions entries and exits. The strategy supports spot, futures, options and marginal trading exchanges. It works accurately with BTC, USD, USDT, ETH and BNB quote currencies. Best to use with 30 and 60 minutes timeframe charts. The strategy can be and should be configured for each particular asset. You can change filters and risk management settings to receive the most advanced accurate alerts
Advantages of this script:
1. Weak signals and market noises are filtered. This allows to receive only strong and confirmed alerts
2. Strategy can be easily configured in user interface for each particular asset
3. High performance. At the chart you can see examples of strategy entries and exits, you also can check strategy backtest for RENUSDT position:
Net profit: 26.95%
Percent profitable: 90%
Profit factor: 7.418
Duration of trade: 16 hours
How to use?
1. Apply indicator to the trading pair your are interested in at 30m or 60m timeframe chart
2. Configure the strategy: change filters values and risk management settings until Strategy tester shows good results according to mathematical expectation
3. Set up a TradingView alert to trigger when Hammer strategy conditions are met
4. Strategy will send alerts when to enter and when to exit positions
If you want to obtain access to the indicator please send us a personal message
Quantura - Quantitative AlgorythmIntroduction
“Quantura – Quantitative Algorithm” is an invite-only Pine Script strategy designed for multi-timeframe analysis, combining technical filters with user-adjustable fundamental sentiment. It was primarily developed for cryptocurrency markets but can also be applied across other assets such as Forex, stocks, and indices. The goal is to generate structured trade signals through a confluence of techniques rather than relying on a single indicator.
Originality & Value
Quantura is not a simple mashup of indicators. Its originality comes from how multiple layers of analysis are integrated into a single decision framework . Instead of showing indicators separately, the strategy only issues trades when several conditions align simultaneously:
RSI entry triggers confirm overbought/oversold reversals.
Market structure on a higher timeframe confirms trend direction.
Order block detection highlights zones of concentrated supply and demand.
Premium/Discount zones identify potential over- and undervaluation.
HTF EMA provides trend confirmation.
Optional candlestick patterns strengthen reversal or continuation signals.
An optional correlation filter compares the main asset to a reference instrument.
This design forces agreement between different methodologies (momentum, structure, value, volume, sentiment), which reduces noise compared to using them in isolation.
Functionality & Indicators
Entry trigger: RSI exits from extreme zones.
Filters: Only valid when all selected filters (HTF structure, EMA, order blocks, premium/discount, candlesticks, correlation, volume) confirm the direction.
Fundamental bias: User-defined sentiment and analysis settings (bullish, bearish, neutral) influence whether long or short trades are permitted.
Exits: ATR-based take profit and stop loss, with optional breakeven, opposite-signal exit, and session-end exit.
Visualization: Buy/Sell markers, trend-colored candles, and an optional dashboard summarizing indicator status.
Parameters & Customization
Timeframes: Independent HTF and LTF selection.
Trading direction: Long / Short / Both.
Session and weekday filters.
RSI length and thresholds.
Filters: HTF structure, order blocks, premium/discount, EMA, candlestick, ATR volatility, volume zones, correlation.
Exit rules: ATR multipliers for TP/SL, breakeven logic, session-end exit, opposite-signal exit.
Visuals: Toggle signals, candles, dashboard, custom colors.
Default Properties (Strategy Settings)
Initial Capital: 100,000 USD
Position Size: 15% of equity per trade
Commission: 0.25%
Slippage: enabled
Pyramiding: 0 (one position at a time)
Note: The position sizing of 15% equity per trade is intentionally set for backtesting demonstration. In real trading, risking this much is considered aggressive. Most traders prefer to risk 1-5% of equity, and rarely above 10%.
Backtesting & Performance
Backtests on BTCUSD (2 years) with the above defaults showed:
112 trades
Win rate: 40%
Profit factor: 1.4
Maximum drawdown: 34%
These results illustrate how the confluence model behaves, but they are not predictive of future performance . The trade sample size (72 trades) is below the 100+ usually recommended for statistical robustness. Users should re-test with their own preferred symbols, settings, and timeframes.
Risk Management
ATR-based stops and targets scale with volatility.
Commission and slippage are included by default for realistic modeling.
Opposite-signal exit helps capture trend reversals.
Session-end exit can close intraday positions before illiquid hours.
Breakeven option protects profits when available.
Although the default allocation uses 15% per trade for demonstration, this is not a recommendation. Users are encouraged to adjust risk sizing downwards to sustainable levels (commonly 1-5%).
Limitations & Market Conditions
Performs best in volatile, liquid markets (e.g., crypto).
May struggle in prolonged sideways markets with low volatility.
News events and fundamentals outside user inputs can override signals.
Backtests below 100 trades should be considered exploratory, not statistically conclusive.
Usage Guide
Add “Quantura – Quantitative Algorithm” to your chart in strategy mode.
Select HTF and LTF timeframes, trading direction, and session filters.
Configure confluence filters (structure, EMA, order blocks, premium/discount, candlestick, correlation, volume).
Set sentiment and analysis bias in fundamental settings.
Adjust ATR multipliers and exits.
Review buy/sell signals and analyze performance in the Strategy Tester.
Author & Access
Developed 100% by Quantura . Distributed as an Invite-Only script . Details are provided in the Author’s Instructions field.
Important: This description complies with TradingView’s Script Publishing Rules and House Rules. It does not guarantee profitability, avoids unrealistic claims, and explains how the strategy integrates multiple methods into a coherent decision framework.

rsi indicator strategyRSIBB Strategy Based on Oversold, Overrbuy Bolinger Band Band. In usoil . Time Indicators is set and the timing is in 5 minutes
An example of Long. When the green marker appears, our entry point is High High If the price fails to reject our High High, our entry will change to the next candlestick. This process will continue until we enter the position.
A marker appears in purple when the green marker appears to us, in which information appears:
The first digit related to the strategist code
The second digit is that we have a few pips to be sure of the candlestick of our entry point
The third digit is our SL that is a coefficient of overall size of yogurt (HIGH - LOW)
Charmin is the digit of our tp that is a coefficient of overall size of yogurt (HIGH - LOW)
In 6 sets
استراتژی RSIBB بر اساس اشباع فروش، اشباع خرید، باند بولینگر. در این روش، اندیکاتورهای زمانی تنظیم شده و زمانبندی ۵ دقیقه است.
مثالی از موقعیت خرید. وقتی نشانگر سبز ظاهر میشود، نقطه ورود ما High است. اگر قیمت نتواند High ما را رد کند، ورود ما به کندل بعدی تغییر میکند. این فرآیند تا زمانی که وارد موقعیت شویم ادامه خواهد داشت.
وقتی نشانگر سبز برای ما ظاهر میشود، یک نشانگر به رنگ بنفش ظاهر میشود که در آن اطلاعات زیر ظاهر میشود:
رقم اول مربوط به کد استراتژیست است.
رقم دوم این است که ما چند پیپ برای اطمینان از کندل نقطه ورود خود داریم.
رقم سوم SL ما است که ضریبی از اندازه کلی ماست (HIGH - LOW) است.
چارمین رقم tp ما است که ضریبی از اندازه کلی ماست (HIGH - LOW) است.
[MT] Strategy Backtest Template| Initial Release | | EN |
An update of my old script, this script is designed so that it can be used as a template for all those traders who want to save time when programming their strategy and backtesting it, having functions already programmed that in normal development would take you more time to program, with this template you can simply add your favorite indicator and thus be able to take advantage of all the functions that this template has.
🔴Stop Loss and 🟢Take Profit:
No need to mention that it is a Stop Loss and a Take Profit, within these functions we find the options of: fixed percentage (%), fixed price ($), ATR, especially for Stop Loss we find the Pivot Points, in addition to this, the price range between the entry and the Stop Loss can be converted into a trailing stop loss, instead, especially for the Take Profit we have an option to choose a 1:X ratio that complements very well with the Pivot Points.
📈Heikin Ashi Based Entries:
Heikin Ashi entries are trades that are calculated based on Heikin Ashi candles but their price is executed to Japanese candles, thus avoiding false results that occur in Heikin candlestick charts, this making in certain cases better results in strategies that are executed with this option compared to Japanese candlesticks.
📊Dashboard:
A more visual and organized way to see the results and necessary data produced by our strategy, among them we can see the dates between which our operations are made regardless if you have activated some time filter, usual data such as Profit, Win Rate, Profit factor are also displayed in this panel, additionally data such as the total number of operations, how many were gains and how many losses, the average profit and loss for each operation and finally the maximum profits and losses followed, which are data that will be very useful to us when we elaborate our strategies.
Feel free to use this template to program your own strategies, if you find errors or want to request a new feature let me know in the comments or through my social networks found in my tradingview profile.
| Update 1.1 | | EN |
➕Additions: '
Time sessions filter and days of the week filter added to the time filter section.
Option to add leverage to the strategy.
5 Moving Averages, RSI, Stochastic RSI, ADX, and Parabolic Sar have been added as indicators for the strategy.
You can choose from the 6 available indicators the way to trade, entry alert or entry filter.
Added the option of ATR for Take Profit.
Ticker information and timeframe are now displayed on the dashboard.
Added display customization and color customization of indicator plots.
Added customization of display and color plots of trades displayed on chart.
📝Changes:
Now when activating the time filter it is optional to add a start or end date and time, being able to only add a start date or only an end date.
Operation plots have been changed from plot() to line creation with line.new().
Indicator plots can now be controlled from the "plots" section.
Acceptable and deniable range of profit, winrate and profit factor can now be chosen from the "plots" section to be displayed on the dashboard.
Aesthetic changes in the section separations within the settings section and within the code itself.
The function that made the indicators give inputs based on heikin ashi candles has been changed, see the code for more information.
⚙️Fixes:
Dashboard label now projects correctly on all timeframes including custom timeframes.
Removed unnecessary lines and variables to take up less code space.
All code in general has been optimized to avoid the use of variables, unnecessary lines and avoid unnecessary calculations, freeing up space to declare more variables and be able to use fewer lines of code.
| Lanzamiento Inicial | | ES |
Una actualización de mi antiguo script, este script está diseñado para que pueda ser usado como una plantilla para todos aquellos traders que quieran ahorrar tiempo al programar su estrategia y hacer un backtesting de ella, teniendo funciones ya programadas que en el desarrollo normal te tomaría más tiempo programar, con esta plantilla puedes simplemente agregar tu indicador favorito y así poder aprovechar todas las funciones que tiene esta plantilla.
🔴Stop Loss y 🟢Take Profit:
No hace falta mencionar que es un Stop Loss y un Take Profit, dentro de estas funciones encontramos las opciones de: porcentaje fijo (%), precio fijo ($), ATR, en especial para Stop Loss encontramos los Pivot Points, adicionalmente a esto, el rango de precio entre la entrada y el Stop Loss se puede convertir en un trailing stop loss, en cambio, especialmente para el Take Profit tenemos una opción para elegir un ratio 1:X que se complementa muy bien con los Pivot Points.
📈Entradas Basadas en Heikin Ashi:
Las entradas Heikin Ashi son operaciones que son calculados en base a las velas Heikin Ashi pero su precio esta ejecutado a velas japonesas, evitando así́ los falsos resultados que se producen en graficas de velas Heikin, esto haciendo que en ciertos casos se obtengan mejores resultados en las estrategias que son ejecutadas con esta opción en comparación con las velas japonesas.
📊Panel de Control:
Una manera más visual y organizada de ver los resultados y datos necesarios producidos por nuestra estrategia, entre ellos podemos ver las fechas entre las que se hacen nuestras operaciones independientemente si se tiene activado algún filtro de tiempo, datos usuales como el Profit, Win Rate, Profit factor también son mostrados en este panel, adicionalmente se agregaron datos como el número total de operaciones, cuantos fueron ganancias y cuantos perdidas, el promedio de ganancias y pérdidas por cada operación y por ultimo las máximas ganancias y pérdidas seguidas, que son datos que nos serán muy útiles al elaborar nuestras estrategias.
Siéntete libre de usar esta plantilla para programar tus propias estrategias, si encuentras errores o quieres solicitar una nueva función házmelo saber en los comentarios o a través de mis redes sociales que se encuentran en mi perfil de tradingview.
| Actualización 1.1 | | ES |
➕Añadidos:
Filtro de sesiones de tiempo y filtro de días de la semana agregados al apartado de filtro de tiempo.
Opción para agregar apalancamiento a la estrategia.
5 Moving Averages, RSI, Stochastic RSI, ADX, y Parabolic Sar se han agregado como indicadores para la estrategia.
Puedes escoger entre los 6 indicadores disponibles la forma de operar, alerta de entrada o filtro de entrada.
Añadido la opción de ATR para Take Profit.
La información del ticker y la temporalidad ahora se muestran en el dashboard.
Añadido personalización de visualización y color de los plots de indicadores.
Añadido personalización de visualización y color de los plots de operaciones mostradas en grafica.
📝Cambios:
Ahora al activar el filtro de tiempo es opcional añadir una fecha y hora de inicio o fin, pudiendo únicamente agregar una fecha de inicio o solamente una fecha de fin.
Los plots de operaciones han cambiados de plot() a creación de líneas con line.new().
Los plots de indicadores ahora se pueden controlar desde el apartado "plots".
Ahora se puede elegir el rango aceptable y negable de profit, winrate y profit factor desde el apartado "plots" para mostrarse en el dashboard.
Cambios estéticos en las separaciones de secciones dentro del apartado de configuraciones y dentro del propio código.
Se ha cambiado la función que hacía que los indicadores dieran entradas en base a velas heikin ashi, mire el código para más información.
⚙️Arreglos:
El dashboard label ahora se proyecta correctamente en todas las temporalidades incluyendo las temporalidades personalizadas.
Se han eliminado líneas y variables innecesarias para ocupar menos espacio en el código.
Se ha optimizado todo el código en general para evitar el uso de variables, líneas innecesarias y evitar los cálculos innecesarios, liberando espacio para declarar más variables y poder utilizar menos líneas de código.

GT 5.1 Strategy═════════════════════════════════════════════════════════════════════════
█ OVERVIEW
People often look an indicator in their technical analysis to enter a position. We may also need to look at the signals of one or more indicators to verify the signals given by some indicators. In this context, I developed a strategy to test whether it really works by choosing some of the indicators that capture trend changes with the same characteristics. Also, since the subject is to catch the trend change, I thought it would be right to include an indicator using the heikin ashi logic. By averaging and smoothing the market noise, Heiken Ashi makes it easier to detect the direction of the trend helps to see possible reversal points on the chart. However, it should be noted that Heiken Ashi is a lagging indicator.
I picked 5 different indicators (but their purpose are similar) and combined them to produce buy and sell signals based on your choice(not repaint). First of all let's get some information about our indicators. So you will understand me why i picked these indicators and what is the meaning of their signals.
1 — Coral Trend Indicator by LazyBear
Coral Trend Indicator is a linear combination of moving averages, all obtained by a triple or higher order exponential smoothing. The indicator comes with a trend indication which is based on the normalized slope of the plot. the usage of this indicator is simple. When the color of the line is green that means the market is in uptrend. But when the color is red that means the market is in downtrend.
As you see the original indicator it is simple to find is it in uptrend or downtrend.
So i added a code to find when the color of the line change. When it turns green to red my script giving sell signals, when it turns red to green it gives buy signals.
I hide the candles to show you more clearly what is happening when you choose only Coral Strategy. But sometimes it is not enough only using itself. Even if green dots turn to red it continues in uptrend. So we need a to look another indicator to approve our signal.
2 — SSL channel by ErwinBeckers
Known as the SSL , the Semaphore Signal Level channel is an indicator that combines moving averages to provide you with a clear visual signal of price movement dynamics. In short, it's designed to show you when a price trend is forming. This indicator creates a band by calculating the high and low values according to the determined period. Simply if you decide 10 as period, it calculates a 10-period moving average on the latest 10 highs. Calculate a 10-period moving average on the latest 10 lows. If the price falls below the low band, the downtrend begins, if the price closes above the high band, the uptrend begins. Lets look the original form of indicator and learn how it using.
If the red line is below and the green band is above, it means that we are in uptrend, and if it is on the opposite side, it means that we are in downtrend. Therefore, it would be logical to enter a position where the trend has changed. So i added a code to find when the crossover has occured.
As you see in my strategy, it gives you signals when the trend has changed. But sometimes it is not enough only using this indicator itself. So lets look 2 indicator together in one chart.
Look circle SSL is saying it is in downtrend but Coral is saying it has entered in uptrend. if we just look to coral signal it can misleads us. So it can be better to look another indicator for validating our signals.
3 — Heikin Ashi RSI Oscillator by JayRogers
The Heikin-Ashi technique is used by technical traders to identify a given trend more easily. Heikin-Ashi has a smoother look because it is essentially taking an average of the movement. There is a tendency with Heikin-Ashi for the candles to stay red during a downtrend and green during an uptrend, whereas normal candlesticks alternate color even if the price is moving dominantly in one direction. This indicator actually recalculates the RSI indicator with the logic of heikin ashi. Due to smoothing, the bars are formed with a slight lag, reflecting the trend rather than the exact price movement. So lets look the original version to understand more clearly. If red bars turn to green bars it means uptrend may begin, if green bars turn to red it means downtrend may begin.
As you see HARSI giving lots of signal some of them is really good but some of them are not very well. Because it gives so much signals Now i will change time period and lets look same chart again.
Now results are better because of heikin ashi's logic. it is not suitable for day traders, it gives more accurate result when using the time period is longer. But it can be useful to use this indicator in short time periods using with other indicators. So you may catch the trend changes more accurately.
4 — MACD DEMA by ToFFF
This indicator uses a double EMA and MACD algorithm to analyze the direction of the trend. Though it might seem a tough task to manage the trades with the help of MACD DEMA once you know how the proper way to interpret the signal lines, it will be an easy task.
This indicator also smoothens the signal lines with the time series algorithm which eventually makes the higher time frame important. So, expecting better results in the lower time frame can result in big losses as the data reading from the MACD DEMA will not be accurate. In order to understand the function of this indicator, you have to know the functions of the EMA also.
The exponential moving average tends to give more priority to the recent price changes. So, expecting better results when the volatility is very high is a very risky approach to trade the market. Moreover, the MACD has some lagging issues compared to the EMA, so it is super important to use a trading method that focuses on the higher time frame only. What does MACD 12 26 Close 9 mean? When the DEMA-9 crosses above the MACD(12,26), this is considered a bearish signal. It means the trend in the stock – its magnitude and/or momentum – is starting to shift course. When the MACD(12,26) crosses above the DEMA-9, this is considered a bullish signal. Lets see this indicator on Chart.
When the blue line crossover red line it is good time to buy. As you see from the chart i put arrows where the crossover are appeared.
When the red line crossover blue line it is good time to sell or exit from position.
5 — WaveTrend Oscillator by LazyBear
This is a technical indicator that creates high and low bands between two values. It then creates a trend indicator that draws waves with highs and lows within these boundaries. WaveTrend is a widely used indicator for finding direction of an asset.
Calculation period: number of candles used to calculate WaveTrend, defaults to 10. Averaging period: number of candles used to average WaveTrend, defaults to 21.
As you see in chart when the lines crossover occured my strategy gives buy or sell signals.
═════════════════════════════════════════════════════════════════════════
█ HOW TO USE
I hope you understand how the indicators I mentioned above work and what they are used for. Now, I will explain in detail how to use the strategy I have created.
When you enter the settings section, you will see 5 types of indicators. If you want to use the signals of the indicators, simply tick the box next to the indicators. Also, under each option there is an area where you can set the "lookback". This setting is a field that will make the signals overlap when you select more than one option. If you are going to trade with only one option, you should make sure that this field is 0. Otherwise, it may continue to generate as many signals as you choose.
Lets see in chart for easy understanding.
As you see chart, if i chose only HARSI with lookback 0 (HARSI and CORAL should be 1 minumum because of algorithm-we looking 1 bar before, others 0 because we are looking crossovers), it will give signals only when harsı bar's color changed. But when i changed Lookback as 7 it will be like this in chart.
Now i will choose 2 indicator with settings of their lookback 0.
As you see it will give signals when both of them occurs same time. But HARSI is an indicator giving very early signal so we can enter position 5-6 bars after the first bar color change. So i will change HARSI Lookback settings as 7. Lets look what happens when we use lookback option.
So it wil be useful to change lookback settings to find best signals in each time period and in each symbol. But it shouldnt be too high. Because you can be late to catch trend's starting.
this is an image of MACD and WAVE trend used and lookback option are both 6.
Now lets see an example with 3 options are chosen with lookback option 11-1-5
Now lets talk about indicators settings. After strategy options you will see each indicators settings, you can change their settings as you desired. So each indicators signal will be changed according to your adjustment.
I left strategy options with default settings. You can change it manually as if you want.
═════════════════════════════════════════════════════════════════════════
█ LIMITATIONS: Don't rely on non-standard charts results. For example Heikin Ashi is a technical analysis method used with the traditional candlestick chart.Heikin Ashi vs. Candlestick Chart: The decisive visual difference between Heikin Ashi and the traditional chart is that Heikin Ashi flattens the traditional candlestick chart using a modified formula.
The primary advantage of Heikin Ashi is that it makes the chart more reader-friendly and helps users identify and analyze trends .
Because Heikin Ashi provides averaged price information rather than real-time price and reacts slowly to volatility — not suitable for scalpers and high-frequency traders. I added HARSI indicator as a supportive signal because it is useful with using CORAL and SSL channel indicators. If you change your candle types to Heikin Ashi , your profit will change in good way but dont rely on it.
═════════════════════════════════════════════════════════════════════════
█ THANKS:
Special thanks to authors of the scripts that i used.
@LazyBear and @ErwinBeckers and @JayRogers and @ToFFF
═════════════════════════════════════════════════════════════════════════
█ DISCLAIMER
Any trade decisions you make are entirely your own responsibility.

[MT Trader] Backtest template w/ Supertrend Strategy---EN: In this strategy template you will find some functions already pre-programmed to be used in your strategies to speed up the programming process, among them we can highlight the default stop loss and take profit functions, which will help to set easily and quickly, defining the price range in which we want to prevent large losses or protect our profits from unexpected market movements.
🔴 Stop Loss: Among the functions of the stop loss are the 4 most known, first we have the fixed percentage range (%) and price ($), when the price reaches this fixed price will limit the losses of the operation avoiding larger losses, then we have the average true range (ATR), a moving average of true range and X period that can give us good reference points to place our stop loss, finally the last point higher or lower is the most used by traders to place their stop loss.
In addition, the price range between the entry and stop loss can be converted into a trailing stop loss.
🟢 Take Profit: We have 3 options for take profit, just like stop loss, the fixed range of percentage(%) and price($), are available, in addition to this we have the 1:# ratio option, which multiplies by X number the range between the entry and stop loss to use it as take profit, perfect for strategies that use ATR or last high/low point for their strategy.
📈 Heikin Ashi Entrys: The heikin ashi entries are trades that are calculated based on heikin ashi candles but their price is executed in Japanese candles, thus avoiding the false results that occur in heikin candlestick charts, making that in certain cases better results are obtained in the strategies that are executed with this option compared to Japanese candlesticks.
📊 Dashboard: A more visual and organized way to see the results and data needed for our strategy.
Feel free to use this template to program your own strategies, if you find bugs or want to request a new feature let me know in the comments or through my telegram @hvert_mt
__________________________________________________________________________________________________________________________________________________
---ES: En esta plantilla de estrategia podrás encontrar algunas funciones ya pre-programadas para ser usadas en tus estrategias para acelerar procesos de programación, entre ellas podemos destacar las funciones por defecto de stop loss y take profit, que ayudaran a establecer de manera fácil y rápida, definiendo los rango de precio en los que queremos prevenirnos de perdidas grandes o proteger nuestras ganancias de movimientos inesperados del mercado.
🔴 Stop Loss: Entre las funciones del stop loss están las 4 más conocidas, en primer lugar tenemos el rango de porcentaje fijo(%) y el precio($), cuando el precio alcance este precio fijo se limitaran las perdidas de la operación evitando perdidas mas grandes, después tenemos el promedio de rango verdadero(ATR), una media móvil del rango verdadero y X periodo que nos puede dar buenos puntos de referencia para colocar nuestro stop loss, por ultimo el ultimo punto mas alto o mas bajo es de los mas usados por los traders para colocar su stop loss.
Adicional a esto, el rango de precio entre la entrada y el stop loss se puede convertir en un trailing stop loss.
🟢 Take Profit: Tenemos 3 opciones para take profit, al igual que en el stop loss, el rango fijo de porcentaje(%) y precio($) se encuentran disponibles, adicional a esto tenemos la opción de ratio 1:#, que multiplica por X numero el rango entre la entrada y el stop loss para usarlo como take profit, perfecto para estrategias que usen ATR o ultimo punto alto/bajo.
📈 Entradas Heikin Ashi: Las entradas Heikin Ashi son trades que son calculados en base a las velas Aeikin Ashi pero su precio esta ejecutado a velas japonesas, evitando así los falsos resultados que se producen en graficas de velas Heikin, esto haciendo que en ciertos casos se obtengan mejores resultados en las estrategias que son ejecutadas con esta opción en comparación con las velas japonesas.
📊 Panel de Control: Una manera mas visual y organizada de ver los resultados y datos necesarios de nuestra estrategia.
Siéntete libre de usar esta plantilla para programar tus propias estrategias, si encuentras errores o quieres solicitar una nueva función házmelo saber en los comentarios o a través de mi Telegram: @hvert_mt
