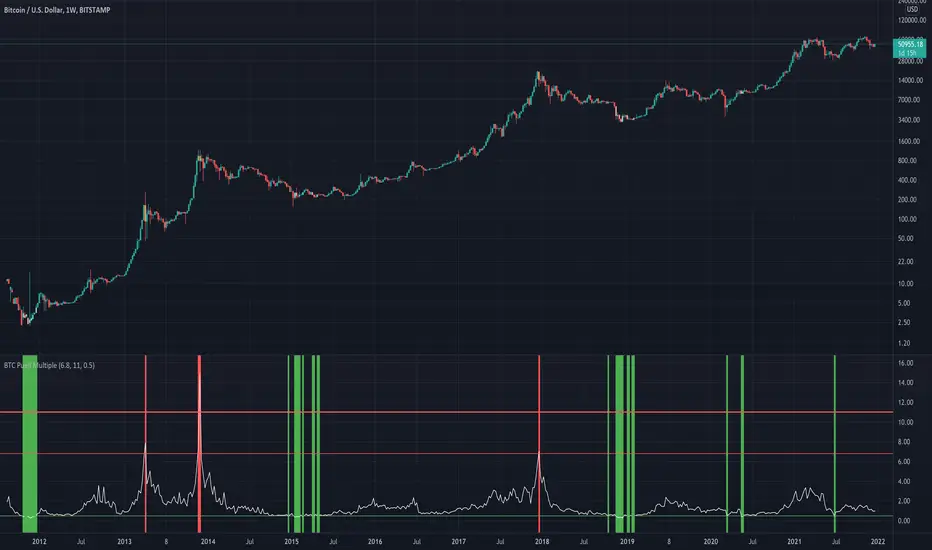
BTC Puell Multiple with alert functionThe Puell Multiple examines the fundamentals of mining profitability and the way they shape market cycles. It is calculated by taking a ratio of daily coin issuance (in USD) and the 365 moving average of daily coin issuance (in USD).
Interpretation of the Puell Multiple can generally be considered in the following framework:
high values indicate that current miner profitability if high compared to the yearly average. As such, the incentive for miners to liquidate their treasuries is high and greater sell pressure may be expected.
Low values indicate that current miner profitability is low compared to the yearly average. As such, income stress may become a factor, and some miners may need to start reducing hash-power by switching off rigs. This increases the hash-share of remaining miners who can then sell fewer coins to cover their operations, reducing their impact on liquid supply.
Halving events will drop the current coin issuance by 50% relative to the preceding year creating an immediate halving of the Puell Multiple also. The effect on miner profitability will thus be as per the point on low values above.
Wyszukaj w skryptach "BTC"
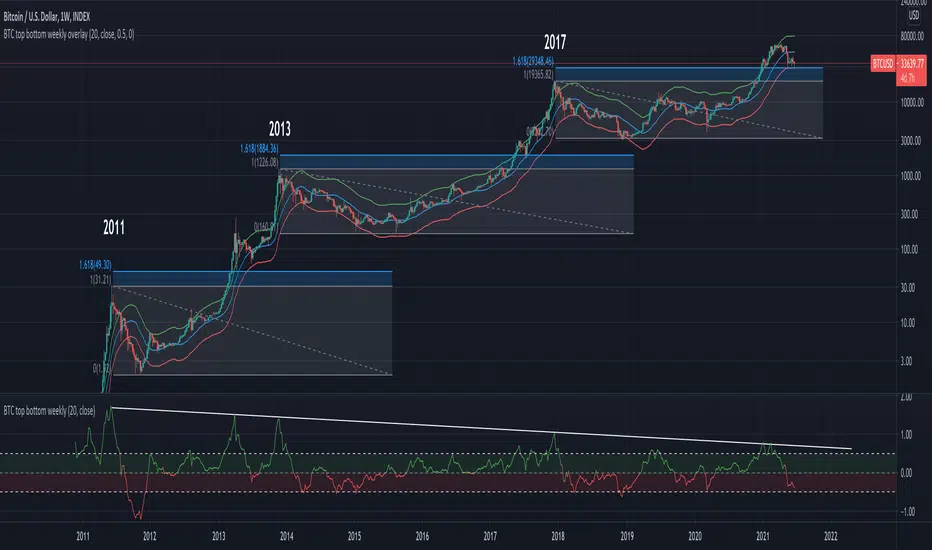
BTC top bottom weekly oscillatorThis indicator is based on the 20 weekly simple moving average and it could be used to help finding potential tops and bottoms on a weekly BTC chart.
This version uses an "oscillator" presentation, it fluctuates around the value zero.
The indicator plots 0 when the close price is near the 20 weekly moving average.
If it's below 0 it reflects the price being below the 20 weekly moving average, and opposite for above.
IT's possible to see how many times the price has hit the 0.5 coef support. In one case it hit 0.6 showing that the 0.5 support can be broken.
The indicator is calculated as Log(close / sma(close))
Instructions:
- Use with the symbol INDEX:BTCUSD so you can see the price since 2010
- Set the timeframe to weekly
Optionals:
- change the coef to 0.6 for a more conservative bottom
- change the coef to 0.4 for a more conservative top
BTC|Scanner| v0.6b INDICATOR- This indicator looks for the optimal entry points to a long position.
- Based on mathematical calculations on the beginning of market activity, as well as on the readings of double/triple RSI, MACD, SMA.
- The trend is determined based on the Heiken Ashi candles.
- This indicator can be used on a 30m timeframe and does not require fine tuning.
- This indicator has a setting for choosing the ratio of market activity and choosing the aggressiveness of trading.

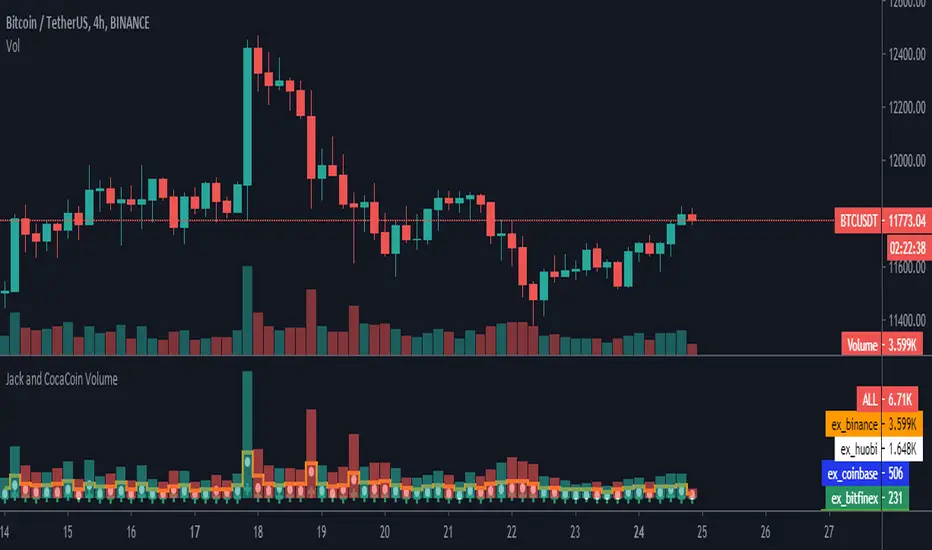
BTC aggregated volume Index [Benson]Aggregate 10 most significant BTC trading pairs' volume on the market.
Bitfinex:BTCUSD
Bitstamp:BTCUSD
Coinbase:BTCUSD
Kraken:BTCUSD
Kraken:BTCEUR
Bitflyer:BTCJPY
BINANCE:BTCUSDT
HUOBI:BTCUSDT
OKEX:BTCUSDT
Bitstamp:BTCEUR
Setting (user input)
1. You can set length to see how SMA moves. Default is 7.
2. You can set std difference. If the volume is difference*std higher than average, the pillar would be orange, if difference*std is less than average, the pillar would be green, otherwise the pillar would be black. Default is 1.
3. You can set the volume in USD or in BTC. Default is in USD.

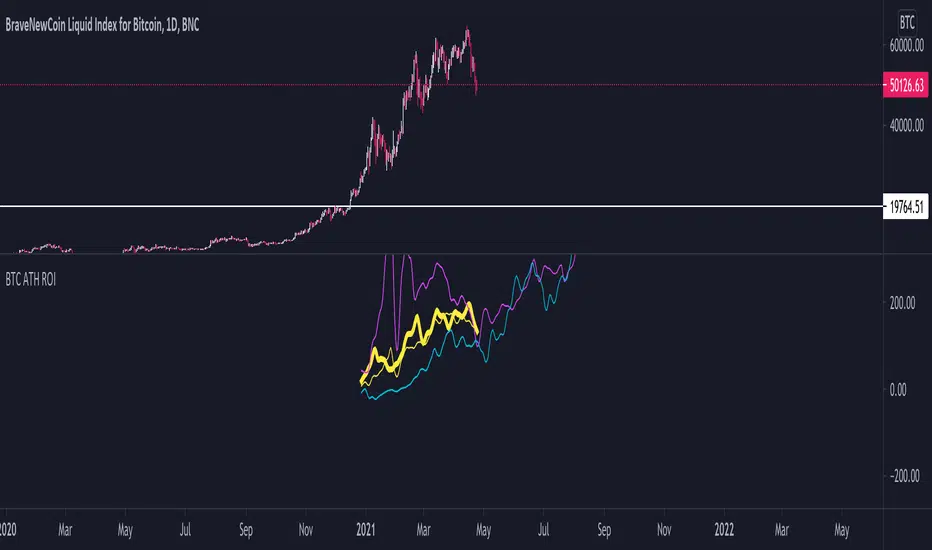
BTC ATH ROIThis indicator shows the ROI % of Bitcoin from when it passed its ATH of the previous bull cycle. I found it interesting that each time it crossed its ATH it took around 260-280 days to peak for each one. This bull run seems to follow between both of the previous bull runs including this recent dip.
There are a couple issues I want to fix but can't figure out:
1. You need to completely scroll out and move towards 2013 on the Daily chart for all 3 lines to show up. Would be nice to load all of that data at the start.
2. I can't query the value of the plots after they have been offset. This would be useful to create a prediction bias for the current plot so would could see where btc might go.
If you peeps know of a way to load all data or query plot values after offsets, please share. That would be awesome.
BTC Futures Premium IndexThe script collects data from various Futures and Spot prices and creates an index which identifies buy and sell zones . When combined with Open interest , this tool can be invaluable in making critical decisions .
Good Luck and I would request a like if you can spare that click :)
Thanks in advance and Happy Trading

BTC Multi Exchange Perpetual PremiumThis script tracks the premium/discount of Bitcoin perpetual contracts at various exchanges.
The premium/discount is calculated against an index price. The index price is calculated from spot exchange prices and are weighted as follows:
Bitstamp:28,81%
Bittrex:5,5%
Coinbase: 38,07%
Gemini: 7,34%
Kraken: 20,28
The difference between this script and other available scripts, is that exciting script seems to only focus on one exchange. This script is also open source.

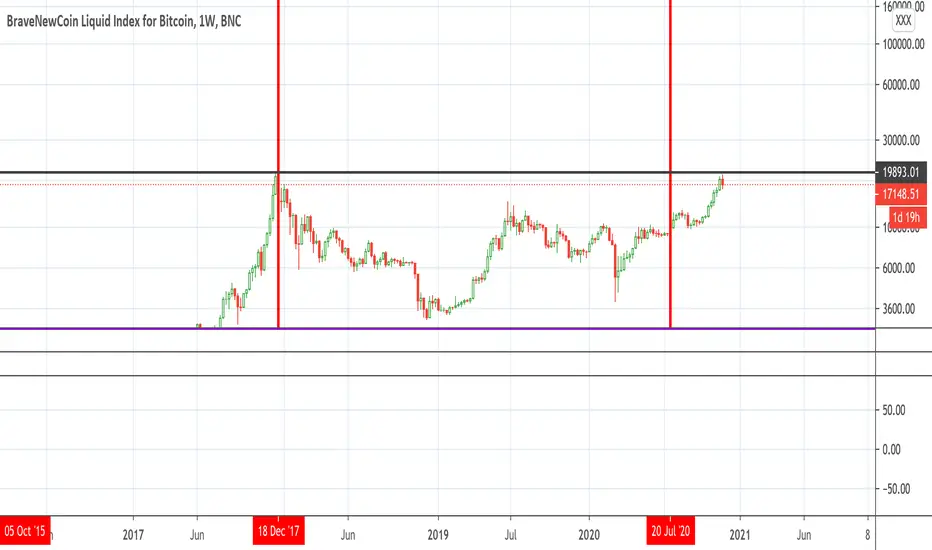
BTC ATHThis script should only be used on BLX chart.
This script intends to give a rough ATH zone for BTC ( BLX )
This indicator has a variable fit (x) dependant on the length of its historical data set, in other words this is overfitted so ATH could go higher or stop before crossing.

BTC Premium (Grayscale & Coinbase)This indicator plots the bitcoin premium on Grayscale and Coinbase in %.

BTC On-Chain vs Exchange Volume ratioThis indicator compares on-chain transaction volume in BTC to spot exchange volume also denominated in BTC.
For the on-chain tx volume QUANDL data is used and for the exchange volume an aggregated index is made of some of the top spot exchanges.
Next a percentage ratio is made to give an idea of what type of volume is dominating.
Positive values (green) means on-chain volume is higher than exchange volume.
Negative values (red) means on-chain volume is lower than exchange volume.
These are the exchanges used for the spot index:
Binance USDT
Huobi USDT
Coinbase USD
Bitfinex USD
Bitstamp USD
Kraken USD
Bitflyer JPY
Bithumb KRW
Bittrex USDT
Poloniex USDT
In the settings you can choose to include or exclude certain exchanges.
There's also a smoothed moving average of which you can choose the length.
Because of limitations with the data you can only use this indicator on the daily time frame or higher.

BTC risk gagueThis indicator measures the risk of buying/selling BTC at a certain price. It calculates the percentage difference between the 20 weekly SMA and price at the weekly close. This indicator is designed to be used under weekly scale.
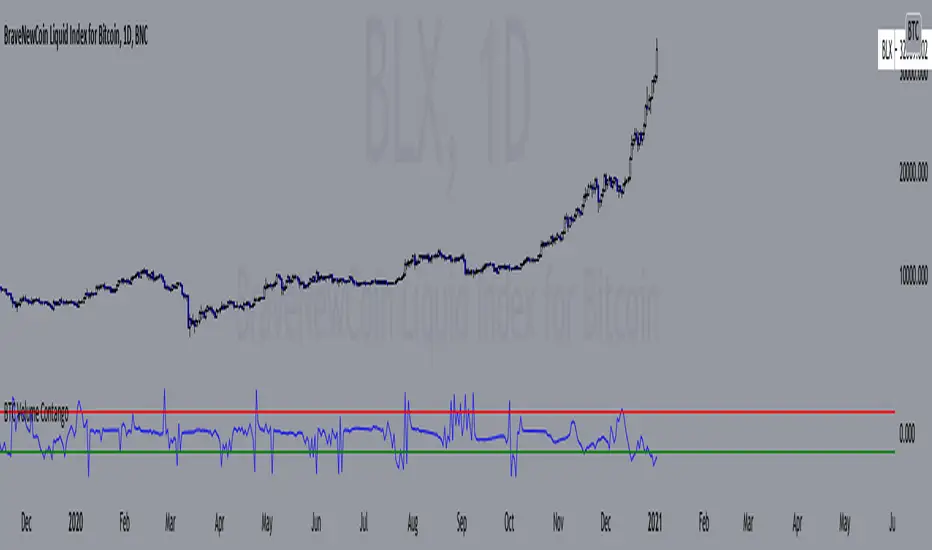
BTC Volume Contango IndexBased on my previous script "BTC Contango Index" which was inspired by a Twitter post by Byzantine General:
This is a script that shows the contango between spot and futures volumes of Bitcoin to identify overbought and oversold conditions. When a market is in contango, the volume of a futures contract is higher than the spot volume. Conversely, when a market is in backwardation, the volume of the futures contract is lower than the spot volume.
The aggregate daily volumes on top exchanges are taken to obtain Total Spot Volume and Total Futures Volume. The script then plots (Total Futures Volume/Total Spot Volume) - 1 to illustrate the percent difference (contango) between spot and futures volumes of Bitcoin. This data by itself is useful, but because aggregate futures volumes are so much larger than spot volumes, no negative values are produced. To correct for this, the Z-score of contango is taken. The Z-score (z) of a data item x measures the distance (in standard deviations StdDev) and direction of the item from its mean (U):
Z-score = (x - U) / StDev
A value of zero indicates that the data item x is equal to the mean U, while positive or negative values show that the data item is above or below the mean (x Values of +2 and -2 show that the data item is two standard deviations above or below the chosen mean, respectively, and over 95.5% of all data items are contained within these two horizontal references). We substitute x with volume contango C, the mean U with simple moving average ( SMA ) of n periods (50), and StdDev with the standard deviation of closing contango for n periods (50), so the above formula becomes: Z-score = (C - SMA (50)) / StdDev(C,50).
When in contango, Bitcoin may be overbought.
When in backwardation, Bitcoin may be oversold.
The current bar calculation will always look incorrect due to TV plotting the Z-score before the bar closes.

BTC - Corrections in Bull-market-This indicator is tailor-made for BTC-
Based on his historical data in bull markets:
If the indicator turns red the probability of a correction is 82% in the short term.
Else the probability of prices continuing climbing is higher.

BTC Flow Data Bithanos BFD黑科技 灭霸比特币OKCOIN:BTCUSDIDX
BTC Flow Data short title “BFD 黑科技”
1.谨慎追空 Be cautious chasing short
2.谨慎追多 Be cautious chasing long
说明:
当指标提示谨慎追空时候,市场容易突然拉升恶意清算空头仓位;When the indicator prompts to cautiously chase the short, the market is prone to suddenly pull up malicious liquidation of short positions;
当指标提示谨慎追多时候,市场容易突然下跌恶意清算多头仓位;When the indicator prompts to chase more carefully, the market is prone to suddenly fall and maliciously liquidate long positions;
3.牛市见底 Bull market bottomed out
4.熊市见顶 Bear market price peaked
说明:
当市场处于牛市,指标提示牛市见底,当多重牛市见底出现后,市场容易回调结束,酝酿一波上涨行情;When the market is in a bull market, the indicator prompts the bull market to bottom out. When multiple bull markets bottom out, it is easy for the market to end and a wave of rising prices is brewing;
当市场处于熊市,指标提示熊市见顶,市场容易上涨结束,酝酿一波下跌行情;When the market is in a bear market, the indicator prompts the bear market to peak, and the market is prone to rise and end, brewing a wave of declines;
5.严禁追空 Strictly prohibit chasing short (级别划分 level stage: DD< CC< BB< AA< SS )
6.严禁追多 Strictly prohibit chasing long (级别划分 level stage: DD< CC< BB< AA< SS )
说明:
当指标提示严禁追空时候,市场容易突然猛烈拉升清算空头仓位;指标数据级别越高,猛烈拉升的幅度可能就越大;When the indicator prompts that chasing shorts is strictly prohibited, the market is prone to suddenly pull up to clear short positions; the higher the indicator data level, the greater the magnitude of the sharp pull;
当指标提示严禁追多时候,市场容易突然猛烈下跌清算多头仓位;指标数据级别越高,猛烈下跌的幅度可能就越大;When the indicator reminds that it is strictly forbidden to chase more, the market is prone to suddenly fall and liquidate long positions; the higher the indicator data level, the greater the magnitude of the sharp decline;
7.爆空警告 Short Liquidation Warning
8.爆多警告 Long Liquidation Warning
说明:
当指标提示爆空警告时候,市场容易突然超级猛烈拉升清算空头仓位,甚至容易形成日线周线级别价格大底部;When the indicator prompts a burst warning, the market is prone to suddenly and violently pull up the liquidation of short positions, and it is even easy to form a large bottom of the daily or weekly price level;
当指标提示爆多警告时候,市场容易突然超级猛烈下跌清算多头仓位,甚至容易形成日线周线级别价格大顶部;When the indicator prompts a burst warning, the market is prone to suddenly and violently fall and liquidate long positions, and it is even easy to form a large peak of the daily or weekly price ;

BTC difficulty adjustmentsDraws background columns indicating BTC difficulty adjustments
Green = positive adjustments
Red = negative adjustments
Use Threshold mode and Threshold to look for adjustments larger or equal to Threshold value
Use on DAILY timeframe

BTC D&T Index by BensonThis indicator shows the long-term bottom and top of BTC's price.
Factors including hashrate, future market sentiment and CME's open data.
Use this indicator to identify the best timing to buy or sell BTC.
Note: the indicator should only be applied in D timeframe.
這個指標用來標示比特幣價格長週期的底部與頂部。
指標參考了比特幣算力、遠期合約基差、永續合約資金費率以及芝加哥期貨交易所的大戶持倉數據。
善用這個指標去找出低價掃貨或是高價賣出比特幣最好的時機。
備註:指標只適用在「日」時框

BTC circulating supply [peregringlk]Just as simple as it sounds. The BTC circulating supply, deduced by using BTC_capitalization / BTCUSD.

BTC Mayer Multiple BandsIntroduced by Trace Mayer as a way to gauge the current price of Bitcoin against its long range historical price movements (200 day moving average), the Mayer Multiple highlights when Bitcoin is overbought or oversold in the context of longer time frames.
It's worth noting that as the market becomes larger and less volatile, the peaks are becoming less exaggerated. This is because a 200 day moving average baseline is a static yardstick against an ever growing, more stable, Bitcoin market. We should recalibrate what constitutes the overbought/oversold extremes on this chart accordingly.
Idea by CryptoKea. Original author:

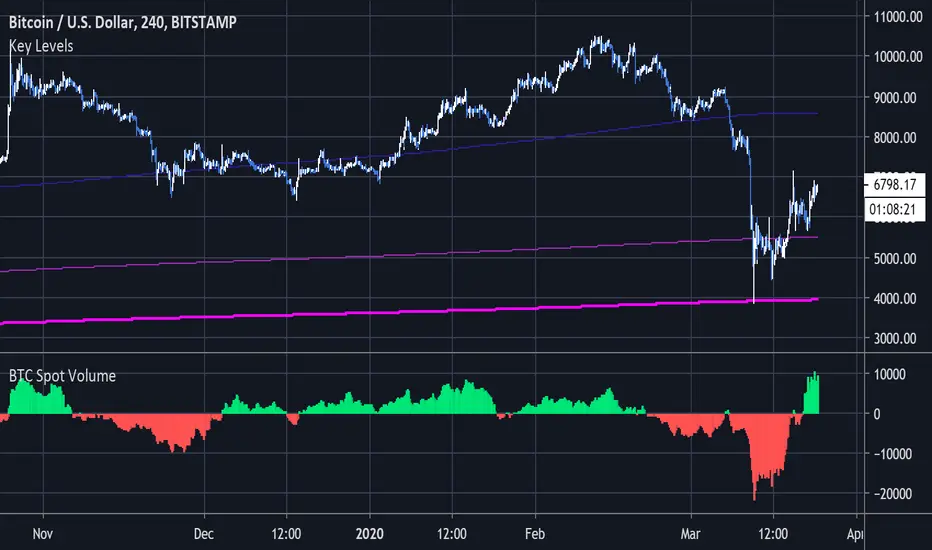
BTC Net Volume Delta (Spot)One of my favorite indicators for trend analysis. We sum the volume from all significant BTC Spot exchanges and subtract the sell volume from the buy volume for a cumulative total. A futures version is also available but spot volume is more consistent for analysis. To follow trends you can buy when sell momentum is decreasing, and sell when buy momentum is decreasing.
Do you have any ideas for monitoring sentiment or open interest across multiple exchanges? Message me and I will try to make it happen.
BTC FS Diff / Percentage (XBTH20)Shows price difference by a percentage of future (BITMEX:XBTH20) and spot index (BITMEX:XTB) .
