BTC Valuation
The BTC Valuation indicator
is a powerful tool designed to assist traders and analysts in evaluating the current state of Bitcoin's market valuation. By leveraging key moving averages and a logarithmic trendline, this indicator offers valuable insights into potential buying or selling opportunities based on historical price value.
Key Features:
200MA/P (200-day Moving Average to Price Ratio):
Provides a perspective on Bitcoin's long-term trend by comparing the current price to its 200-day Simple Moving Average (SMA).
A positive value suggests potential undervaluation, while a negative value may indicate overvaluation.
50MA/P (50-day Moving Average to Price Ratio):
Focuses on short-term trends, offering insights into the relationship between Bitcoin's current price and its 50-day SMA.
Helps traders identify potential bullish or bearish trends in the near term.
LTL/P (Logarithmic TrendLine to Price Ratio):
Incorporates a logarithmic trendline, considering Bitcoin's historical age in days.
Assists in evaluating whether the current price aligns with the long-term logarithmic trend, signaling potential overvaluation or undervaluation.
How to Use:
Z Score Indicator Integration:
The BTC Valuation indicator leverages the Z Score Indicator to score the ratios in a statistical way.
Statistical scoring provides a standardized measure of how far each ratio deviates from the mean, aiding in a more nuanced and objective evaluation.
Z Score Indicator
This BTC Valuation indicator provides a comprehensive view of Bitcoin's valuation dynamics, allowing traders to make informed decisions.
While indicators like BTC Valuation provide valuable insights, it's crucial to remember that no indicator guarantees market predictions.
Traders should use indicators as part of a comprehensive strategy and consider multiple factors before making trading decisions.
Historical performance is not indicative of future results. Exercise caution and continually refine your approach based on market dynamics.
Wyszukaj w skryptach "BTC"

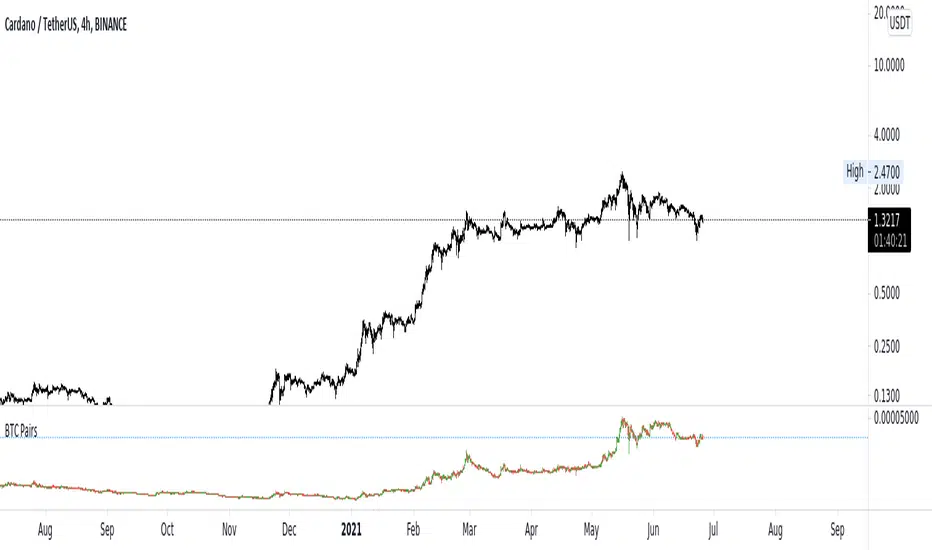
BTC PairsHi Crypto traders,
As many of you, while trading in altcoins, it is important to look at their BTC pairs also. That is why I created a script like this.
It works under these conditions:
1- The coin you are looking for must have BTC pair in the exchange of the chart. ( If an exchange does not have ADABTC while it has ADAUSDT, the script wont work )
2- The pair in that exchange must be concatenated as follows "PAIR_NAME" + "BTC" in tradingview. Ex: "ADA" + BTC" = "ADABTC"
If you have any questions or suggestion, I would be glad to hear and answer them.
Stay Safe.
BTC Health (OHLC and TEMA)The "health" (ie, price trend) of Bitcoin has a major influence on the whole cryptocurrency market. Therefore, it can be useful to check the price and trend of BTC prior to entering a new position. This indicator displays BTC candles plus a fast & slow TEMA below the primary chart, so you can check how BTC is behaving.
BTC quote is from BINANCE, using the timeframe of the main chart. TEMA periods can be customized.

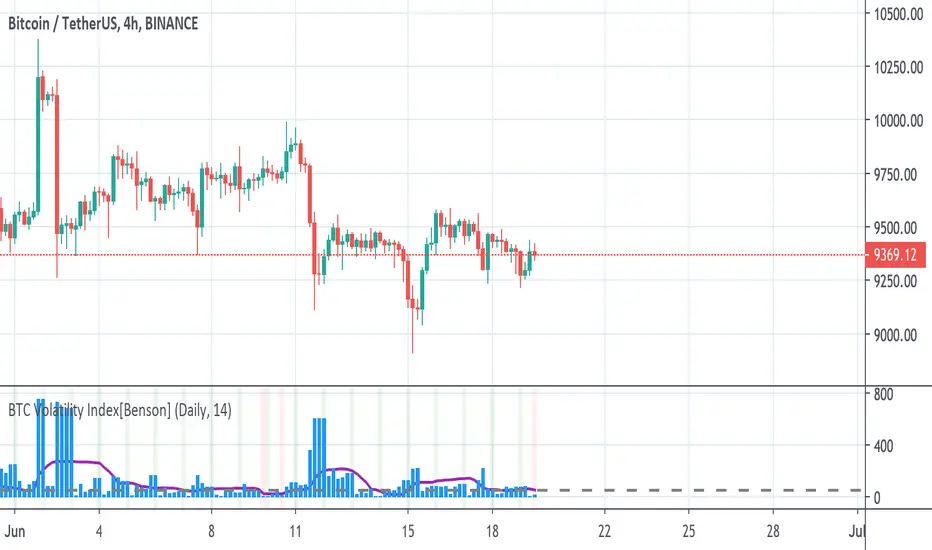
BTC Volatility Index[Benson]This indicator is for choosing the best timing to long BTC move future on FTX.
The basic idea is that when BTC's price volatility Index is relatively low(under 50 in 4hr timeframe or under 200 in D timeframe), it's more likely to have huge volatility afterwards, which it's a good time to long BTC's move future.
Green background --> Move future expected strike price
Red background --> Good timing to long BTC move future
BTC-ETH Visual DashboardOverview
A visual dashboard designed to monitor the statistical relationship between BTC and ETH.
The indicator displays filtered and normalized curves that approximate the underlying mean-reversion structure between the two assets.
Concept
BTC–ETH relative movements often exhibit asymmetric volatility and temporary divergence.
This dashboard helps visualize:
Spread compression/expansion
Regime transitions
Short-term structural dislocations
Usage
The curves represent different smoothed layers of the BTC/ETH relationship.
Persistent moves away from the central band may indicate spread imbalance or short-term inefficiency.
Purpose
This tool is designed for traders applying statistical arbitrage, relative-value trading, or volatility regime analysis.

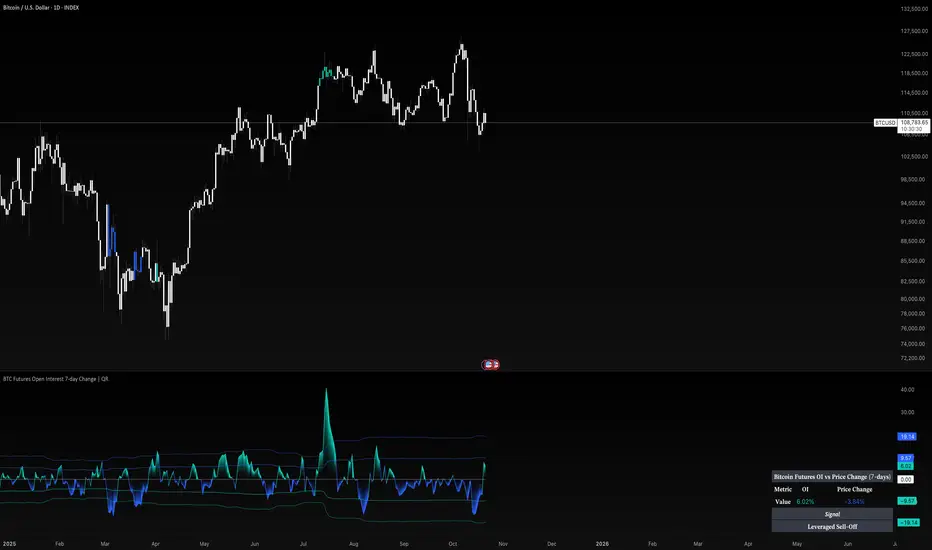
BTC Futures Open Interest 7-day Change | QRBitcoin Futures OI vs Price (7-Day)
What it is
This tool compares the 7-day momentum of Bitcoin perpetual futures Open Interest (OI) with the 7-day price change to classify market behavior into four intuitive regimes:
Leverage Rally (OI↑, Price↑) – positioning builds with rising price
Leveraged Sell-Off (OI↑, Price↓) – forced/short-term positioning into weakness
Deleveraging Sell-Off (OI↓, Price↓) – positions reduce while price falls
Spot Rally (OI↓, Price↑) – spot-led advance with lighter derivatives leverage
It is designed for BTC using the BINANCE:BTCUSD.P OI feed and a clean, self-contained visualization.
How it works (principle, not code)
OI Momentum: Calculates the 7-day Rate of Change (ROC) of BTC perpetual futures Open Interest.
Price Momentum: Calculates the 7-day ROC of the chart’s close.
Regime Logic: The sign of OI ROC and Price ROC determines the 4 regimes shown in the on-chart table label.
Volatility Context: A rolling standard deviation of OI ROC defines ±1σ and ±2σ bands. Bars are tinted when OI ROC exceeds ±2σ to highlight exceptional leverage shifts.
This is not a latency-sensitive microstructure model; it’s a context tool to see how derivatives positioning evolves relative to price.
Why it’s useful (originality & value)
Most OI overlays show a single line. This script adds:
a behavioral classifier (the 4 regimes) that’s immediately interpretable, and
adaptive σ-bands on OI momentum to distinguish routine leverage changes from abnormal expansions/flushes.
Together, they make it easier to read leverage cycles, spot rally quality, and identify riskier states (e.g., price up while OI surges vs. price up while OI fades).
What you see on the chart
Futures Open Interest (stepline) for BTC perpetuals (BINANCE:BTCUSD.P_OI).
OI ROC plot with zero line and ±1σ / ±2σ guides.
Bar tinting when OI ROC > +2σ (aggressive leverage build) or < −2σ (aggressive deleveraging).
Side table showing current OI ROC, Price ROC, and the regime label.
Note: If applied to a non-crypto symbol, OI will be suppressed and the script will warn that no OI data is available. It is intended for BTC.
Inputs & customization
Color mode: Choose among preset palettes to match your chart style.
(Other logic—lookbacks, σ-bands, and regime rules—are fixed to keep the reading consistent across users.)
How to use it
Confirm trends:
Leverage Rally with OI ROC above +1σ supports risk-on continuation.
Spot Rally can be constructive early in cycles, but be aware that OI can catch up quickly.
Caution in stress:
Leveraged Sell-Off often coincides with liquidation spikes and unstable conditions.
Deleveraging Sell-Off typically marks clearing phases; watch for stabilization as OI ROC returns toward 0.
Watch extremes:
±2σ moves in OI ROC are non-routine; combine with price structure, liquidations, and funding to refine decisions.
Use it as contextual confluence alongside your execution plan (levels, risk, and timeframe).
Chart-publishing guidance
Publish with a clean chart so the OI line, ROC bands, and regime label are easy to identify.
Avoid stacking unrelated indicators unless you explain why they are required to interpret the tool.
Limitations
OI feeds can vary by venue; this script uses Binance perpetual OI. Other venues may differ.
Short-term spikes (maintenance, outages, large block flows) can distort OI ROC for a few bars.
The σ-bands adapt to recent variability; regime persistence is more informative than a single spike.
Disclaimer
This script is for research and educational purposes only and is not financial advice. Trading involves risk, including loss of capital. Past performance does not predict or guarantee future results. Always validate on your timeframe and use robust risk management.
BTC Mayer Multiple Glassnode A sophisticated on-chain inspired indicator that measures Bitcoin's fair value using the Mayer Multiple metric, presented in Glassnode's signature visual style. This tool helps traders identify optimal entry and exit zones based on Bitcoin's deviation from its 200-day moving average.
📊 What is Mayer Multiple?
The Mayer Multiple is a ratio of Bitcoin's current price divided by its 200-day moving average. Created by Trace Mayer, this metric has historically been effective at identifying market tops and bottoms. Values below 1.0 suggest undervaluation, while values above 2.4 indicate potential overvaluation.
🎯 Key Features
Glassnode-Inspired Design: Premium dark theme with professional color gradients matching industry-leading analytics platforms
Dynamic Color Zones: Six distinct valuation levels from Extreme Buy to Bubble territory
Real-Time Statistics Panel: Live tracking of current multiple, 1-year high/low, averages, and risk assessment
Multi-View Visualization: Choose between histogram bars, line chart, or both for optimal chart clarity
Actionable Signals: Clear buy/sell/hold recommendations based on current market valuation
📈 Valuation Zones Explained
🟢 Extreme Buy Zone (< 0.8): Historical accumulation opportunity - Bitcoin trading significantly below 200MA
🟡 Undervalued (0.8-1.2): Below fair value - favorable risk/reward for long-term positions
⚪ Fair Value (1.2-1.8): Balanced market conditions - hold existing positions
🟠 Overvalued (1.8-2.4): Above fair value - consider taking partial profits
🔴 Extreme Sell (2.4-3.5): Historical distribution zone - high probability of correction
🟣 Bubble Territory (> 3.5): Extreme overvaluation - historical cycle tops
⚙️ Customization Options
Adjustable MA period (default 200-day for traditional analysis)
Smoothing filter to reduce noise
Toggle histogram, line chart, and reference lines independently
Customizable transparency and histogram width
Movable statistics panel for clean chart layout
💡 How to Use
Accumulation Strategy: Buy when Mayer Multiple drops below 1.0, especially during extreme dips below 0.8
Distribution Strategy: Take profits when multiple exceeds 2.4, particularly above 3.5
Trend Confirmation: Values consistently above 1.0 confirm bull market momentum
Risk Management: Use risk level indicator to adjust position sizing
📊 Statistics Panel Includes
Current Mayer Multiple value with color-coded status
Action signal (Strong Buy → Extreme Sell)
1-year high, low, and average for context
Current BTC price and MA200 reference
Risk level assessment for position management
🔔 Alert System
Built-in alerts for all key threshold crossovers:
Extreme Buy Zone entry (< 0.8)
Undervalued Zone entry (< 1.2)
Overvalued Zone entry (> 2.4)
Extreme Sell Zone entry (> 3.5)
🎓 Best Practices
Use on daily or weekly timeframes for most reliable signals
Combine with other indicators for confluence
Historical data shows multiple below 1.0 offers asymmetric risk/reward
Values above 2.4 preceded most major corrections
Not suitable for intraday trading or scalping
⚠️ Important Notes
This indicator is based on historical patterns and does not guarantee future performance. The Mayer Multiple works best on longer timeframes and should be used as part of a comprehensive trading strategy. Markets can remain overbought or oversold for extended periods.
Compatible with TradingView Pine Script v6 | Works on all Bitcoin pairs | Optimized for BTC/USD and BTC/USDT

BTC Power Law [Financial 6-Pack | @itsToghrul]A clean, research-grade roadmap for Bitcoin’s long-term trajectory. The script fits a power-law curve to INDEX:BTCUSD price vs. days since genesis, adds asymmetric deviation bands to reflect diminishing upside, and can project the path forward while keeping chart clutter under control. A compact stats table shows model fit quality, live deviation, and model prices for a custom future date.
What it does
- Plots a base power-law model of BTC price over time.
- Adds an upper band that decays over time to capture diminishing returns, with multiple decay options.
- Adds a lower band as a fixed multiple to frame downside risk.
- Optionally boosts cycle peaks with Gaussian “bumps” to reflect halving-cycle dynamics.
- Draws dashed forward projections for the base line and bands over a user-defined horizon.
Displays a stats table with:
- Rolling R² of model vs. price (in log space) over a user-defined lookback.
- Current % deviation from the base model.
- Model, upper, and lower prices for a custom date you set.
Key features
- Five upper-band modes: Fixed, Exponential, Power-law, Stretched Exponential (Weibull), and Logistic/Hill. Each mode has intuitive controls for steepness, midpoint, floor, and reference scales.
- Cycle peak enhancer: Optional Gaussian sum with per-cycle decay, width, and period controls, plus an optional cosine modulation.
- Future projection controls: Choose the forward horizon in days and a sampling step to balance precision vs. performance. Projections render as transparent dashed lines to avoid clutter.
- Lightweight rendering: Internal caps on line segments keep drawings responsive without losing structure.
- Custom-date pricing: Build a date/time from parts and read off model, upper, and lower prices in the table.
- Transparent fit metric: Rolling R² in log space offers a quick quality check for the current regime.
Inputs overview
- Future projection: On/off, horizon (days), and sampling step.
- Colors: Base line and band colors with separate transparency for projections.
- Upper deviation: Mode selector plus parameters for decay shape, floor, reference scale, or midpoint/steepness, depending on mode.
- Lower deviation: Single fixed multiple with color.
- Gaussian peaks (optional): Amplitude base, cycle width, period, first-peak center, per-cycle decay, number of cycles, and optional cosine modulation.
- Stats: Rolling R² lookback length.
- Custom date: Year, month, day, hour, minute for quick scenario checks.
How to read it
- Base line: Long-term fair-value trend under a power-law regime.
- Upper band: Probable cycle top envelope that compresses over time. Switching modes changes how quickly headroom fades.
- Lower band: Defensive envelope for stress scenarios.
- Deviation %: Positive values signal overvaluation vs. model; negative values signal undervaluation vs. model.
- Custom date row: Quick “what-if” prices for your chosen timestamp.
Practical tips
- Use log scale on the price chart for visual clarity.
- For conservative tops, select Logistic/Hill or Stretched Exp with a non-trivial floor.
- For aggressive tops, use Power-law upper mode with a moderate exponent, then temper with the Gaussian enhancer.
- Keep the projection step coarse on lower-power machines to maintain snappy charts.
- Treat R² as a diagnostic, not a signal. Markets drift around regime shifts.
Intended use
Research and risk framing for BTC on higher timeframes. Works best on weekly or higher with reliable BTC spot pairs.
Disclaimer
Educational content only. No financial advice. Markets carry risk. Manage exposure and test ideas before acting.

BTC Fair Value via Global Liquidity📈 BTC Fair Value via Global Liquidity
This indicator estimates Bitcoin's fair value based on a regression model using Global Liquidity (GLI) data from major central banks.
🔍 How it works:
Fair Value Line (orange): Calculated using a power-law model: Fair Value = e^b * (GLI)^a, where a and b are user-defined parameters based on historical regression.
Global Liquidity (GLI): Combines liquidity metrics from central banks (Fed, ECB, PBoC, BoJ, etc.), including adjustments for the RRP and TGA.
Deviation Bands (green/red dashed): Optional upper and lower bands showing % deviation from fair value (default ±25%). These help identify overbought/oversold conditions.
Delta Plot (gray dots): Displays the % deviation of BTC’s price from its modeled fair value.
⚙️ How to use:
Tune a and b for better model fitting (e.g., via log-log regression).
Use the deviation bands to identify potential entry/exit zones or periods of market inefficiency.
Ideal for macro-level BTC valuation and long-term strategic analysis.

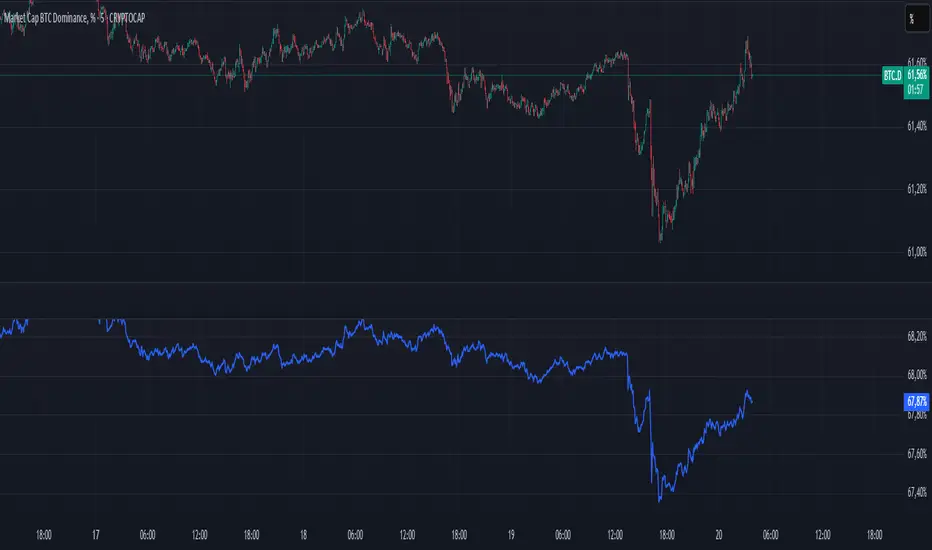
BTC Dominance PercentageThis BTC Dominance Percentage indicator calculates Bitcoin's dominance relative to altcoins, excluding stablecoins.
🔹 Unlike the standard BTC.D metric, which includes all cryptocurrencies (including stablecoins like USDT, USDC, and DAI), this version focuses only on Bitcoin’s market share compared to altcoins.
🔹 It calculates BTC dominance relative to major altcoins (ETH, BNB, ADA, XRP, SOL) and the OTHERS.D index, which represents smaller-cap altcoins.
🔹 Stablecoins are excluded, providing a clearer view of Bitcoin’s actual strength against the altcoin market, without distortion from fiat-pegged assets.
🚀 This is a true BTC dominance metric for tracking Bitcoin’s market position against altcoins!
BTC-SPX Momentum Gauge + EMA SignalHere's an explanation of the market dynamics and signal benefits of this script:
Momentum and Sentiment Indicator:
The script uses the momentum of the S&P 500 to change the chart's background color, providing a quick visual cue of market sentiment. Green indicates potential bullish momentum in the broader market, while red suggests bearish momentum. This can help traders gauge overall market direction at a glance.
Bitcoin Trend Analysis:
By plotting the scaled TEMA of Bitcoin (BTC), traders can see how Bitcoin's trend correlates or diverges from the current asset being analyzed. Since Bitcoin is often viewed as a hedge against traditional financial systems or inflation, its trend can signal broader economic shifts or investor sentiment towards alternative investments.
Dual Trend Confirmation:
The script offers two trend lines: one for Bitcoin and one for the current ticker. When these lines move in tandem, it might indicate a strong market trend across both traditional and crypto markets. Divergence between these lines can highlight potential market anomalies or opportunities for arbitrage or hedging.
Smoothness vs. Reactivity:
The use of TEMA for Bitcoin provides a smoother signal than a simple moving average, reducing lag while still reacting to price changes. This can be particularly useful for identifying longer-term trends in Bitcoin's volatile market. The 20-period EMA for the current ticker, on the other hand, gives a quicker response to price changes in the asset you're directly trading.
Cross-Asset Correlation:
By overlaying Bitcoin's trend on another asset's chart, traders can analyze how these markets might influence each other. For instance, if Bitcoin is in an uptrend while a traditional asset is declining, it might suggest capital rotation into cryptocurrencies.
Trading Signals:
Crossovers or divergences between the TEMA of Bitcoin and the EMA of the current ticker could be used as signals for entry or exit points. For example, if the BTC TEMA crosses above the current ticker's EMA, it might suggest a shift towards crypto assets.
Risk Management:
The visual cues from the background color and moving averages can aid in risk management. For example, trading in the direction of the momentum indicated by the background color might be seen as going with the market flow, potentially reducing risk.
Macro-Economic Insights:
The relationship between Bitcoin and traditional markets can offer insights into macroeconomic conditions, particularly related to inflation, monetary policy, and investor sentiment towards fiat currencies.
Headwind and tailwind:
Currently BTC correlated trade instruments experience headwind or tailwind from the broader market. This indicator lets the user see it to help their trade decision process.
Additional Statement:
As the market realizes the dangers of the fiat that its construct is built upon and evolves and migrates into stable money, incorruptible by inflation, this indicator will reveal the external influence of that corruptible and the internal influence of the incorruptible; having diminishing returns as the rise of stable money overtakes the treasuries of the fiat construct.

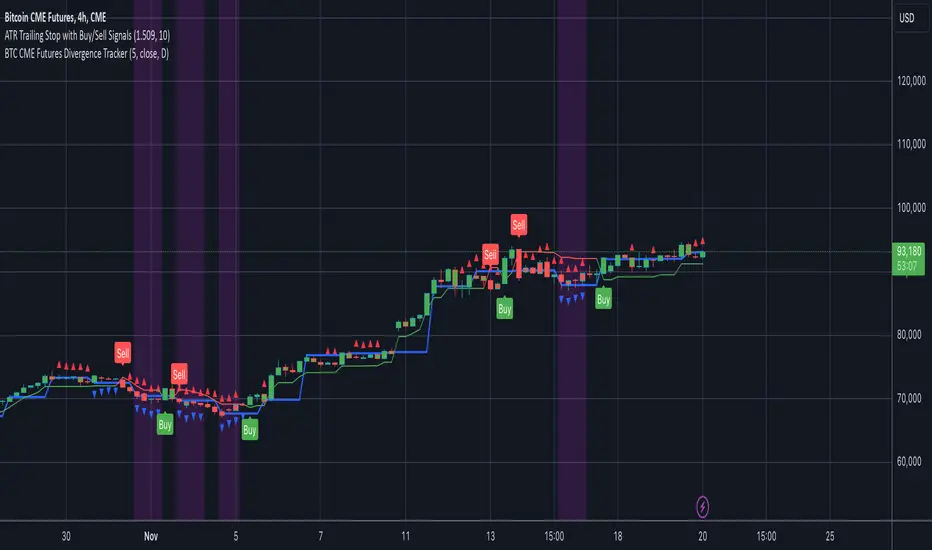
BTC CME Futures Divergence TrackerThis script tracks divergences between price action and open interest for the BTC CME Futures contract (symbol "BTC1!") using the following components:
Key Features:
1. Price Analysis: Identifies lower highs in the price over a specified lookback period. Marks these points with red upward-facing triangles above the bars.
2. Open Interest Analysis: Retrieves open interest (OI) data for the BTC CME Futures contract via request.security. Detects lower highs in open interest over the same lookback period. Highlights these points with blue downward-facing triangles below the bars.
3. Divergence Detection: A divergence is identified when both price and open interest form lower highs simultaneously. Highlights such occurrences with a purple background, indicating potential bearish sentiment or weakening momentum.
4. Alerts: If divergences are detected, an alert is triggered (if enabled), notifying the trader to take action.
5. Visualization: Open interest is plotted as a blue line in a separate pane for added context. Red and blue markers highlight significant points in price and open interest trends.
Use Cases:
- Spot Weakening Trends: Divergences between price and open interest may indicate a loss of momentum or bearish sentiment, allowing traders to preemptively adjust their strategies.
- Monitor Institutional Activity: Open interest changes reflect shifts in market participation, especially in derivative markets like CME Futures.
- Set Alerts for Key Signals: With automated alerts, traders can stay informed of potential divergence signals without constant monitoring.
Customization Options:
- Lookback Period: Adjust the number of bars used to detect lower highs.
- Timeframe: Choose the timeframe for fetching open interest data (e.g., daily, hourly).
- Alert Activation: Enable or disable alerts for divergences.
This tool combines price action with open interest dynamics to provide a robust method for identifying market trends and potential reversals in BTC CME Futures.
BTC Log High/Low ChartThis indicator calculates the logarithmic values of the high and low prices of BTC based on a mathematical formula and plots them on the chart. The code uses the current time and width of the chart to calculate the logarithmic values of the high and low prices. It defines functions to convert a timestamp to the number of days since January 1st, 2009.
You can use it with BTC Log High/Low:

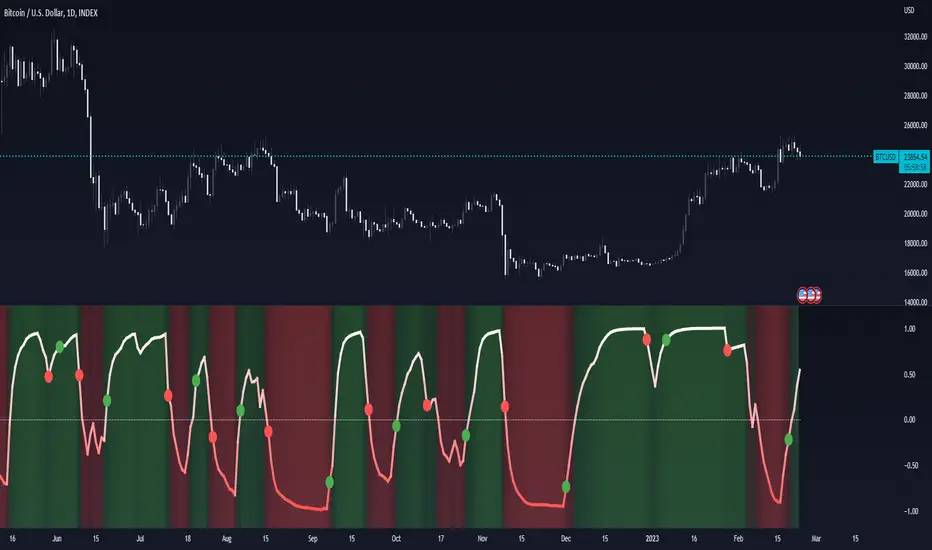
BTC Longs/Shorts ratio by [VanHelsing]BTC Longs/Shorts ratio
It is a sentiment indicator. It uses data from Bitfinex longs chart and shorts chart.
When ratio line going up it simply means most of the people from Bitfinex buying BTC when it goes down selling.
So in this way we know bull and bear presure
But it is only one exchange? Yes, but it is enough accurate for BTC, for ETH it is not so good.
How it works:
With request security function was called the closes of longs and shorts charts
and then with simple calculation was extracted a ratio of it and rescaled to make it easy to read.
When ratio line moves up it gradualy changing background from -1 to 1 from red to green and vice versa to understad what is a trend or a majore sentiment of people
After ratio was ploted, I created a smoothed ratio line with sma to extract signals from it buy and sell in a form of green and red circles.
How to read it:
BTC Weighted Agg. Basis [Overlay] [Moto]Hello traders,
This script shows the exchange volume-weighted aggregate basis for Bitcoin. This is the accompanying overlay version of the script which shows plotshapes according to the specified levels of aggregate contango or backwardation.
Exchanges have differing significance to the traded price of BTC and so this script calculates the respective volume and price of the major exchanges to more accurately represent the difference between the markets spot price and the markets perpetual future/swap price.
Spot references:
Coinbase
Bitfinex
Binance
Bitstamp
FTX
OKex
Huobi
Bybit
Perp references:
Bitfinex
Binance
FTX
OKex
Huobi
Bybit
Deribit
There are options in the settings to use either basis point scaling or %, though the color bracketing is set to basis points by default.
Users can change the candle close resolution to see a larger/smaller time frame data set.
An important feature is the ability to filter the barcolor on the chart to filter only for basis increase or decrease depending on the influence of spot buying or selling.
As of publishing, the barcoloring is set to only display when you're on a common BTC spot or BTC perp chart. This is to avoid confusion.
Thanks

BTC Long-term TrendThis indicator works best for long trends on the 4h timeframe and will tell you when the trend has reversed. Best used to find your buy in points if you are wanting to accumulate BTC over long timeframes. This indicator also works well at picking the switch in direction on the 15m timeframe however this is much more risky and I would only recommend for experienced traders. If you are looking for something to give you long term entries on BTC then this will be able to help you. It is not always accurate and I would recommend using it to tell you when to buy if you are considering holding your BTC long term.
"Long"is a buy signal and "short" is a sell signal.

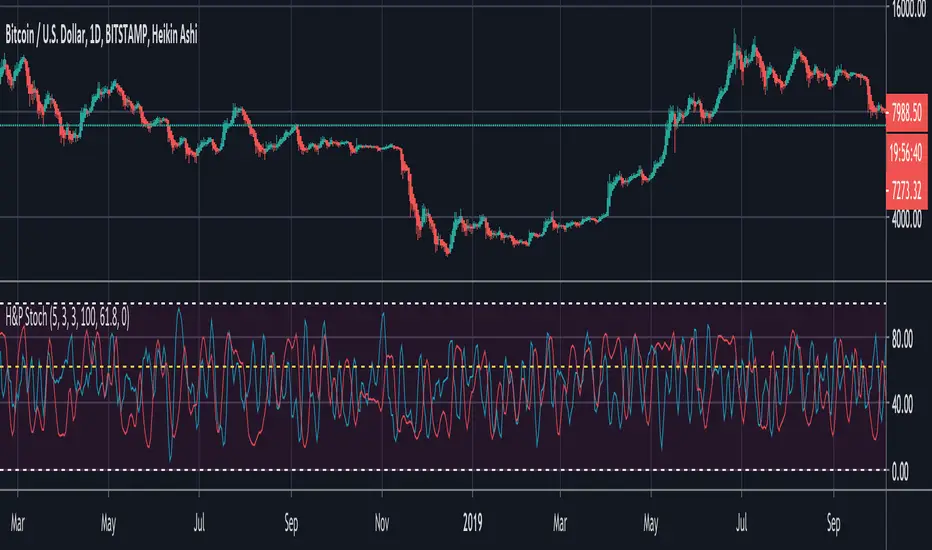
BTC Hash Rate & Price Stochastic IndiciatorFresh off the press, we have a new breed of indicators: Bitcoin's Hash Rate & Price.
As many of you have read, roughly 80% of BTC's price movements can be correlated to its changes in hash rate volume. I decided to make a stochastic indicator that utilizes this principle to track divergence of the price from the hash rate.
Let's break this down...
In red is the CLOSE of BTC's Price, which is then smoothed by a SMA, and smoothed again by a WMA.
In aqua is a STOCH of BTC's Hash Rate, which is then smoothed by a SMA, and smoothed again by a WMA.
The reason why I chose to use the CLOSE of the Price versus a STOCH as I did with the Hash Rate, is because the price tends to signal trends via divergence from the Hash Rate, and eventually converge with the Hash Rate at some point.
You will notice that anytime there is a significant divergence of the RED from the AQUA, a trend is closely aligned with it. This indicator does a remarkable job of indicating the beginnings and ends of both bullish and bearish price movements.
Example Strategy:
Enter long when RED (price) crosses over AQUA (hash rate), and close long when RED crosses under AQUA.
The inverse can be done for shorts, just RED diverges downwards from AQUA versus upwards.
Note:
Unlike a normal Stochastic Indicator, the upper and lower bounds do not appear to hold any significance. In other words, the lines do not seem to reverse at 20/80. As a result, I just set them to 0/100 for aesthetics.
DO NOT make trades based off of small divergences, or simply enter into positions based off the price divergences. Though this indicator times the start/end of movements very accurately, it also comes riddled with false breakouts .
Proceed at your own pace, and please, toy around with the inputs values. I experimented with a few combinations, but I'm sure there are better value combinations that yield sharper results with fewer false signals.
EASTER EGG:
Notice the "Golden Line"? Any avid user of TV knows that Fibonacci ratios show up everywhere in markets. With that said, I plotted a horizontal line at 0.618, which is 1/Phi, an important level in Fibonacci retracements.
Final Comments:
First, this is not investment, merely my experimentation and observation of happenings in the analytical world.
Second, please comment questions, improvements, etc. Dialogue opens up room for exploration!
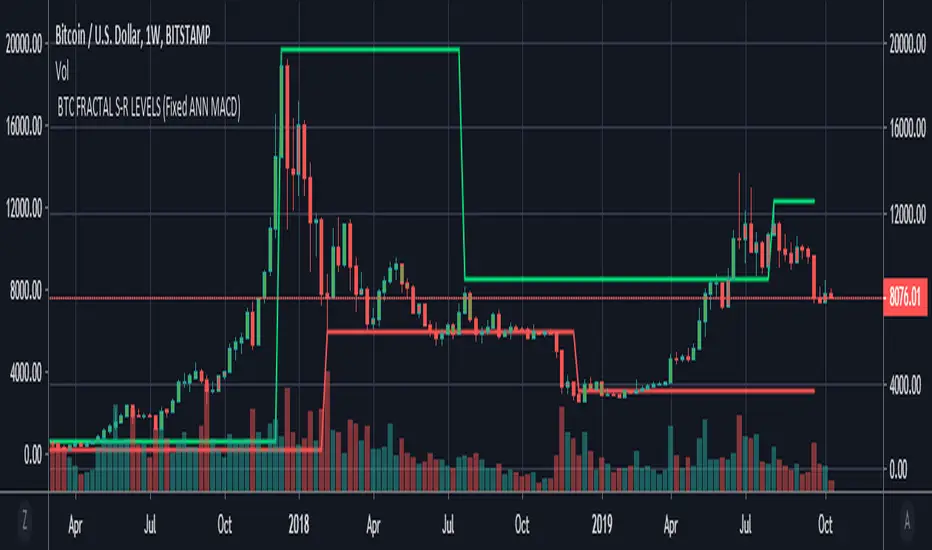
BTC FRACTAL ANN S-R LEVELS (Fixed ANN MACD)
This script is an adaptation of my deep learning system for Bitcoin to fractals.
Fractal codes are not belong to me. Original :
The code for the Deep learning (ANN MACD BTC) work belongs to me. Original:
I didn't get license for this script because the fractal codes don't belong to me.You can use it for any purpose.
This command can be a very helpful guide.You can use that fractals with your indicators for Bitcoin.
You can also combine these levels with ANN - MACD - BTC script.
Scripts about Artificial Neural Networks (ANN) will continue soon !
I hope it will help us to gain insight into technical analysis.
Best regards. Noldo.
BTC Real PriceThis creates an INDICATOR showing REAL BTC price across 9 exchanges.
the composite price is equal weighted (and continuously updates, so its always correctly weighted) and shows the "BTC Real Price"
the default setting is to "M" for monthly ofc, so change it as needed under settings.
Since this is an INDICATOR, you would apply it to your own btc chart (whether you are watching binance, bitmex, etc) and you can see any price discrepancies between the 2.
you can also merge it onto the main chart as well

BTC Futures vs. BTC Spot By @Cipher_ScienceThis indicator has 3 options in the "Format" settings area for each of the three major futures contracts. It is built this way because Tradingview does not allow you to build multiple indicators into one script. The best way to use this tool is to apply this indicator three times, check the box for each exchange/market, add labels, and then save it as one of your chart layouts.
If you want a more compact indicator check out my combined version here:
Please let me know if you have any issues, feature recommendations, or other script ideas.
-CS

BTC Macro Regime & Stoch RSI SignalThis script is designed for traders who want to combine macro context with precise momentum timing on Bitcoin.
Instead of looking at isolated indicators, it aggregates several independent data streams into a single bias score and then uses a stochastic RSI engine to time entries and exits.
The goal is simple:
Filter the market into long / neutral / short regimes,
Only act when momentum aligns with the current regime,
Avoid overtrading in noisy or highly leveraged conditions.
What the indicator does (conceptually)
The script builds an internal “macro + momentum score” for BTC by combining:
Cycle / valuation regime
Tracks where BTC sits in the broader cycle (discount vs overheating) and whether conditions are favorable for medium-term upside or downside.
Network & miner trend regime
Monitors the health and trend of network activity / miners to detect stress, capitulation and recovery phases.
Derivatives / leverage regime
Looks at futures positioning to identify when leverage is excessive or has been flushed out, acting as a risk filter rather than a standalone entry trigger.
Price momentum (Stochastic RSI)
Uses a Stochastic RSI engine on price to capture short-term swings and turning points, especially at extremes.
All of this is compressed into a single score between −1 and +1, where:
Values near +1 indicate a supportive macro environment with bullish momentum,
Values near −1 indicate a risk-off / bearish environment,
Values around 0 indicate indecision or transition.
The exact construction, weights and thresholds are handled internally by the script.
Signals & visuals
The indicator provides:
A Total Score line:
Above a configurable upper level → long bias
Below a configurable lower level → short bias
In between → neutral / low conviction
Background shading:
Green tint when the regime favors long setups
Red tint when the regime favors short setups
Stochastic RSI panel:
K and D lines plotted on a 0–100 scale
The 0–10 zone is highlighted in green (deep oversold)
The 90–100 zone is highlighted in red (deep overbought)
Extreme cross markers:
A green marker when Stoch RSI crosses up in the lower extreme zone
A red marker when Stoch RSI crosses down in the upper extreme zone
Entry / exit markers (optional visual guide):
Long entry markers appear when:
The macro score is in long-bias territory, and
Stoch RSI confirms an upward cross from oversold conditions.
Short entry markers appear when:
The macro score is in short-bias territory, and
Stoch RSI confirms a downward cross from overbought conditions.
Exit markers appear when momentum flips against the active bias or the macro score degrades.
These markers are guides, not mechanical trading rules.
How to use it
Typical workflow:
Start with the Total Score
Use it as a regime filter:
Only look for longs when the score shows a sustained positive bias.
Only look for shorts when the score shows a sustained negative bias.
Then look at Stoch RSI
Use it to time pullbacks and reversals within the current bias:
In a long bias → favor bullish crosses from low levels.
In a short bias → favor bearish crosses from high levels.
Respect leverage conditions
When the internal risk engine flags crowded leverage, treat signals more conservatively:
Reduce size,
Tighten risk,
Or skip trades entirely if conditions look unstable.
This script is not meant to create a high-frequency scalping system. It is a context + timing framework for swing and positional trades on BTC.
Timeframes
The macro components are designed with higher-timeframe logic in mind.
Recommended:
Use 1D as the primary perspective for the bias,
Optionally refine entries on 4H if you want more precise timing.
Important notes & disclaimer
This tool is specifically tuned for Bitcoin, not for altcoins.
The internal logic, data processing and weighting are intentionally abstracted to keep the focus on the final score and signals rather than on raw formulas.
As with any indicator, it can produce false signals and whipsaws, especially during violent news events or regime shifts.
This is not financial advice. Always combine the script with your own analysis, sound risk management and position sizing. Use at your own risk.

BTC Impulse Pro
BTC Impulse Pro — Precision Breakout Tool for Bitcoin (5m–15m)
BTC Impulse Pro is a structured breakout companion designed to help traders identify directional shifts and continuation opportunities on intraday Bitcoin charts.
The indicator focuses on clean visual signals, consistent rules, and intuitive workflow integration — without revealing proprietary logic.
Included Setups
1. Standard Breakout Signal
A large directional triangle.
This setup triggers when price shows a clean breakout and confirmation pattern.
It is the primary trading signal of the tool and reflects moments of strong directional intent.
2. Wick Breakout Signal
A smaller directional triangle.
This setup appears when price interacts with a key level through a wick rejection before breaking out.
It can highlight momentum shifts early, but requires additional caution in choppy market phases.
3. Confluence Dot
A small directional dot.
This appears when internal structure conditions align with the prevailing directional bias.
The Confluence Dot can:
act as secondary confirmation for the two breakout signals
or be used as its own standalone signal
However, because it may appear during early or developing moves, users should evaluate market context carefully before acting on it.
EMA Stack & Trend Context
The indicator includes an optional EMA stack that helps visualize directional strength and transitions.
While not required for signals, the EMA 200 often acts as a dynamic boundary — when price trades very close to it, users should treat all signals with increased caution due to higher whipsaw risk.
Dynamic Stop & TP Guides
Suggested Stop and Take-Profit levels are automatically displayed when structure confirms.
These levels are meant as orientation tools, not strict requirements.
Different volatility conditions may require different management techniques, so users are encouraged to test what works best for their style.
NY Reference Line (00:00 NY Time)
The vertical reference line can be shifted via the NY Offset setting.
It should be aligned with 00:00 New York time for consistent daily segmentation across different time zones and chart feeds.
Recommended Timeframes
Optimized for 5m and 15m, but can also be tested on other timeframes depending on market structure and volatility.
Usage Notes
This indicator is not financial advice.
All signals should be interpreted within broader market context.
The tool does not execute trades — it assists with visual decision-making.

BTC - FRIC: Friction & Realized Intensity CompositeTitle: BTC - FRIC: Friction & Realized Intensity Composite
Data: IntoTheBlock
Overview & Philosophy
FRIC (Friction & Realized Intensity Composite) is a specialized on-chain oscillator designed to visualize the "psychological battlegrounds" of the Bitcoin network.
Most indicators focus on Price or Momentum. FRIC focuses on Cost Basis. It operates on the thesis that the market experiences maximum "Friction" when the price revisits the cost basis of a large number of holders. These are the zones where investors are emotionally triggered to react—either to exit "at breakeven" after a loss (creating resistance) or to defend their entry (creating support).
This indicator answers two questions simultaneously:
Intensity: Is the market hitting a Wall (High Friction) or a Vacuum (Low Friction)?
Valuation: Is this happening at a market bottom or a top?
The "Alpha" (Wall vs. Vacuum)
Why we visualize both extremes: This indicator filters out the "Noise" (the middle range) to show you only the statistically significant anomalies.
1. The "Wall" (Positive Z-Score Bars)
What it is : A statistically high number of addresses are at breakeven.
The Implication : Expect a grind. Price action often slows down or reverses here because "Bag Holders" are selling into strength to get out flat, or new buyers are establishing a floor.
2. The "Vacuum" (Negative Z-Score Bars)
What it is : A statistically low number of addresses are at breakeven.
The Implication : Expect acceleration. The price is moving through a zone where very few people have a cost basis. With no natural "breakeven supply" to block the path, price often enters Price Discovery or Free Fall.
Methodology
The indicator constructs a composite view using two premium metrics from IntoTheBlock:
1. The "Activity" (Friction Z-Score): We utilize the Breakeven Addresses Percentage. This measures the % of all addresses where the current price equals the average cost basis.
- Normalization: We apply a rolling Z-Score (Standard Deviation) to this data.
- The Filter: We hide the "Noise" (e.g., Z-Scores between -2.0 and +2.0) to isolate only the events where market structure is truly stretched.
2. The "Context" (Valuation Heatmap): We utilize the MVRV Ratio to color-code the friction.
Deep Value (< 1.0): Price is below the average "Fair Value" of the network.
Overheated (> 3.0): Price is significantly extended above the "Fair Value."
Credit: The MVRV Ratio was originally conceptualized by Murad Mahmudov and David Puell. It remains one of the gold standards for detecting Bitcoin's fair value deviations.
How to Read the Indicator
The chart is visualized as a Noise-Filtered Heatmap.
1. The Bars (Intensity)
Bars Above Zero: High Friction (Congestion). The market is fighting through a supply wall.
Bars Below Zero: Low Friction (Vacuum). The market is accelerating through thin air.
Gray/Ghosted: Noise. Routine market activity; no significant signal.
2. The Colors (Valuation Context) The color tells you why the friction is happening:
🟦 Deep Blue (The "Capitulation Buy"):
Signal: High Friction + Low MVRV.
Meaning : Investors are panic-selling at breakeven/loss, but the asset is fundamentally undervalued. Historically, these are high-conviction cycle bottoms.
🟥 Dark Red (The "FOMO Sell"):
Signal: High Friction + High MVRV.
Meaning : Investors are churning at high valuations. Smart money is often distributing to late retail arrivers. Historically marks cycle tops.
🟨 Yellow/Orange (The "Trend Battle"):
Signal: High Friction + Neutral MVRV.
Meaning : The market is contesting a level within a trend (e.g., a mid-cycle correction).
Visual Guide & Features
10-Zone Heatmap: A granular color gradient that shifts from Dark Blue (Deep Value) → Sky Blue → Grey (Neutral) → Orange → Dark Red (Top).
Noise Filter
A unique feature that "ghosts out" insignificant data, leaving only the statistically relevant signals visible.
Data Check Monitor
A diagnostic table in the bottom-right corner that confirms the live connection to IntoTheBlock data streams and displays the current regime in real-time.
Settings
Lookback Period (Default: 90): The rolling window used for the Z-Score calculation. Shortening this (e.g., to 30) makes the indicator more sensitive to local volatility; lengthening it (e.g., to 365) aligns it with macro cycles.
Noise Threshold (Default: 2.0): The strictness of the filter. Only friction events exceeding this Z-Score will be highlighted in full color.
Show Status Table : Toggles the on-screen dashboard.
Disclaimer
This script is for research and educational purposes only. It relies on third-party on-chain data which may be subject to latency or revision. Past performance of on-chain metrics does not guarantee future price action.
Tags
bitcoin, btc, on-chain, mvrv, intotheblock, friction, z-score, fundamental, valuation, cycle
