BO - Bar M15 2/3 SignalBO - Bar M15 2/3 Signal show the signal to trade Binary Option with rule below:
A. Indicator
* Bollinger Band (20,2): avoid waterfall
B. Rule of Signal
1. Rule1: Split Bar M15 to 3 part and load them on M5 chart (recommend use M5 IDC chart)
2. Rule 2: Delay 10' after bar M15 open => wait for price's pattern
3. Rule 3: Put Signal row 30-32
* Delay 10' after bar M15 open.
* Direction of 1/3 and 2/3 Bar M15 is upward
* close of 2/3 Bar M15 below upper band Bb(20,2) on M5 chart => avoid strong buy
4. Rule 4: Call Signal row 36-38
* Delay 10' after bar M15 open.
* Direction of 1/3 and 2/3 Bar M15 is downward
* close of 2/3 Bar M15 above lower band Bb(20,2) on M5 chart => avoid strong sell
C. Recommend Expiry time: Bar M15 close
* We try to catch the shadow of Bar M15 but dont trade when price run on the upper or lower band of BB(20,2,M5)
Wyszukaj w skryptach "20日线角度大于0的股票"

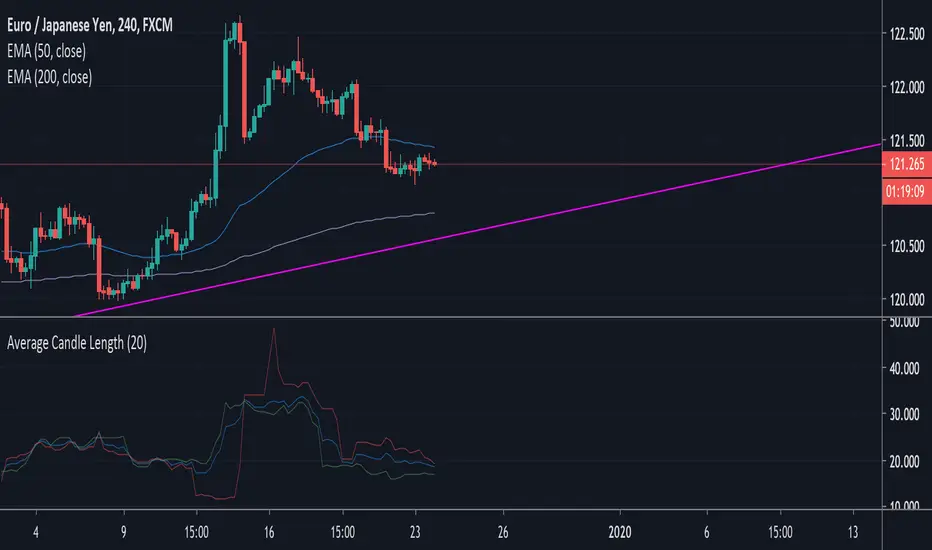
Average Candle Length 2.0This script will tell you the following:
• Average length of all the candles (wick to wick) for the last 20 candles
-- shown in blue
• Average length of bull (green) candles (wick to wick) for the last 20 candles
-- shown in green
• Average length of bear (red) candles (wick to wick) for the last 20 candles
-- shown in red
___________________________________________
Inputs:
• # of Candles to analyze (default = 20)
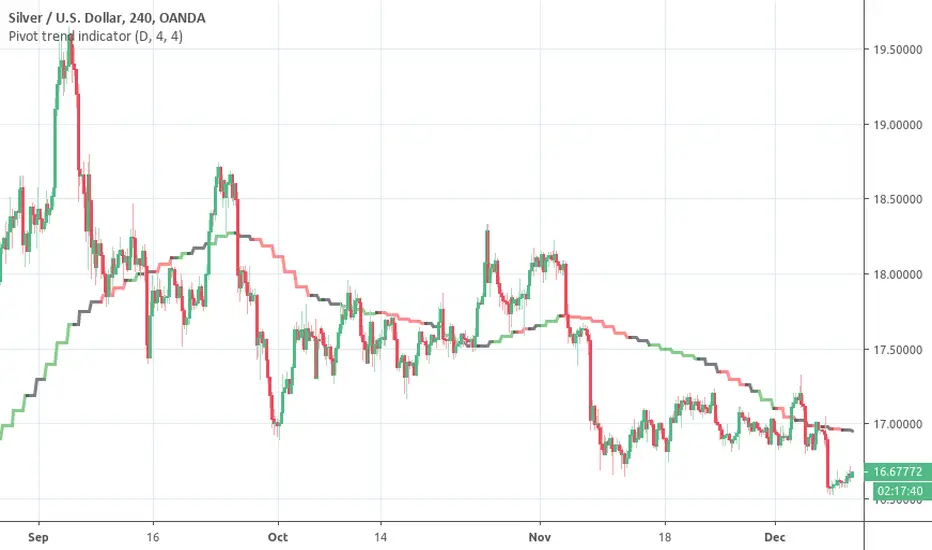
Pivot trend indicatorThis is a LAGGING indicator which can provide a good indication of trend. It require a certain (configurable) number of candles to have closed before it can determine whether a pivot has formed.
It provides a 20 period SMA for the timeframe of your choice which is color coded to show the trend according to confirmed pivots.
Anticipated usage:
Long / Short bias is determined by pivot trend
Trader seeks entries according to their strategy
Black consolidation areas may trigger a re-evaluation of the trade and can serve as good profit taking areas
The SMA colors:
Green -> Higher highs & Higher lows
Red -> Lower highs & Lowers lows
Black -> No clear trend from the pivots
Why the 20 SMA?
Feel free to adjust it for your purposes. I personally find that using a higher time frame 20 SMA is a better indication of trend than longer period MAs on shorter time frames. This can be seen from comparing the 20 daily SMA and 200 hourly SMA.
Pivot adjustment
The pivots use the selected time frame (not) the MA trend time frame. You can specify the left and right candles required to confirm a pivot
VIX reversion-Buschi
English:
A significant intraday reversion (commonly used: 3 points) on a high (over 20 points) S&P 500 Volatility Index (VIX) can be a sign of a market bottom, because there is the assumption that some of the "big guys" liquidated their options / insurances because the worst is over.
This indicator shows these reversions (3 points as default) when the VIX was over 20 points. The character "R" is then shown directly over the daily column, the VIX need not to be loaded explicitly.
Deutsch:
Eine deutliche Intraday-Umkehr (3 Punkte im Normalfall) bei einem hohen (über 20 Punkte) S&P 500 Volatility Index (VIX) kann ein Zeichen für eine Bodenbildung im Markt sein, weil möglicherweise einige "große Jungs" ihre Optionen / Versicherungen auflösen, weil das schlimmste vorbei ist.
Dieser Indikator zeigt diese Umkehr (Standardwert: 3 Punkte), wenn der VIX vorher über 20 Punkte lag. Der Buchstabe "R" wird dabei direkt über dem Tagesbalken angezeigt, wobei der VIX nicht explizit geladen werden muss.

Triple Moving Average HeatmapHi everyone
I didn't publish on Friday because I was working on an Expert Advisor in MT4. The day I don't publish, some scripts spamming guys published many (not useful) scripts the same to kick me out of the TOP #1 ranking.
So what I'm going to do about it? crying or sharing more quality scripts than before? :)
I guess you know the answer :) I'm gonna share a few quality scripts that I have in my library. I noticed that you guys tend to like more the scripts useful for your trading actually making you money rather than a copy-paste (of another copy-paste)
Alright, enough for the trolling now let's introduce the Three MA heatmap which is an upgrade of that script : MA-heatmap-Double-cross-edition/
The challenge was to keep the heatmap not rolling and to make it match with the MA cross. I did it using this
```
since_ma_buy = barssince(macrossover)
since_ma_sell = barssince(macrossunder)
heatmap_color() =>
since_ma_buy < since_ma_sell ? color.new(color.green, 20) : since_ma_buy > since_ma_sell ? color.new(color.red, 20) : na
```
This is a technique that I found after drinking three glasses of red wine (#french) to keep the heatmap stable and not rolling.
To get what I'm saying I invite you to replace the piece of code above by what everyone would normally do
```
heatmap_color() =>
macrossunder() ? color.new(color.green, 20) : macrossover() ? color.new(color.red, 20) : na
```
Ah and I'm not done sharing for the day, a few scripts are coming also after that one and tonight !!!!! I want to live in a world where you guys can enjoy quality scripts (mostly) :)
PS
____________________________________________________________
Feel free to hit the thumbs up as it shows me that I'm not doing this for nothing and will motivate to deliver more quality content in the future.
- I'm an officially approved PineEditor/LUA/MT4 approved mentor on codementor. You can request a coaching with me if you want and I'll teach you how to build kick-ass indicators and strategies
Jump on a 1 to 1 coaching with me
- You can also hire for a custom dev of your indicator/strategy/bot/chrome extension/python

Palex 2.0Atualização do SETUP do saudoso Professor Alexandre Fernandes "Palex"
- Bandas de Bolliger (Standard) =
*Banda Superior = Média Móvel Simples (20 dias) + (2 x Desvio Padrão de 20 dias)
*Banda Inferior = Média Móvel Simples (20 dias) – (2 x Desvio Padrão de 20 dias)
- EMA 9 (Média Móvel Exponencial)
- SMA 21 (Média Móvel Simples)
- SMA 200 (Média Móvel Simples) Clássica MA 200 períodos
- SMA 400 (Média Móvel Simples)
- EMA 400 (Média Móvel Exponencial)
- WILD (Média Móvel Welles Wilder)
O mesmo usado pelo nosso grande Mestre PALEX!
The 6 Line Death PunchIf you are looking to discover what trend you are in, you need to first what direction the price is going in...
I've been using and testing a mixture of EMA's and SMA's for a long time and I've found that these ones are by far the best.
EMA 3
EMA 8
MA 20
EMA 55
MA 100
MA 200
EMA 3 & 8 Crossover is a good method for confirming a coin going to the upside or to the downside.
EMA 8 is known as the Trigger Line (trademarked brand) as one of the fib numbers it shows good support or resistance of a trend.
MA 20 universal way of seeing trend direction in the stock market, works well with crypto too.
EMA 55, another trusty fib number. Works very well and could trade off that alone as support and resistance.
MA 100 and MA 200. Long ranged moving averages which govern the overall longer-term trend.
LONG ENTRY
Option 1 - 3/8 crossover
Option 2 - Candles above EMA 8
Option 3 - Candles above MA 20
Option 4 - Candles Above EMA 55.
SHORT ENTRY
Option 1 - 3/8 crossover
Option 2 - Candles below EMA 8
Option 3 - Candles below MA 20
Option 4 - Candles below EMA 55.

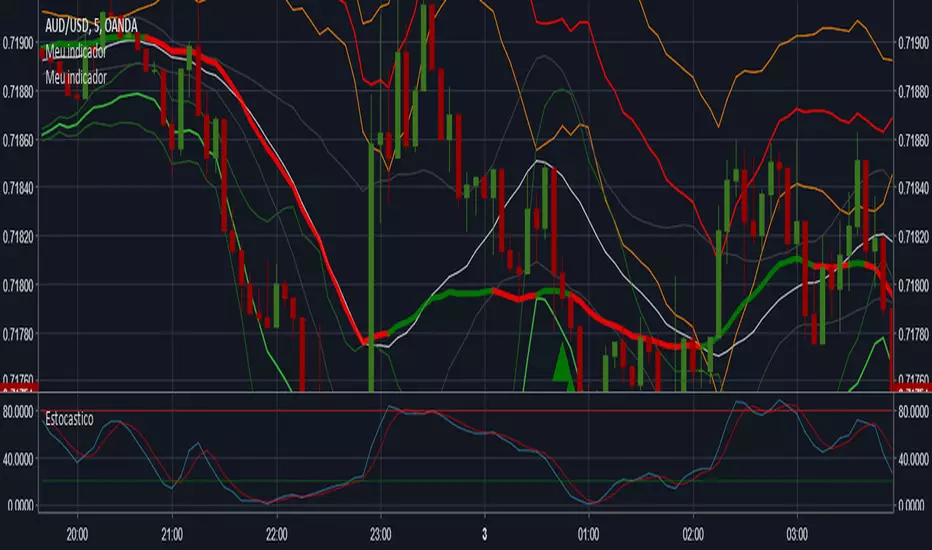
Signals for call and putSorry for the Google Translate English
Indicator for signals of call and put, using Bollinger bands (period 20, standard deviation 2.5), market trend of (sma, períod 100) and stochastic (period 20, %D 3).
I was overthrown but in pine scrip, the function "stoch()" no way to smooth (3). If anyone knows how to smooth inside the script, help me! Please.
With smoothed stochastic the hit rate grows a lot.
Português (Pt-Br)
Indicador de sinais de compra e venda, usando bandas de Bollinger (período de 20, desvio de 2,5), tendencia de mercado com (sma período 100) e estocástico (período 20, %D de 3).
Eu travei porque no pine script, a função "stoch()" não tem como aplicar a suavização (3). Se alguem souber como suavizar dentro do script, me ajude! Por favor.
MG - Multiple Moving Averages & Candle Wick Alerts - 1.0Features:
- Each moving average has customizable length, type and source
- The ability to change the source of all moving averages with one input (changing an individual MA source will override the general for that MA)
- At a glance comparison of 20 SMA and 20 VWMA to gauge volume trend
- Wick alerts which can be toggled for each moving average.
- Bullish wick alerts are when the wick is the only part of the candle to drop below the moving average
- Bearish wick alerts are when the wick is the only part of the candle to reach above the moving average
- Simple candle closed alert if you want a notification, for example each hour.
Defaults: Four SMAs (20, 50, 100, 200) and a 20 VWMA .
Recommended Usage:
- Set the general source (sets the source of all moving averages) to 'low' when in an uptrend and 'high' in a downtrend to maximize Risk : Reward.
- Use Fibonacci levels, oscillators .etc for confluence
NOTE: The moving average component of this indicator is the same as the previous indicator ()
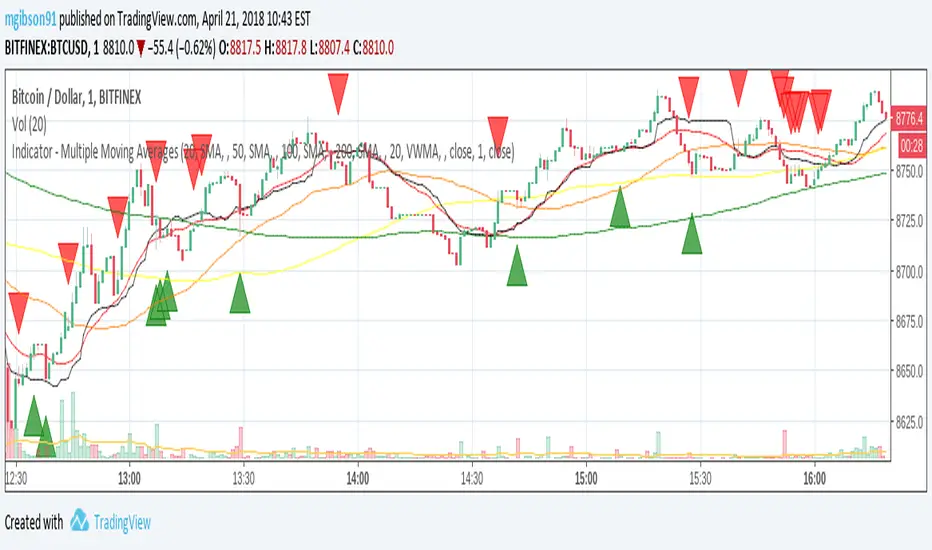
Indicator - Multiple Moving Averages 1.0Features:
- Each moving average has customizable length, type and source
- The ability to change the source of all moving averages with one input (changing an individual MA source will override the general for that MA)
- At a glance comparison of 20 SMA and 20 VWMA to gauge volume trend
Defaults: Four SMAs (20, 50, 100, 200) and a 20 VWMA.
Usage:
- Use Fibonacci levels, pivots .etc for confluence
- Personally, I like to set overall source to low in uptrends, to high in downtrends and then set alerts for when the price crosses any of the averages. Then pay particular attention to the candlesticks and other indicators.
TODO:
- Add alerts option so that it send alert on crossing up or down any alert lines.

XPloRR MA-Trailing-Stop StrategyXPloRR MA-Trailing-Stop Strategy
Long term MA-Trailing-Stop strategy with Adjustable Signal Strength to beat Buy&Hold strategy
None of the strategies that I tested can beat the long term Buy&Hold strategy. That's the reason why I wrote this strategy.
Purpose: beat Buy&Hold strategy with around 10 trades. 100% capitalize sold trade into new trade.
My buy strategy is triggered by the fast buy EMA (blue) crossing over the slow buy SMA curve (orange) and the fast buy EMA has a certain up strength.
My sell strategy is triggered by either one of these conditions:
the EMA(6) of the close value is crossing under the trailing stop value (green) or
the fast sell EMA (navy) is crossing under the slow sell SMA curve (red) and the fast sell EMA has a certain down strength.
The trailing stop value (green) is set to a multiple of the ATR(15) value.
ATR(15) is the SMA(15) value of the difference between the high and low values.
The scripts shows a lot of graphical information:
The close value is shown in light-green. When the close value is lower then the buy value, the close value is shown in light-red. This way it is possible to evaluate the virtual losses during the trade.
the trailing stop value is shown in dark-green. When the sell value is lower then the buy value, the last color of the trade will be red (best viewed when zoomed)(in the example, there are 2 trades that end in gain and 2 in loss (red line at end))
the EMA and SMA values for both buy and sell signals are shown as a line
the buy and sell(close) signals are labeled in blue
How to use this strategy?
Every stock has it's own "DNA", so first thing to do is tune the right parameters to get the best strategy values voor EMA , SMA, Strength for both buy and sell and the Trailing Stop (#ATR).
Look in the strategy tester overview to optimize the values Percent Profitable and Net Profit (using the strategy settings icon, you can increase/decrease the parameters)
Then keep using these parameters for future buy/sell signals only for that particular stock.
Do the same for other stocks.
Important : optimizing these parameters is no guarantee for future winning trades!
Here are the parameters:
Fast EMA Buy: buy trigger when Fast EMA Buy crosses over the Slow SMA Buy value (use values between 10-20)
Slow SMA Buy: buy trigger when Fast EMA Buy crosses over the Slow SMA Buy value (use values between 30-100)
Minimum Buy Strength: minimum upward trend value of the Fast SMA Buy value (directional coefficient)(use values between 0-120)
Fast EMA Sell: sell trigger when Fast EMA Sell crosses under the Slow SMA Sell value (use values between 10-20)
Slow SMA Sell: sell trigger when Fast EMA Sell crosses under the Slow SMA Sell value (use values between 30-100)
Minimum Sell Strength: minimum downward trend value of the Fast SMA Sell value (directional coefficient)(use values between 0-120)
Trailing Stop (#ATR): the trailing stop value as a multiple of the ATR(15) value (use values between 2-20)
Example parameters for different stocks (Start capital: 1000, Order=100% of equity, Period 1/1/2005 to now) compared to the Buy&Hold Strategy(=do nothing):
BEKB(Bekaert): EMA-Buy=12, SMA-Buy=44, Strength-Buy=65, EMA-Sell=12, SMA-Sell=55, Strength-Sell=120, Stop#ATR=20
NetProfit: 996%, #Trades: 6, %Profitable: 83%, Buy&HoldProfit: 78%
BAR(Barco): EMA-Buy=16, SMA-Buy=80, Strength-Buy=44, EMA-Sell=12, SMA-Sell=45, Strength-Sell=82, Stop#ATR=9
NetProfit: 385%, #Trades: 7, %Profitable: 71%, Buy&HoldProfit: 55%
AAPL(Apple): EMA-Buy=12, SMA-Buy=45, Strength-Buy=40, EMA-Sell=19, SMA-Sell=45, Strength-Sell=106, Stop#ATR=8
NetProfit: 6900%, #Trades: 7, %Profitable: 71%, Buy&HoldProfit: 2938%
TNET(Telenet): EMA-Buy=12, SMA-Buy=45, Strength-Buy=27, EMA-Sell=19, SMA-Sell=45, Strength-Sell=70, Stop#ATR=14
NetProfit: 129%, #Trade

EMA Indicators with BUY sell SignalCombine 3 EMA indicators into 1. Buy and Sell signal is based on
- Buy signal based on 20 Days Highest High resistance
- Sell signal based on 10 Days Lowest Low support
Input :-
1 - Short EMA (20), Mid EMA (50) and Long EMA (200)
2 - Resistance (20) = 20 Days Highest High line
3 - Support (10) = 10 Days Lowest Low line

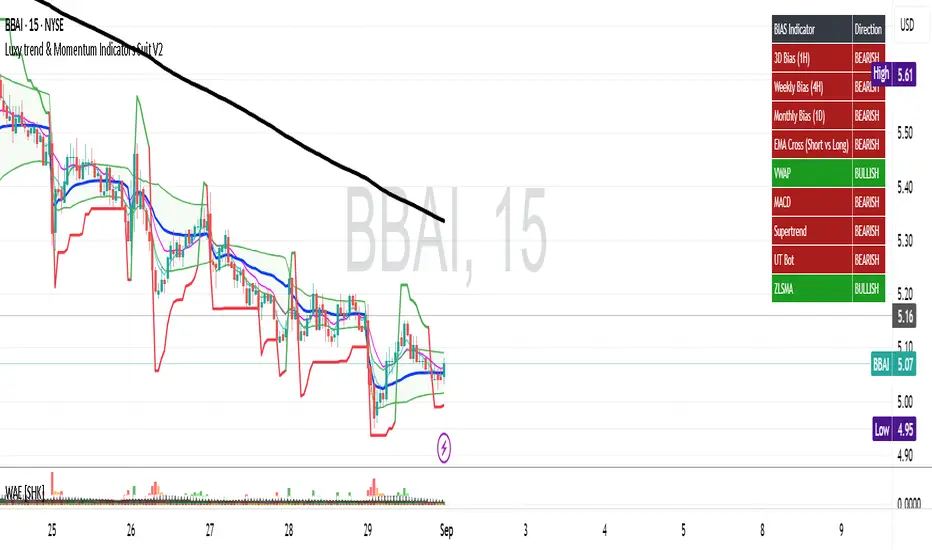
Luxy trend & Momentum Indicators Suit V2Luxy Trend & Momentum Indicator Suite V2
The Luxy Trend & Momentum Suite V2 is a multi-purpose technical analysis tool designed to help traders quickly identify high-probability trend-following and momentum-based entries across timeframes.
This tool combines the most battle-tested market filters (EMAs, VWAP, MACD, ZLSMA, Supertrend, UT Bot, Volume/ADX/RSI filters) into a unified signal framework — backed by an optional Bias Table that displays alignment across methods and timeframes.
BACKGROUND — ABOUT THIS METHOD
This Indicators Suite is based on momentum-trend alignment , a trading methodology that:
* Confirms trend structure using moving averages (EMA crossovers & price vs EMA-200),
* Validates trend strength using MACD separation, volume pressure, and ADX confirmation,
* Confirms timing using momentum oscillators (RSI pullbacks), VWAP positioning, and trend filters,
* Optionally delays entries using the UT Bot trailing confirmation or Supertrend .
It's a multi-layered filtering helps reduce false signals, especially in choppy conditions.
USAGE
This indicator is best suited for:
Intraday trend trading (scalping or day trading),
Swing trading based on HTF confirmation (1D/1W),
Combining bias + technical signal + volume + price context for cleaner entries.
It is especially powerful on assets with well-defined structure (e.g., crypto, indices, high-volume stocks).
Signal Labels
The script plots `LONG` (green) or `SHORT` (red) labels when all your configured filters align.
✅ To use these labels effectively:
Only take LONG signals when the bias table shows green ("BULLISH"),
Only take SHORT when the bias table shows red ("BEARISH"),
Avoid signals on NEUTRAL bias (gray), or consider smaller positions.
Bias Table Panel
The indicator features a compact Bias summary table , showing the current directional bias from:
Timeframe trends (1H, 4H, 1D)
Indicator states (EMA cross, EMA200, VWAP, MACD, ZLSMA, UT Bot, Supertrend)
Each cell is color-coded:
🟢 Green = Bullish
🔴 Red = Bearish
⚪ Gray = Neutral
Trend Filters
These are the primary trend components:
EMA Short vs Long : Fast/Slow structure
EMA-200 : Long-term bias
ZLSMA : Zero-lag regression slope
Supertrend : Dynamic trendline with noise-filtering
UT Bot : ATR-based trailing signal with optional filters (swing, %change, delay)
Momentum & Entry Filters
The indicator offers several modular filters to refine entry signals:
✅ MACD Separation : Requires a minimum spread between MACD and Signal line (adjustable in ATR units).
✅ VWAP Filter : Confirms that price is above/below anchored VWAP.
✅ RSI Pullback Zone : Only triggers signals when RSI is between configured pullback ranges.
✅ Volume Strength : Only confirms signals when current volume is above SMA × factor (e.g. 1.2×).
✅ ADX/DI Filter : Enforces trend strength requirements based on ADX, DI+ and DI-.
RECOMMENDED WORKFLOWS
🔹 Intraday Trend Trading
Primary TF: "1H"
Confirmation: "4H"
Bias method: EMA(20/50) or ZLSMA
Lookback: 5 bars
VWAP: Session anchor
UT Bot: Enabled with 1.3 sensitivity, ATR=10
🔹 Swing Trading
Primary TF: "1D"
Confirmation: "1W"
Bias method: EMA(20/50) or MACD
Lookback: 10–20
VWAP: Weekly or Monthly
UT Bot: Disabled or conservative (1.7 key, ATR=14)
🔹 Position Trading
Primary: "1W"
Confirmation: "1M"
Bias method: EMA(50/200)
Filters: Strong MACD + Volume + ADX
UT: Disabled
SETTINGS
You can customize:
All EMA lengths (short, long, very long)
MACD periods and buffer thresholds
VWAP anchor and bands mode (Std Dev or %)
ZLSMA length and offset
UT Bot sensitivity, ATR, and filters
Supertrend ATR logic and neutral bars
Volume, ADX, RSI, and Donchian breakouts
Table text size, position, and visibility
Each input includes tooltips with suggested ranges and explanations.
🔶 LIMITATIONS
This is an **indicator**, not a strategy. It does **not place orders**.
UT Bot and Bias alignment work better on assets with structure and volume.
Repainting is avoided by using bar close logic where possible.
Corporate-event VWAPs (Earnings, Dividends) depend on data availability.
Always backtest , adjust filters per asset, and confirm entries with price action and context.
📧 Feedback & improvement requests:
Yelober - Market Internal direction+ Key levelsYelober – Market Internals + Key Levels is a focused intraday trading tool that helps you spot high-probability price direction by anchoring decisions to structure that matters: yesterday’s RTH High/Low, today’s pre-market High/Low, and a fast Value Area/POC from the prior session. Paired with a compact market internals dashboard (NYSE/NASDAQ UVOL vs. DVOL ratios, VOLD slopes, TICK/TICKQ momentum, and optional VIX trend), it gives you a real-time read on breadth so you can choose which direction to trade, when to enter (breaks, retests, or fades at PMH/PML/VAH/VAL/POC), and how to plan exits as internals confirm or deteriorate. On top of these intraday decision benefits, it also allows traders—in a very subtle but powerful way—to keep an eye on the VIX and immediately recognize significant spikes or sharp decreases that should be factored in before entering a trade, or used as a quick signal to modify an existing position. In short: clear levels for the chart, live internals for the context, and a smarter, rules-based path to execution.
# Yelober – Market Internals + Key Levels
*A TradingView indicator for session key levels + real‑time market internals (NYSE/NASDAQ TICK, UVOL/DVOL/VOLD, and VIX).*
**Script name in Pine:** `Yelober - Market Internal direction+ Key levels` (Pine v6)
---
## 1) What this indicator does
**Purpose:** Help intraday traders quickly find high‑probability reaction zones and read market internals momentum without switching charts. It overlays yesterday/today’s **automatic price levels** on your active chart and shows a **market breadth table** that summarizes NYSE/NASDAQ buying pressure and TICK direction, with an optional VIX trend read.
### Key features at a glance
* **Automatic Price Levels (overlay on chart)**
* Yesterday’s High/Low of Day (**yHoD**, **yLoD**)
* Extended Hours High/Low (**yEHH**, **yEHL**) across yesterday AH + today pre‑market
* Today’s Pre‑Market High/Low (**PMH**, **PML**)
* Yesterday’s **Value Area High/Low** (**VAH/VAL**) and **Point of Control (POC)** computed from a volume profile of yesterday’s **regular session**
* Smart de‑duplication:
* Shows **only the higher** of (yEHH vs PMH) and **only the lower** of (yEHL vs PML) to avoid redundant bands
* **Market Breadth Table (on‑chart table)**
* **NYSE ratio** = UVOL/DVOL (signed) with **VOLD slope** from session open
* **NASDAQ ratio** = UVOLQ/DVOLQ (signed) with **VOLDQ slope** from session open
* **TICK** and **TICKQ**: live cumulative ratio and short‑term slope
* **VIX** (optional): current value + slope over a configurable lookback/timeframe
* Color‑coded trends with sensible thresholds and optional normalization
---
## 2) How to use it (trader workflow)
1. **Mark your reaction zones**
* Watch **yHoD/yLoD**, **PMH/PML**, and **VAH/VAL/POC** for first touches, break/retest, and failure tests.
* Expect increased responsiveness when multiple levels cluster (e.g., PMH ≈ VAH ≈ daily pivot).
2. **Read the breadth panel for context**
* **NYSE/NASDAQ ratio** (>1 = more up‑volume than down‑volume; <−1 = down‑dominant). Strong green across both favors long setups; red favors short setups.
* **VOLD slopes** (NYSE & NASDAQ): positive and accelerating → broadening participation; negative → persistent pressure.
* **TICK/TICKQ**: cumulative ratio and **slope arrows** (↗ / ↘ / →). Use the slope to gauge **near‑term thrust or fade**.
* **VIX slope**: rising VIX (red) often coincides with risk‑off; falling VIX (green) with risk‑on.
3. **Confluence = higher confidence**
* Example: Price reclaims **PMH** while **NYSE/NASDAQ ratios** print green and **TICK slopes** point ↗ — consider break‑and‑go; if VIX slope is ↘, that adds risk‑on confidence.
* Example: Price rejects **VAH** while **VOLD slopes** roll negative and VIX ↗ — consider fade/reversal.
4. **Risk management**
* Place stops just beyond key levels tested; if breadth flips, tighten or exit.
> **Timeframes:** Works best on 1–15m charts for intraday. Value Area is computed from **yesterday’s RTH**; choose a smaller calculation timeframe (e.g., 5–15m) for stable profiles.
---
## 3) Inputs & settings (what each option controls)
### Global Style
* **Enable all automatic price levels**: master toggle for yHoD/yLoD, yEHH/yEHL, PMH/PML, VAH/VAL/POC.
* **Line style/width**: applies to all drawn levels.
* **Label size/style** and **label color linking**: use the same color as the line or override with a global label color.
* **Maximum bars lookback**: how far the script scans to build yesterday metrics (performance‑sensitive).
### Value Area / Volume Profile
* **Enable Value Area calculations** *(on by default)*: computes yesterday’s **POC**, **VAH**, **VAL** from a simplified intraday volume profile built from yesterday’s **regular session bars**.
* **Max Volume Profile Points** *(default 50)*: lower values = faster; higher = more precise.
* **Value Area Calculation Timeframe** *(default 15)*: the security timeframe used when collecting yesterday’s highs/lows/volumes.
### Individual Level Toggles & Colors
* **yHoD / yLoD** (yesterday high/low)
* **yEHH / yEHL** (yesterday AH + today pre‑market extremes)
* **PMH / PML** (today pre‑market extremes)
* **VAH / VAL / POC** (yesterday RTH value area + point of control)
### Market Breadth Panel
* **Show NYSE / NASDAQ / VIX**: choose which series to display in the table.
* **Table Position / Size / Background Color**: UI placement and legibility.
* **Slope Averaging Periods** *(default 5)*: number of recent TICK/TICKQ ratio points used in slope calculation.
* **Candles for Rate** *(default 10)* & **Normalize Rate**: VIX slope calculation as % change between `now` and `n` candles ago; normalize divides by `n`.
* **VIX Timeframe**: optionally compute VIX on a higher TF (e.g., 15, 30, 60) for a smoother regime read.
* **Volume Normalization** (NYSE & NASDAQ): display VOLD slopes scaled to `tens/thousands/millions/10th millions` for readable magnitudes; color thresholds adapt to your choice.
---
## 4) Data sources & definitions
* **UVOL/VOLD (NYSE)** and **UVOLQ/DVOLQ/VOLDQ (NASDAQ)** via `request.security()`
* **Ratio** = `UVOL/DVOL` (signed; negative when down‑volume dominates)
* **VOLD slope** ≈ `(VOLD_now − VOLD_open) / bars_since_open`, then normalized per your setting
* **TICK/TICKQ**: cumulative sum of prints this session with **positives vs negatives ratio**, plus a simple linear regression **slope** of the last `N` ratio values
* **VIX**: value and slope across a user‑selected timeframe and lookback
* **Sessions (EST/EDT)**
* **Regular:** 09:30–16:00
* **Pre‑Market:** 04:00–09:30
* **After Hours:** 16:00–20:00
* **Extended‑hours extremes** combine **yesterday AH** + **today PM**
> **Note:** All session checks are done with TradingView’s `time(…,"America/New_York")` context. If your broker’s RTH differs (e.g., futures), adjust expectations accordingly.
---
## 5) How the algorithms work (plain English)
### A) Key Levels
* **Yesterday’s RTH High/Low**: scans yesterday’s bars within 09:30–16:00 and records the extremes + bar indices.
* **Extended Hours**: scans yesterday AH and today PM to get **yEHH/yEHL**. Script shows **either yEHH or PMH** (whichever is **higher**) and **either yEHL or PML** (whichever is **lower**) to avoid duplicate bands stacked together.
* **Value Area & POC (RTH only)**
* Build a coarse volume profile with `Max Volume Profile Points` buckets across the price range formed by yesterday’s RTH bars.
* Distribute each bar’s volume uniformly across the buckets it spans (fast approximation to keep Pine within execution limits).
* **POC** = bucket with max volume. **VA** expands from POC outward until **70%** of cumulative volume is enclosed → yields **VAH/VAL**.
### B) Market Breadth Table
* **NYSE/NASDAQ Ratio**: signed UVOL/DVOL with basic coloring.
* **VOLD Slopes**: from session open to current, normalized to human‑readable units; colors flip green/red based on thresholds that map to your normalization setting (e.g., ±2M for NYSE, ±3.5×10M for NASDAQ).
* **TICK/TICKQ Slope**: linear regression over the last `N` ratio points → **↗ / → / ↘** with the rounded slope value.
* **VIX Slope**: % change between now and `n` candles ago (optionally divided by `n`). Red when rising beyond threshold; green when falling.
---
## 6) Recommended presets
* **Stocks (liquid, intraday)**
* Value Area **ON**, `Max Volume Points` = **40–60**, **Timeframe** = **5–15**
* Breadth: show **NYSE & NASDAQ & VIX**, `Slope periods` = **5–8**, `Candles for rate` = **10–20**, **Normalize VIX** = **ON**
* **Index futures / very high‑volume symbols**
* If you see Pine timeouts, set `Max Volume Points` = **20–40** or temporarily **disable Value Area**.
* Keep breadth panel **ON** (it’s light). Consider **VIX timeframe = 15/30** for regime clarity.
---
## 7) Tips, edge cases & performance
* **Performance:** The volume profile is capped (`maxBarsToProcess ≤ 500` and bucketed) to keep it responsive. If you experience slowdowns, reduce `Max Volume Points`, `Maximum bars lookback`, or disable Value Area.
* **Redundant lines:** The script **intentionally suppresses** PMH/PML when yEHH/yEHL are more extreme, and vice‑versa.
* **Label visibility:** Use `Label style = none` if you only want clean lines and read values from the right‑end labels.
* **Futures/RTH differences:** Value Area is from **yesterday’s RTH** only; for 24h instruments the RTH period may not reflect overnight structure.
* **Session transitions:** PMH/PML tracking stops as soon as RTH starts; values persist as static levels for the session.
---
## 8) Known limitations
* Uses public TradingView symbols: `UVOL`, `VOLD`, `UVOLQ`, `DVOLQ`, `VOLDQ`, `TICK`, `TICKQ`, `VIX`. If your data plan or region limits any symbol, the corresponding table rows may show `na`.
* The VA/POC approximation assumes uniform distribution of each bar’s volume across its high–low. That’s fast but not a tick‑level profile.
* Works best on US equities with standard NY session; alternative sessions may need code changes.
---
## 9) Troubleshooting
* **“Script is too slow / timed out”** → Lower `Max Volume Points`, lower `Maximum bars lookback`, or toggle **OFF** `Enable Value Area calculations` for that instrument.
* **Missing breadth values** → Ensure the symbols above load on your account; try reloading chart or switching timeframes once.
* **Overlapping labels** → Set `Label style = none` or reduce label size.
---
## 10) Version / license / contribution
* **Version:** Initial public release (Pine v6).
* **Author:** © yelober
* **License:** Free for community use and enhancement. Please keep author credit.
* **Contributing:** Open PRs/ideas: presets, alert conditions, multi‑day VA composites, optional mid‑value (`(VAH+VAL)/2`), session filter for futures, and alertable state machine for breadth regime transitions.
---
## 11) Quick start (TL;DR)
1. Add the indicator and **keep default settings**.
2. Trade **reactions** at yHoD/yLoD/PMH/PML/VAH/VAL/POC.
3. Use the **breadth table**: look for **green ratios + ↗ slopes** (risk‑on) or **red ratios + ↘ slopes** (risk‑off). Check **VIX** slope for confirmation.
4. Manage risk around levels; when breadth flips against you, tighten or exit.
---
### Changelog (public)
* **v1.0:** First community release with automatic RTH levels, VA/POC approximation, breadth dashboard (NYSE/NASDAQ/TICK/TICKQ/VIX) with normalization and adaptive color thresholds.

HSM TOOLS//@version=5
indicator("HSM TOOLS", overlay=true, max_lines_count=500, max_labels_count=5, max_boxes_count=500)
// General Settings Inputs
TZI = input.string (defval="UTC -4", title="Timezone Selection", options= , tooltip="Select the Timezone. ( Shifts Chart Elements )", group="Global Settings")
Timezone = TZI == "UTC -10" ? "GMT-10:00" : TZI == "UTC -7" ? "GMT-07:00" : TZI == "UTC -6" ? "GMT-06:00" : TZI == "UTC -5" ? "GMT-05:00" : TZI == "UTC -4" ? "GMT-04:00" : TZI == "UTC -3" ? "GMT-03:00" : TZI == "UTC +0" ? "GMT+00:00" : TZI == "UTC +1" ? "GMT+01:00" : TZI == "UTC +2" ? "GMT+02:00" : TZI == "UTC +3" ? "GMT+03:00" : TZI == "UTC +3:30" ? "GMT+03:30" : TZI == "UTC +4" ? "GMT+04:00" : TZI == "UTC +5" ? "GMT+05:00" : TZI == "UTC +5:30" ? "GMT+05:30" : TZI == "UTC +6" ? "GMT+06:00" : TZI == "UTC +7" ? "GMT+07:00" : TZI == "UTC +8" ? "GMT+08:00" : TZI == "UTC +9" ? "GMT+09:00" : TZI == "UTC +9:30" ? "GMT+09:30" : TZI == "UTC +10" ? "GMT+10:00" : TZI == "UTC +10:30" ? "GMT+10:30" : TZI == "UTC +11" ? "GMT+11:00" : TZI == "UTC +13" ? "GMT+13:00" : "GMT+13:45"
inputMaxInterval = input.int (31, title="Hide Indicator Above Specified Minutes", tooltip="Above 30Min, Chart Will Become Messy & Unreadable", group="Global Settings")
// Session options
ShowTSO = input.bool (true, title="Show Today's Session Only", group="Session Options", tooltip="Hide Historical Sessions")
ShowTWO = input.bool (true, title="Show Current Week's Sessions Only", group="Session Options", tooltip="Show All Sessions from the current week")
SL4W = input.bool (true, title="Show Last 4 Week Sessions", group="Session Options", tooltip="Show All Sessions from Last Four Weeks \nShould Disable Current Week Session to Work")
ShowSFill = input.bool (false, title="Show Session Highlighting", group="Session Options", tooltip="Highlights Session from Top of the Chart to Bottom")
//----------------------------------------------
// Historical Lines
ShowMOPL = input.bool (title="Midnight Historical Price Lines", defval=false, group="Historical Lines", tooltip="Shows Historical Midnight Price Lines")
MOLHist = input.bool (title="Midnight Historical Vertical Lines", defval=true, group="Historical Lines", tooltip="Shows Historical Midnight Vertical Lines")
ShowPrev = input.bool (false, title="Misc. Historical Price Lines", group="Historical Lines", tooltip="Makes Chart Cluttered, Use For Backtesting Only")
//----------------------------------------------
// Session Bool
ShowLondon = input.bool (false, "", inline="LONDON", group="Sessions", tooltip="01:00 to 05:00")
ShowNY = input.bool (false, "", inline="NY", group="Sessions", tooltip="07:00 to 10:00")
ShowLC = input.bool (false, "", inline="LC", group="Sessions", tooltip="10:00 to 12:00")
ShowPM = input.bool (false, "",inline="PM", group="Sessions", tooltip="13:00 to 16:00")
ShowAsian = input.bool (false, "",inline="ASIA2", group="Sessions", tooltip="20:00 to 00:00")
ShowFreeSesh = input.bool (false, "",inline="FREE", group="Sessions", tooltip="Custom Session")
// Session Strings
txt2 = input.string ("LONDON", title="", inline="LONDON", group="Sessions")
txt3 = input.string ("NEW YORK", title="", inline="NY", group="Sessions")
txt4 = input.string ("LDN CLOSE", title="", inline="LC", group="Sessions")
txt5 = input.string ("AFTERNOON", title="", inline="PM", group="Sessions")
txt6 = input.string ("ASIA", title="", inline="ASIA2", group="Sessions")
txt9 = input.string ("FREE SESH", title="", inline="FREE", group="Sessions")
// CBDR = input.session ('1400-2000:1234567', "", inline="CBDR", group="Sessions")
// ASIA = input.session ('2000-0000:1234567', "", inline="ASIA", group="Sessions")
// Session Times
LDNsesh = input.session ('0200-0500:1234567', "", inline="LONDON", group="Sessions")
NYsesh = input.session ('0700-1000:1234567', "", inline="NY", group="Sessions")
LCsesh = input.session ('1000-1200:1234567', "", inline="LC", group="Sessions")
PMsesh = input.session ('1300-1600:1234567', "", inline="PM", group="Sessions")
ASIA2sesh = input.session ('2000-2359:1234567', "", inline="ASIA2", group="Sessions")
FreeSesh = input.session ('0000-0000:1234567', "", inline="FREE", group="Sessions")
// Session Color
LSFC = input.color (color.new(#787b86, 90), "", inline="LONDON", group="Sessions")
NYSFC = input.color (color.new(#787b86, 90), "",inline="NY", group="Sessions")
LCSFC = input.color (color.new(#787b86, 90), "",inline="LC", group="Sessions")
PMSFC = input.color (color.new(#787b86, 90), "",inline="PM", group="Sessions")
ASFC = input.color (color.new(#787b86, 90), "",inline="ASIA2", group="Sessions")
FSFC = input.color (color.new(#787b86, 90), "",inline="FREE", group="Sessions")
//----------------------------------------------
// Vertical Line Bool
ShowMOP = input.bool (title="", defval=true, inline="MOP", group="Vertical Lines", tooltip="00:00 AM")
txt12 = input.string ("MIDNIGHT", title="", inline="MOP", group="Vertical Lines")
ShowLOP = input.bool (title="", defval=false, inline="LOP", group="Vertical Lines", tooltip="03:00 AM")
txt14 = input.string ("LONDON", title="", inline="LOP", group="Vertical Lines")
ShowNYOP = input.bool (title="", defval=true, inline="NYOP", group="Vertical Lines", tooltip="08:30 AM")
txt15 = input.string ("NEW YORK", title="", inline="NYOP", group="Vertical Lines")
ShowEOP = input.bool (title="", defval=false, inline="EOP", group="Vertical Lines", tooltip="09:30 AM")
txt16 = input.string ("EQUITIES", title="", inline="EOP", group="Vertical Lines")
// Vertical Line Color
MOPColor = input.color (color.new(#787b86, 0), "", inline="MOP", group="Vertical Lines")
LOPColor = input.color (color.rgb(0,128,128,60), "", inline="LOP", group="Vertical Lines")
NYOPColor = input.color (color.rgb(0,128,128,60), "", inline="NYOP", group="Vertical Lines")
EOPColor = input.color (color.rgb(0,128,128,60), "", inline="EOP", group="Vertical Lines")
// Vertical LineStyle
Midnight_Open_LS = input.string ("Dotted", "", options= , inline="MOP", group="Vertical Lines")
london_Open_LS = input.string ("Solid", "", options= , inline="LOP", group="Vertical Lines")
NY_Open_LS = input.string ("Solid", "", options= , inline="NYOP", group="Vertical Lines")
Equities_Open_LS = input.string ("Solid", "", options= , inline="EOP", group="Vertical Lines")
// Vertical LineWidth
Midnight_Open_LW = input.string ("1px", "", options= , inline="MOP", group="Vertical Lines")
London_Open_LW = input.string ("1px", "", options= , inline="LOP", group="Vertical Lines")
NY_Open_LW = input.string ("1px", "", options= , inline="NYOP", group="Vertical Lines")
Equities_Open_LW = input.string ("1px", "", options= , inline="EOP", group="Vertical Lines")
//----------------------------------------------
// Opening Price Bool
ShowMOPP = input.bool (title="", defval=true, inline="MOPP", group="Opening Price Lines", tooltip="00:00 AM")
txt13 = input.string ("MIDNIGHT", title="", inline="MOPP", group="Opening Price Lines")
ShowNYOPP = input.bool (title="", defval=false, inline="NYOPP", group="Opening Price Lines", tooltip="08:30 AM")
txt17 = input.string ("NEW YORK", title="", inline="NYOPP", group="Opening Price Lines")
ShowEOPP = input.bool (title="", defval=false, inline="EOPP", group="Opening Price Lines", tooltip="09:30 AM")
txt18 = input.string ("EQUITIES", title="", inline="EOPP", group="Opening Price Lines")
ShowAFTPP = input.bool (title="", defval=false, inline="AFTOPP", group="Opening Price Lines", tooltip="01:30 PM")
txt1330 = input.string ("AFTERNOON", title="", inline="AFTOPP", group="Opening Price Lines")
// Opening Price Color
MOPColP = input.color (color.new(#787b86, 0), "", inline="MOPP", group="Opening Price Lines")
NYOPColP = input.color (color.new(#787b86, 0), "", inline="NYOPP", group="Opening Price Lines")
EOPColP = input.color (color.new(#787b86, 0), "", inline="EOPP", group="Opening Price Lines")
AFTOPColP = input.color (color.new(#787b86, 0), "", inline="AFTOPP", group="Opening Price Lines")
// Opening Price LineStyle
MOPLS = input.string ("Dotted", "", options= , inline="MOPP", group="Opening Price Lines")
NYOPLS = input.string ("Dotted", "", options= , inline="NYOPP", group="Opening Price Lines")
EOPLS = input.string ("Dotted", "", options= , inline="EOPP", group="Opening Price Lines")
AFTOPLS = input.string ("Dotted", "", options= , inline="AFTOPP", group="Opening Price Lines")
// Opening Price LineWidth
i_MOPLW = input.string ("1px", "", options= , inline="MOPP", group="Opening Price Lines")
i_NYOPLW = input.string ("1px", "", options= , inline="NYOPP", group="Opening Price Lines")
i_EOPLW = input.string ("1px", "", options= , inline="EOPP", group="Opening Price Lines")
i_AFTOPLW = input.string ("1px", "", options= , inline="AFTOPP", group="Opening Price Lines")
//----------------------------------------------
// W&M Bool
ShowWeekOpen = input.bool (defval=false, title="", tooltip="Draw Weekly Open Price Line", group="HTF Opening Price Lines", inline="WO")
showMonthOpen = input.bool (defval=false, title="", tooltip="Draw Monthly Open Price Line", group="HTF Opening Price Lines", inline="MO")
// W&M String
txt19 = input.string ("WEEKLY", title="", inline="WO", group="HTF Opening Price Lines")
txt20 = input.string ("MONTHLY", title="", inline="MO", group="HTF Opening Price Lines")
// W&M Color
i_WeekOpenCol = input.color (title="", defval=color.new(#787b86, 0), group="HTF Opening Price Lines", inline="WO")
i_MonthOpenCol = input.color (title="", tooltip="", defval=color.new(#787b86, 0), group="HTF Opening Price Lines", inline="MO")
// W&M LineStyle
WOLS = input.string ("Dotted", "", options= , inline="WO", group="HTF Opening Price Lines")
MOLS = input.string ("Dotted", "", options= , inline="MO", group="HTF Opening Price Lines")
// W&M LineWidth
i_WOPLW = input.string ("1px", "", options= , inline="WO", group="HTF Opening Price Lines")
i_MONPLW = input.string ("1px", "", options= , inline="MO", group="HTF Opening Price Lines")
//----------------------------------------------
// CBDR, ASIA & FLOUT
ShowCBDR = input.bool (true, "", inline='CBDR', group="CBDR, ASIA & FLOUT")
ShowASIA = input.bool (true, "", inline='ASIA', group="CBDR, ASIA & FLOUT")
ShowFLOUT = input.bool (false, "", inline='FLOUT', group="CBDR, ASIA & FLOUT")
// Strings
txt0 = input.string ("CBDR", title="", inline="CBDR", group="CBDR, ASIA & FLOUT", tooltip="16:00 to 20:00 \nSD Increments of 1")
txt1 = input.string ("ASIA", title="", inline="ASIA", group="CBDR, ASIA & FLOUT", tooltip="20:00 to 00:00 \nSD Increments of 1")
txt7 = input.string ("FLOUT", title="", inline="FLOUT", group="CBDR, ASIA & FLOUT", tooltip="16:00 to 00:00 \nSD Increments of 0.5")
// Color
CBDRBoxCol = input.color (color.new(#787b86, 0),"", inline='CBDR', group="CBDR, ASIA & FLOUT")
ASIABoxCol = input.color (color.new(#787b86, 0), "", inline='ASIA', group="CBDR, ASIA & FLOUT")
FLOUTBoxCol = input.color (color.new(#787b86, 0),"", inline='FLOUT', group="CBDR, ASIA & FLOUT")
// Extras
box_text_cbdr = input.bool (true, "Show Text", inline="CBDR", group="CBDR, ASIA & FLOUT")
box_text_cbdr_col = input.color (color.new(color.gray, 80), "", inline="CBDR", group="CBDR, ASIA & FLOUT")
bool_cbdr_dev = input.bool (true, "SD", inline="CBDR", group="CBDR, ASIA & FLOUT")
box_text_asia = input.bool (true, "Show Text", inline="ASIA", group="CBDR, ASIA & FLOUT")
box_text_asia_col = input.color (color.new(color.gray, 80), "", inline="ASIA", group="CBDR, ASIA & FLOUT")
bool_asia_dev = input.bool (true, "SD", inline="ASIA", group="CBDR, ASIA & FLOUT")
box_text_flout = input.bool (true, "Show Text", inline="FLOUT", group="CBDR, ASIA & FLOUT")
box_text_flout_col = input.color (color.new(color.gray, 80), "", inline="FLOUT", group="CBDR, ASIA & FLOUT")
bool_flout_dev = input.bool (true, "SD", inline="FLOUT", group="CBDR, ASIA & FLOUT")
// Table
// SD Lines
ShowDevLN = input.bool (title="", defval=true, inline="DEVLN", group="Standard Deviation", tooltip="Deviation Lines")
DEVLNTXT = input.string ("SD LINES", title="", inline="DEVLN", group="Standard Deviation")
DevLNCol = input.color (color.new(#787b86, 0), "", inline="DEVLN", group="Standard Deviation")
DEVLS = input.string ("Solid", "", options= , inline="DEVLN", group="Standard Deviation")
i_DEVLW = input.string ("1px", "", options= , inline="DEVLN", group="Standard Deviation")
DEVLSS = DEVLS=="Solid" ? line.style_solid : DEVLS == "Dotted" ? line.style_dotted : line.style_dashed
DEVLW = i_DEVLW=="1px" ? 1 : i_DEVLW == "2px" ? 2 : i_DEVLW == "3px" ? 3 : i_DEVLW == "4px" ? 4 : 5
ShowDev = input.bool (false, '', inline="DEV", group="Standard Deviation")
txt8 = input.string ("SD COUNT", title="", inline="DEV", group="Standard Deviation")
SDCountCol = input.color (color.new(#787b86, 0), "", inline="DEV", group="Standard Deviation")
DevInput = input.string ("2 SD", "", options= , inline="DEV", group="Standard Deviation")
DevDirection = input.string ("Both", "", options= , inline="DEV", group="Standard Deviation", tooltip="SD Count, NULL, SD Count, SD Direction")
DevCount = DevInput == "1 SD" ? 1 : DevInput == "2 SD" ? 2 : DevInput == "3 SD" ? 3 : 4
Auto_Select = input.bool (false, "", group="Standard Deviation", inline="AUTOSD", tooltip="Auto SD Selection | Charter Content, Range Table \nMight Bug Out On Mondays" )
txtSD = input.string ("AUTO SD", "", group="Standard Deviation", inline="AUTOSD")
Tab1txtCol = input.color (color.new(#808080, 0), "", inline='AUTOSD', group="Standard Deviation")
TabOptionShow = input.string ("Show Table", "", options= , inline="AUTOSD", group="Standard Deviation")
Stats = TabOptionShow == "Show Table" ? true : false
TabOption1 = input.string ("Top Right", "", options= , inline="AUTOSD", group="Standard Deviation")
tabinp1 = TabOption1 == "Top Left" ? position.top_left : TabOption1 == "Top Center" ? position.top_center : TabOption1 == "Top Right" ? position.top_right : TabOption1 == "Middle Left" ? position.middle_left : TabOption1 == "Middle Right" ? position.middle_right : TabOption1 == "Bottom Left" ? position.bottom_left : TabOption1 == "Bottom Center" ? position.bottom_center : position.bottom_right
L_Prof = true
CellBG = color.new(#131722, 100)
//----------------------------------------------
// Day Of Week & Labels
// Label Settings Inputs
ShowLabel = input.bool (true, title="", inline="Glabel", group="Day Of Week & Labels")
txt21 = input.string ("LABEL", title="", inline="Glabel", group="Day Of Week & Labels")
LabelColor = input.color (color.rgb(0,0,0,100), "", inline="Glabel", group="Day Of Week & Labels")
LabelSizeInput = input.string ("Normal", "", options= , inline="Glabel", group="Day Of Week & Labels")
Terminusinp = input.string ("Terminus @ Current Time +1hr", "", options = , inline="Glabel", group="Day Of Week & Labels", tooltip="Select Label Size & Color & Terminus \nHistorical Price Lines needs to be toggled off for using Terminus")
ShowLabelText = input.bool (true, title="", inline="label", group="Day Of Week & Labels")
txt22 = input.string ("LABEL TEXT", title="", inline="label", group="Day Of Week & Labels")
LabelTextColor = input.color (color.new(#787b86, 0), title="", inline="label", group="Day Of Week & Labels")
LabelTextOptioninput = input.string ("Time", "", options= , inline="label", group="Day Of Week & Labels", tooltip="Choose Between Descriptive Text as Label or Time \nShow/Hide Prices on Labels")
ShowPricesBool = input.string ("Hide Prices", title="", options= , group="Day Of Week & Labels", inline="label")
ShowPrices = ShowPricesBool == "Show Prices" ? true : false
showDOW = input.bool (true, title="", inline="DOW", group="Day Of Week & Labels")
txt24 = input.string ("DAY OF WEEK", title="", inline="DOW", group="Day Of Week & Labels")
i_DOWCol = input.color (color.new(#787b86, 0), title="", inline="DOW", group="Day Of Week & Labels")
DOWTime = input.int (defval = 12, title="", inline="DOW", group="Day Of Week & Labels")
DOWLoc_inpt = input.string ("Bottom", "", options = , inline="DOW", group="Day Of Week & Labels", tooltip="DOW Color, Time Alignment, Vertical Location")
DOWLoc = DOWLoc_inpt == "Bottom" ? location.bottom : location.top
//----------------------------------------------
BIAS_M_Bool = input.bool (false, "", group="BIAS & NOTES PRECONFIG", inline="stats")
txt100 = input.string ("BIAS", title="", inline="stats", group="BIAS & NOTES PRECONFIG")
TableBG2 = color.new(#131722, 100)
Tab2txtCol = input.color (color.new(#787b86, 0), "", inline='stats', group="BIAS & NOTES PRECONFIG")
TabOption2 = input.string ("Bottom Right", "", options= , inline="stats", group="BIAS & NOTES PRECONFIG")
tabinp2 = TabOption2 == "Top Left" ? position.top_left : TabOption2 == "Top Center" ? position.top_center : TabOption2 == "Top Right" ? position.top_right : TabOption2 == "Middle Left" ? position.middle_left : TabOption2 == "Middle Right" ? position.middle_right : TabOption2 == "Bottom Left" ? position.bottom_left : TabOption2 == "Bottom Center" ? position.bottom_center : position.bottom_right
notesbool = false
NOTES_M_Bool = input.bool (true, "", group="BIAS & NOTES PRECONFIG", inline="stats2")
txt101 = input.string ("NOTES", title="", inline="stats2", group="BIAS & NOTES PRECONFIG")
Tab3txtCol = input.color (color.new(#787b86, 0), "", inline='stats2', group="BIAS & NOTES PRECONFIG")
TabOption3 = input.string ("Top Center", "", options= , inline="stats2", group="BIAS & NOTES PRECONFIG")
tabinp3 = TabOption3 == "Top Left" ? position.top_left : TabOption3 == "Top Center" ? position.top_center : TabOption3 == "Top Right" ? position.top_right : TabOption3 == "Middle Left" ? position.middle_left : TabOption3 == "Middle Right" ? position.middle_right : TabOption3 == "Bottom Left" ? position.bottom_left : TabOption3 == "Bottom Center" ? position.bottom_center : position.bottom_right
BIASbool1 = input.bool (true, '', inline="BIAS1", group="BIAS & NOTES")
txt52 = input.string ("DXY ", title="", inline="BIAS1", group="BIAS & NOTES")
BIASOption1 = input.string ("Unclear", options= , title="", inline="BIAS1", group="BIAS & NOTES")
BIASbool2 = input.bool (true, '', inline="BIAS2", group="BIAS & NOTES")
txt53 = input.string ("SPX ", title="", inline="BIAS2", group="BIAS & NOTES")
BIASOption2 = input.string ("Unclear", options= , title="", inline="BIAS2", group="BIAS & NOTES")
BIASbool3 = input.bool (true, '', inline="BIAS3", group="BIAS & NOTES")
txt54 = input.string ("DOW ", title="", inline="BIAS3", group="BIAS & NOTES")
BIASOption3 = input.string ("Unclear", options= , title="", inline="BIAS3", group="BIAS & NOTES")
BIASbool4 = input.bool (true, '', inline="BIAS4", group="BIAS & NOTES")
txt55 = input.string ("NAS ", title="", inline="BIAS4", group="BIAS & NOTES")
BIASOption4 = input.string ("Unclear", options= , title="", inline="BIAS4", group="BIAS & NOTES")
notes = input.text_area ("@hiran.invest", "Notes", group = "BIAS & NOTES")
//--------------------END OF INPUTS--------------------//
// Pre-Def
DOM = (timeframe.multiplier <= inputMaxInterval) and (timeframe.isintraday)
newDay = ta.change(dayofweek)
newWeek = ta.change(weekofyear)
newMonth = ta.change(time("M"))
transparentcol = color.rgb(255,255,255,100)
LSVLC = color.rgb(255,255,255,100)
NYSVLC = color.rgb(255,255,255,100)
PMSVLC = color.rgb(255,255,255,100)
ASVLC = color.rgb(255,255,255,100)
LSVLS = "dotted"
NYSVLS = "dotted"
PMSVLS = "dotted"
ASVLS = "dotted"
// Functions
isToday = false
if year(timenow) == year(time) and month(timenow) == month(time) and dayofmonth(timenow) == dayofmonth(time)
isToday := true
// Current Week
thisweek = year(timenow) == year(time) and weekofyear(timenow) == weekofyear(time)
LastOneWeek = year(timenow) == year(time) and weekofyear(timenow-604800000) == weekofyear(time)
LastTwoWeek = year(timenow) == year(time) and weekofyear(timenow-1209600000) == weekofyear(time)
LastThreeWeek = year(timenow) == year(time) and weekofyear(timenow-1814400000) == weekofyear(time)
LastFourWeek = year(timenow) == year(time) and weekofyear(timenow-2419200000) == weekofyear(time)
Last4Weeks = false
if thisweek == true or LastOneWeek == true or LastTwoWeek == true or LastThreeWeek == true or LastFourWeek == true
Last4Weeks := true
// Function to draw Vertical Lines
vline(Start, Color, linestyle, LineWidth) =>
line.new(x1=Start, y1=low - ta.tr, x2=Start, y2=high + ta.tr, xloc=xloc.bar_time, extend=extend.both, color=Color, style=linestyle, width=LineWidth)
// Function to convert forex pips into whole numbers
atr = ta.atr(14)
toWhole(number) =>
if syminfo.type == "forex" // This method only works on forex pairs
_return = atr < 1.0 ? (number / syminfo.mintick) / 10 : number
_return := atr >= 1.0 and atr < 100.0 and syminfo.currency == "JPY" ? _return * 100 : _return
else
number
// Function for determining the Start of a Session (taken from the Pinescript manual: www.tradingview.com )
SessionBegins(sess) =>
t = time("", sess , Timezone)
DOM and (not barstate.isfirst) and na(t ) and not na(t)
// BarIn Session
BarInSession(sess) =>
time(timeframe.period, sess, Timezone) != 0
// Label Type Logic
var SFistrue = true
if LabelTextOptioninput == "Time"
SFistrue := true
else
SFistrue := false
// Session String to int
SeshStartHour(Session) =>
math.round(str.tonumber(str.substring(Session,0,2)))
SeshStartMins(Session) =>
math.round(str.tonumber(str.substring(Session,2,4)))
SeshEndHour(Session) =>
math.round(str.tonumber(str.substring(Session,5,7)))
SeshEndMins(Session) =>
math.round(str.tonumber(str.substring(Session,7,9)))
// Time periods
CBDR = "1600-2000:1234567"
ASIA = "2000-0000:1234567"
FLOUT = "1600-0000:1234567"
midsesh = "0000-1600:1234567"
cbdrOpenTime = timestamp (Timezone, year, month, dayofmonth, SeshStartHour(CBDR), SeshStartMins(CBDR), 00)
cbdrEndTime = timestamp (Timezone, year, month, dayofmonth, SeshEndHour(CBDR), SeshEndMins(CBDR), 00)
asiaOpenTime = timestamp (Timezone, year, month, dayofmonth, SeshStartHour(ASIA), SeshStartMins(ASIA), 00)
asiaEndTime = timestamp (Timezone, year, month, dayofmonth, SeshEndHour(ASIA), SeshEndMins(ASIA), 00)+86400000
floutOpenTime = timestamp (Timezone, year, month, dayofmonth, SeshStartHour(FLOUT), SeshStartMins(FLOUT), 00)
floutEndTime = timestamp (Timezone, year, month, dayofmonth, SeshEndHour(FLOUT), SeshEndMins(FLOUT), 00)+86400000
CBDRTime = time (timeframe.period, CBDR, Timezone)
ASIATime = time (timeframe.period, ASIA, Timezone)
FLOUTTime = time (timeframe.period, FLOUT, Timezone)
LabelOnlyToday = true
// Time Periods
LondonStartTime = timestamp(Timezone, year, month, dayofmonth, SeshStartHour(LDNsesh), SeshStartMins(LDNsesh), 00)
LondonEndTime = timestamp(Timezone, year, month, dayofmonth, SeshEndHour(LDNsesh), SeshEndMins(LDNsesh), 00)
NYStartTime = timestamp(Timezone, year, month, dayofmonth, SeshStartHour(NYsesh), SeshStartMins(NYsesh), 00)
NYEndTime = timestamp(Timezone, year, month, dayofmonth, SeshEndHour(NYsesh), SeshEndMins(NYsesh), 00)
LCStartTime = timestamp(Timezone, year, month, dayofmonth, SeshStartHour(LCsesh), SeshStartMins(LCsesh), 00)
LCEndTime = timestamp(Timezone, year, month, dayofmonth, SeshEndHour(LCsesh), SeshEndMins(LCsesh), 00)
PMStartTime = timestamp(Timezone, year, month, dayofmonth, SeshStartHour(PMsesh), SeshStartMins(PMsesh), 00)
PMEndTime = timestamp(Timezone, year, month, dayofmonth, SeshEndHour(PMsesh), SeshEndMins(PMsesh), 00)
AsianStartTime = timestamp(Timezone, year, month, dayofmonth, SeshStartHour(ASIA2sesh), SeshStartMins(ASIA2sesh), 00)
AsianEndTime = timestamp(Timezone, year, month, dayofmonth, SeshEndHour(ASIA2sesh), SeshEndMins(ASIA2sesh), 00)
FreeStartTime = timestamp(Timezone, year, month, dayofmonth, SeshStartHour(FreeSesh), SeshStartMins(FreeSesh), 00)
FreeEndTime = timestamp(Timezone, year, month, dayofmonth, SeshEndHour(FreeSesh), SeshEndMins(FreeSesh), 00)
MidnightOpenTime = timestamp(Timezone, year, month, dayofmonth, 0, 0, 00)
CLEANUPTIME = timestamp(Timezone, year, month, dayofmonth, 0, 0, 00) - 16200000
LondonOpenTime = timestamp(Timezone, year, month, dayofmonth, 3, 0, 00)
NYOpenTime = timestamp(Timezone, year, month, dayofmonth, 8, 30, 00)
EquitiesOpenTime = timestamp(Timezone, year, month, dayofmonth, 9, 30, 00)
AfternoonOpenTime = timestamp(Timezone, year, month, dayofmonth, 13, 30, 00)
tMidnight = time("1", "0000-0001:1234567", Timezone)
// Cleanup - Remove old drawing objects
Cleanup(days) =>
// Delete old drawing objects
// One day is 86400000 milliseconds
removal_timestamp = (CLEANUPTIME) - (days * 86400000) // Remove every drawing object older than the start of the Today's Midnight
a_allLines = line.all
a_allLabels = label.all
a_allboxes = box.all
// Remove old lines
if array.size(a_allLines) > 0
for i = 0 to array.size(a_allLines) - 1
line_x2 = line.get_x2(array.get(a_allLines, i))
if line_x2 < (removal_timestamp)
line.delete(array.get(a_allLines, i))
// Remove old labels
if array.size(a_allLabels) > 0
for i = 0 to array.size(a_allLabels) - 1
label_x = label.get_x(array.get(a_allLabels, i))
if label_x < removal_timestamp
label.delete(array.get(a_allLabels, i))
// Remove old boxes
if array.size(a_allboxes) > 0
for i = 0 to array.size(a_allboxes) - 1
box_x = box.get_right(array.get(a_allboxes, i))
if box_x < (removal_timestamp - 86400000)
box.delete(array.get(a_allboxes, i))
// End of Cleanup function
// Terminus Function
Terminus(Terminus_Inp)=>
if Terminus_Inp == "Terminus @ Current Time"
_return = timenow
else if Terminus_Inp == "Terminus @ Current Time +15min"
_return = timenow + 900000
else if Terminus_Inp == "Terminus @ Current Time +30min"
_return = timenow + 1800000
else if Terminus_Inp == "Terminus @ Current Time +45min"
_return = timenow + 2700000
else if Terminus_Inp == "Terminus @ Current Time +1hr"
_return = timenow + 3600000
else if Terminus_Inp == "Terminus @ Current Time +2hr"
_return = timenow + 7200000
else
_return = timenow + 10800000
// Linestyle Function
MNOPLS = Midnight_Open_LS=="Solid" ? line.style_solid : Midnight_Open_LS == "Dotted" ? line.style_dotted : line.style_dashed
LNOPLS = london_Open_LS=="Solid" ? line.style_solid : london_Open_LS == "Dotted" ? line.style_dotted : line.style_dashed
NWYOPLS = NY_Open_LS=="Solid" ? line.style_solid : NY_Open_LS == "Dotted" ? line.style_dotted : line.style_dashed
EQOPLS = Equities_Open_LS=="Solid" ? line.style_solid : Equities_Open_LS == "Dotted" ? line.style_dotted : line.style_dashed
MOPLSS = MOPLS=="Solid" ? line.style_solid : MOPLS == "Dotted" ? line.style_dotted : line.style_dashed
NYOPLSS = NYOPLS=="Solid" ? line.style_solid : NYOPLS == "Dotted" ? line.style_dotted : line.style_dashed
EOPLSS = EOPLS=="Solid" ? line.style_solid : EOPLS == "Dotted" ? line.style_dotted : line.style_dashed
AFTOPLSS = AFTOPLS=="Solid" ? line.style_solid : AFTOPLS == "Dotted" ? line.style_dotted : line.style_dashed
WeekOpenLS = WOLS=="Solid" ? line.style_solid : WOLS == "Dotted" ? line.style_dotted : line.style_dashed
MonthOpenLS = MOLS=="Solid" ? line.style_solid : MOLS == "Dotted" ? line.style_dotted : line.style_dashed
// Linewidth Function
MOPLW = Midnight_Open_LW=="1px" ? 1 : Midnight_Open_LW == "2px" ? 2 : Midnight_Open_LW == "3px" ? 3 : Midnight_Open_LW == "4px" ? 4 : 5
LOPLW = London_Open_LW=="1px" ? 1 : London_Open_LW == "2px" ? 2 : London_Open_LW == "3px" ? 3 : London_Open_LW == "4px" ? 4 : 5
NYOPLW = NY_Open_LW=="1px" ? 1 : NY_Open_LW == "2px" ? 2 : NY_Open_LW == "3px" ? 3 : NY_Open_LW == "4px" ? 4 : 5
EOPLW = Equities_Open_LW=="1px" ? 1 : Equities_Open_LW == "2px" ? 2 : Equities_Open_LW == "3px" ? 3 : Equities_Open_LW == "4px" ? 4 : 5
MOPPLW = i_MOPLW=="1px" ? 1 : i_MOPLW == "2px" ? 2 : i_MOPLW == "3px" ? 3 : i_MOPLW == "4px" ? 4 : 5
NYOPPLW = i_NYOPLW=="1px" ? 1 : i_NYOPLW == "2px" ? 2 : i_NYOPLW == "3px" ? 3 : i_NYOPLW == "4px" ? 4 : 5
EOPPLW = i_EOPLW=="1px" ? 1 : i_EOPLW == "2px" ? 2 : i_EOPLW == "3px" ? 3 : i_EOPLW == "4px" ? 4 : 5
AFTOPLW = i_AFTOPLW=="1px" ? 1 : i_AFTOPLW == "2px" ? 2 : i_AFTOPLW == "3px" ? 3 : i_AFTOPLW == "4px" ? 4 : 5
WEEKOPPLW = i_WOPLW=="1px" ? 1 : i_WOPLW == "2px" ? 2 : i_WOPLW == "3px" ? 3 : i_WOPLW == "4px" ? 4 : 5
MONTHOPPLW = i_MONPLW=="1px" ? 1 : i_MONPLW == "2px" ? 2 : i_MONPLW == "3px" ? 3 : i_MONPLW == "4px" ? 4 : 5
// Label Size Function
LabelSize =LabelSizeInput=="Auto" ? size.auto : LabelSizeInput=="Tiny" ? size.tiny : LabelSizeInput=="Small" ? size.small : LabelSizeInput=="Normal" ? size.normal : LabelSizeInput=="Large" ? size.large : size.huge
// Creating Variables
var London_Start_Vline = line.new(x1=na, y1=na, x2=na, xloc=xloc.bar_time, y2=close, color=LSVLC, width=1)
var London_End_Vline = line.new(x1=na, y1=na, x2=na, xloc=xloc.bar_time, y2=close, color=LSVLC, width=1)
var LondonFill = linefill.new(London_Start_Vline, London_End_Vline, LSFC)
var NY_Start_Vline = line.new(x1=na, y1=na, x2=na, xloc=xloc.bar_time, y2=close, color=NYSVLC, width=1)
var NY_End_Vline = line.new(x1=na, y1=na, x2=na, xloc=xloc.bar_time, y2=close, color=NYSVLC, width=1)
var NYFill = linefill.new(NY_Start_Vline, NY_End_Vline, NYSFC)
var LC_Start_Vline = line.new(x1=na, y1=na, x2=na, xloc=xloc.bar_time, y2=close, color=NYSVLC, width=1)
var LC_End_Vline = line.new(x1=na, y1=na, x2=na, xloc=xloc.bar_time, y2=close, color=NYSVLC, width=1)
var LCFill = linefill.new(LC_Start_Vline, LC_End_Vline, LCSFC)
var PM_Start_Vline = line.new(x1=na, y1=na, x2=na, xloc=xloc.bar_time, y2=close, color=PMSVLC, width=1)
var PM_End_Vline = line.new(x1=na, y1=na, x2=na, xloc=xloc.bar_time, y2=close, color=PMSVLC, width=1)
var PMFill = linefill.new(PM_Start_Vline, PM_End_Vline, PMSFC)
var Asian_Start_Vline = line.new(x1=na, y1=na, x2=na, xloc=xloc.bar_time, y2=close, color=ASVLC, width=1)
var Asian_End_Vline = line.new(x1=na, y1=na, x2=na, xloc=xloc.bar_time, y2=close, color=ASVLC, width=1)
var AsianFill = linefill.new(Asian_Start_Vline, Asian_End_Vline, ASFC)
var Free_Start_Vline = line.new(x1=na, y1=na, x2=na, xloc=xloc.bar_time, y2=close, color=ASVLC, width=1)
var Free_End_Vline = line.new(x1=na, y1=na, x2=na, xloc=xloc.bar_time, y2=close, color=ASVLC, width=1)
var FreeFill = linefill.new(Free_Start_Vline, Free_End_Vline, FSFC)
var Midnight_Open = line.new(x1=na, y1=na, x2=na, xloc=xloc.bar_time, y2=close, color=MOPColor, width=1)
var London_Open = line.new(x1=na, y1=na, x2=na, xloc=xloc.bar_time, y2=close, color=LOPColor, width=1)
var NY_Open = line.new(x1=na, y1=na, x2=na, xloc=xloc.bar_time, y2=close, color=NYOPColor, width=1)
var Equities_Open = line.new(x1=na, y1=na, x2=na, xloc=xloc.bar_time, y2=close, color=EOPColor, width=1)
// When a New Day Starts, Start Drawing all lines
if newDay and dayofweek != dayofweek.sunday
// London Session
if (ShowLondon and DOM)
if ShowTSO
line.delete(London_Start_Vline )
line.delete(London_End_Vline )
linefill.delete(LondonFill )
London_Start_Vline := vline(LondonStartTime,transparentcol, line.style_solid, 1)
London_End_Vline := vline(LondonEndTime, transparentcol, line.style_solid, 1)
if ShowSFill
LondonFill := linefill.new(London_Start_Vline, London_End_Vline, LSFC)
// New York Session
if (ShowNY and DOM)
if ShowTSO
line.delete(NY_Start_Vline )
line.delete(NY_End_Vline )
linefill.delete(NYFill )
NY_Start_Vline := vline(NYStartTime, transparentcol, line.style_solid, 1)
NY_End_Vline := vline(NYEndTime, transparentcol, line.style_solid, 1)
if ShowSFill
NYFill := linefill.new(NY_Start_Vline, NY_End_Vline, NYSFC)
// London Close
if (ShowLC and DOM)
if ShowTSO
line.delete(LC_End_Vline )
linefill.delete(LCFill )
LC_Start_Vline := vline(LCStartTime, transparentcol, line.style_solid, 1)
LC_End_Vline := vline(LCEndTime, transparentcol, line.style_solid, 1)
if ShowSFill
LCFill := linefill.new(LC_Start_Vline, LC_End_Vline, LCSFC)
// PM Session
if (ShowPM and DOM)
if ShowTSO
line.delete(PM_Start_Vline )
line.delete(PM_End_Vline )
linefill.delete(PMFill )
PM_Start_Vline := vline(PMStartTime, transparentcol, line.style_solid, 1)
PM_End_Vline := vline(PMEndTime, transparentcol, line.style_solid, 1)
if ShowSFill
PMFill := linefill.new(PM_Start_Vline, PM_End_Vline, PMSFC)
// Asian Session
if (ShowAsian and DOM)
if ShowTSO
line.delete(Asian_Start_Vline )
line.delete(Asian_End_Vline )
linefill.delete(AsianFill )
Asian_Start_Vline := vline(AsianStartTime, transparentcol, line.style_solid, 1)
Asian_End_Vline := vline(AsianEndTime, transparentcol, line.style_solid, 1)
// if dayofweek == dayofweek.friday
// // line.delete(Asian_Start_Vline)
// // line.delete(Asian_End_Vline)
// Asian_Start_Vline := vline(MidnightOpenTime+244800000, transparentcol, line.style_solid, 1)
// Asian_End_Vline := vline(MidnightOpenTime+259200000, transparentcol, line.style_solid, 1)
if ShowSFill
AsianFill := linefill.new(Asian_Start_Vline, Asian_End_Vline, ASFC)
// Free Session
if (ShowFreeSesh and DOM)
if ShowTSO
line.delete(Free_Start_Vline )
line.delete(Free_End_Vline )
linefill.delete(FreeFill )
Free_Start_Vline := vline(FreeStartTime, transparentcol, line.style_solid, 1)
Free_End_Vline := vline(FreeEndTime, transparentcol, line.style_solid, 1)
if ShowSFill
FreeFill := linefill.new(Free_Start_Vline, Free_End_Vline, FSFC)
// Midnight Opening Price
if (ShowMOP and DOM)
if MOLHist == false
line.delete(Midnight_Open )
Midnight_Open := vline(MidnightOpenTime, MOPColor, MNOPLS, MOPLW)
// London Opening Price
if (ShowLOP and DOM)
if ShowTSO
line.delete(London_Open )
London_Open := vline(LondonOpenTime, LOPColor, LNOPLS, LOPLW)
// New York Opening Price
if (ShowNYOP and DOM)
if ShowTSO
line.delete(NY_Open )
NY_Open := vline(NYOpenTime, NYOPColor, NWYOPLS, NYOPLW)
// Equities Opening Price
if (ShowEOP and DOM)
if ShowTSO
line.delete(Equities_Open )
Equities_Open := vline(EquitiesOpenTime, EOPColor, EQOPLS, EOPLW)
// Variables
var label MOPLB = na
var line MOPLN = na
var label NYOPLB = na
var line NYOPLN = na
var label EOPLB = na
var line EOPLN = na
var line AFTLN = na
var label AFTLB = na
// New York Midnight Open Price line
var openMidnight = 0.0
if tMidnight
if not tMidnight
openMidnight := open
else
openMidnight := math.max(open, openMidnight)
if (ShowMOPP and (openMidnight != openMidnight ) and DOM and barstate.isconfirmed)
label.delete(MOPLB )
if ShowMOPL == false
line.delete(MOPLN )
MOPLN := line.new(x1=tMidnight, y1=openMidnight, x2=tMidnight+86400000, xloc=xloc.bar_time, y2=openMidnight, color=MOPColP, style=MOPLSS, width=MOPPLW)
if dayofweek == dayofweek.friday and syminfo.type != "crypto"
line.set_x2(MOPLN, tMidnight+259200000)
if ShowLabel
MOPLB := label.new(x=tMidnight+86400000, y=openMidnight, xloc=xloc.bar_time, color=LabelColor, textcolor=MOPColP, style=label.style_label_left, size=LabelSize, tooltip="Midnight Opening Price")
if dayofweek == dayofweek.friday and syminfo.type != "crypto"
label.set_x(MOPLB, tMidnight+259200000)
if ShowLabelText
if SFistrue
if ShowPrices == true
label.set_text(MOPLB, " 00:00 | " + str.tostring(open))
else
label.set_text(MOPLB, " 00:00 ")
label.set_tooltip(MOPLB, "Midnight Opening Price")
else
if ShowPrices == true
label.set_text(MOPLB, " Midnight Opening Price | " + str.tostring(open))
else
label.set_text(MOPLB, " Midnight Opening Price ")
label.set_tooltip(MOPLB, "")
label.set_textcolor(MOPLB, LabelTextColor)
label.set_size(MOPLB,LabelSize)
if time > PMEndTime and time < (MidnightOpenTime + 86400000)
line.delete(MOPLN )
if Terminusinp != "Terminus @ Next Midnight" and ShowMOPL == false
line.set_x2(MOPLN, Terminus(Terminusinp))
label.set_x(MOPLB, Terminus(Terminusinp))
// New York Opening Price Line
if (ShowNYOPP and (time == NYOpenTime) and DOM)
label.delete(NYOPLB )
if ShowPrev == false
line.delete(NYOPLN )
NYOPLN := line.new(x1=NYOpenTime, y1=open, x2=NYOpenTime+55800000, xloc=xloc.bar_time, y2=open, color=NYOPColP, style=NYOPLSS, width=NYOPPLW)
if dayofweek == dayofweek.friday and syminfo.type != "crypto"
line.set_x2(NYOPLN, NYOpenTime+228600000)
if ShowLabel
NYOPLB := label.new(x=NYOpenTime+55800000, y=open, xloc=xloc.bar_time, color=LabelColor, textcolor=NYOPColP, style=label.style_label_left, size=LabelSize, tooltip="New York Opening Price")
if dayofweek == dayofweek.friday and syminfo.type != "crypto"
label.set_x(NYOPLB, NYOpenTime+228600000)
if ShowLabelText
if SFistrue
if ShowPrices == true
label.set_text(NYOPLB, " 08:30 | " + str.tostring(open))
else
label.set_text(NYOPLB, " 08:30 ")
label.set_tooltip(NYOPLB, "New York Opening Price")
else
if ShowPrices == true
label.set_text(NYOPLB, " New York Opening Price | " + str.tostring(open))
else
label.set_text(NYOPLB, " New York Opening Price ")
label.set_tooltip(NYOPLB, "")
label.set_textcolor(NYOPLB, LabelTextColor)
label.set_size(NYOPLB,LabelSize)
if Terminusinp != "Terminus @ Next Midnight" and ShowPrev == false
line.set_x2(NYOPLN, Terminus(Terminusinp))
label.set_x(NYOPLB, Terminus(Terminusinp))
// Equities Opening Price Line
if (ShowEOPP and (time == EquitiesOpenTime) and DOM)
label.delete(EOPLB )
if ShowPrev == false
line.delete(EOPLN )
EOPLN := line.new(x1=EquitiesOpenTime, y1=open, x2=EquitiesOpenTime+52200000, xloc=xloc.bar_time, y2=open, color=EOPColP, style=EOPLSS, width=EOPPLW)
if dayofweek == dayofweek.friday and syminfo.type != "crypto"
line.set_x2(EOPLN, EquitiesOpenTime+225000000)
if ShowLabel
EOPLB := label.new(x=EquitiesOpenTime+52200000, y=open, xloc=xloc.bar_time, color=LabelColor, textcolor=EOPColP, style=label.style_label_left, size=LabelSize, tooltip="Equities Opening Price")
if dayofweek == dayofweek.friday and syminfo.type != "crypto"
label.set_x(EOPLB, EquitiesOpenTime+225000000)
if ShowLabelText
if SFistrue
if ShowPrices == true
label.set_text(EOPLB, " 09:30 | " + str.tostring(open))
else
label.set_text(EOPLB, " 09:30 ")
label.set_tooltip(EOPLB, "Equities Opening Price")
else
if ShowPrices == true
label.set_text(EOPLB, " Equities Opening Price | " + str.tostring(open))
else
label.set_text(EOPLB, " Equities Opening Price ")
label.set_tooltip(EOPLB, "")
label.set_textcolor(EOPLB, LabelTextColor)
label.set_size(EOPLB,LabelSize)
if Terminusinp != "Terminus @ Next Midnight" and ShowPrev == false
line.set_x2(EOPLN, Terminus(Terminusinp))
label.set_x(EOPLB, Terminus(Terminusinp))
// Afternoon Opening Price Line
if (ShowAFTPP and (time == AfternoonOpenTime) and DOM)
label.delete(AFTLB )
if ShowPrev == false
line.delete(AFTLN )
AFTLN := line.new(x1=AfternoonOpenTime, y1=open, x2=EquitiesOpenTime+52200000, xloc=xloc.bar_time, y2=open, color=AFTOPColP, style=AFTOPLSS, width=AFTOPLW)
if dayofweek == dayofweek.friday and syminfo.type != "crypto"
line.set_x2(AFTLN, EquitiesOpenTime+225000000)
if ShowLabel
AFTLB := label.new(x=EquitiesOpenTime+52200000, y=open, xloc=xloc.bar_time, color=LabelColor, textcolor=AFTOPColP, style=label.style_label_left, size=LabelSize, tooltip="Equities Opening Price")
if dayofweek == dayofweek.friday and syminfo.type != "crypto"
label.set_x(AFTLB, EquitiesOpenTime+225000000)
if ShowLabelText
if SFistrue
if ShowPrices == true
label.set_text(AFTLB, " 01:30 | " + str.tostring(open))
else
label.set_text(AFTLB, " 01:30 ")
label.set_tooltip(AFTLB, " Afternoon Opening Price")
else
if ShowPrices == true
label.set_text(AFTLB, " Afternoon Opening Price | " + str.tostring(open))
else
label.set_text(AFTLB, " Afternoon Opening Price ")
label.set_tooltip(AFTLB, "")
label.set_textcolor(AFTLB, LabelTextColor)
label.set_size(AFTLB,LabelSize)
if Terminusinp != "Terminus @ Next Midnight" and ShowPrev == false
line.set_x2(AFTLN, Terminus(Terminusinp))
label.set_x(AFTLB, Terminus(Terminusinp))
// HTF Variables
var Weekly_open = line.new(x1=na, y1=na, x2=na, xloc=xloc.bar_time, y2=close, color=i_WeekOpenCol, style=WeekOpenLS, width=1)
var Weekly_openlbl = label.new(x=na, y=na, xloc=xloc.bar_time, color=LabelColor, textcolor=LabelTextColor, style=label.style_label_left, size=LabelSize)
var WeeklyOpenTime = time
var Monthly_open = line.new(x1=na, y1=na, x2=na, xloc=xloc.bar_time, y2=close, color=i_MonthOpenCol, style=MonthOpenLS, width=1)
var Monthly_openlbl = label.new(x=na, y=na, xloc=xloc.bar_time, color=LabelColor, textcolor=LabelTextColor, style=label.style_label_left, size=LabelSize)
var MonthlyOpenTime = time
// Get HTF Price levels
WeeklyOpen = request.security(syminfo.tickerid, "W", open, lookahead = barmerge.lookahead_on)
MonthlyOpen = request.security(syminfo.tickerid, "M", open, lookahead = barmerge.lookahead_on)
// Weekly Open
if newWeek
WeeklyOpenTime := time
if ShowWeekOpen and newDay and Last4Weeks
label.delete(Weekly_openlbl )
line.delete(Weekly_open )
// if ShowPrev == false
// line.delete(Weekly_open )
Weekly_open:= line.new(x1=WeeklyOpenTime-25200000, y1=WeeklyOpen, x2=EquitiesOpenTime+52200000, xloc=xloc.bar_time, y2=WeeklyOpen, color=i_WeekOpenCol, style=WeekOpenLS, width=WEEKOPPLW)
if dayofweek == dayofweek.friday and syminfo.type != "crypto"
line.set_x2(Weekly_open, EquitiesOpenTime+225000000)
if ShowLabel
Weekly_openlbl := label.new(x=EquitiesOpenTime+52200000, y=WeeklyOpen, xloc=xloc.bar_time, color=LabelColor, textcolor=LabelTextColor, style=label.style_label_left, size=LabelSize, tooltip="Weekly Open: " + str.tostring(WeeklyOpen))
if dayofweek == dayofweek.friday and syminfo.type != "crypto"
label.set_x(Weekly_openlbl, EquitiesOpenTime+225000000)
if ShowLabelText
if SFistrue
if ShowPrices == true
label.set_text(Weekly_openlbl," W.O. | " + str.tostring(WeeklyOpen))
else
label.set_text(Weekly_openlbl," W.O. ")
label.set_tooltip(Weekly_openlbl, " Weekly Opening Price ")
else
if ShowPrices == true
label.set_text(Weekly_openlbl," Weekly Open | " + str.tostring(WeeklyOpen))
else
label.set_text(Weekly_openlbl," Weekly Open ")
label.set_tooltip(Weekly_openlbl, "")
label.set_textcolor(Weekly_openlbl, LabelTextColor)
label.set_size(Weekly_openlbl, LabelSize)
if timeframe.multiplier > 60
line.set_x2(Weekly_open, AsianEndTime + 232000000)
label.set_x(Weekly_openlbl, AsianEndTime + 232000000)
if timeframe.period == "D"
line.set_x2(Weekly_open, AsianEndTime + 832000000)
label.set_x(Weekly_openlbl, AsianEndTime + 832000000)
if timeframe.period == "M"
line.delete(Weekly_open)
label.delete(Weekly_openlbl)
if Terminusinp != "Terminus @ Next Midnight" and DOM
line.set_x2(Weekly_open, Terminus(Terminusinp))
label.set_x(Weekly_openlbl, Terminus(Terminusinp))
// Monthly Open
if newMonth
MonthlyOpenTime := time
if showMonthOpen and newDay
line.delete(Monthly_open )
label.delete(Monthly_openlbl )
Monthly_open:= line.new(x1=MonthlyOpenTime, y1=MonthlyOpen, x2=AsianEndTime, xloc=xloc.bar_time, y2=MonthlyOpen, color=i_MonthOpenCol, style=MonthOpenLS, width=MONTHOPPLW)
if dayofweek == dayofweek.friday and syminfo.type != "crypto"
line.set_x2(Monthly_open, EquitiesOpenTime+225000000)
if ShowLabel
Monthly_openlbl := label.new(x=AsianEndTime, y=MonthlyOpen, xloc=xloc.bar_time, color=LabelColor, textcolor=LabelTextColor, style=label.style_label_left, size=LabelSize, tooltip="Monthly Open: " + str.tostring(MonthlyOpen))
if dayofweek == dayofweek.friday and syminfo.type != "crypto"
label.set_x(Monthly_openlbl, EquitiesOpenTime+225000000)
if ShowLabelText
if SFistrue
if ShowPrices == true
label.set_text(Monthly_openlbl," M.O. | " + str.tostring(MonthlyOpen))
else
label.set_text(Monthly_openlbl," M.O. ")
label.set_tooltip(Monthly_openlbl, " Monthly Opening Price ")
else
if ShowPrices == true
label.set_text(Monthly_openlbl, " Monthly Open | " + str.tostring(MonthlyOpen))
else
label.set_text(Monthly_openlbl, " Monthly Open ")
label.set_tooltip(Monthly_openlbl, "")
label.set_textcolor(Monthly_openlbl, LabelTextColor)
label.set_size(Monthly_openlbl, LabelSize)
if timeframe.multiplier > 60
line.set_x2(Monthly_open, AsianEndTime + 232000000)
label.set_x(Monthly_openlbl, AsianEndTime + 232000000)
if timeframe.period == "D"
line.set_x2(Monthly_open, AsianEndTime + 832000000)
label.set_x(Monthly_openlbl, AsianEndTime + 832000000)
if timeframe.period == "W"
line.set_x2(Monthly_open, AsianEndTime + 2592000000)
label.set_x(Monthly_openlbl, AsianEndTime + 2592000000)
if timeframe.period == "M"
line.delete(Monthly_open)
label.delete(Monthly_openlbl)
if Terminusinp != "Terminus @ Next Midnight" and DOM
line.set_x2(Monthly_open, Terminus(Terminusinp))
label.set_x(Monthly_openlbl, Terminus(Terminusinp))
// CBDR Stuff
var float cbdr_hi = na
var float cbdr_lo = na
var float cbdr_diff = na
var box cbdrbox = na
var line cbdr_hi_line = na
var line cbdr_lo_line = na
var line dev01negline = na
var line dev02negline = na
var line dev03negline = na
var line dev04negline = na
var line dev01posline = na
var line dev02posline = na
var line dev03posline = na
var line dev04posline = na
if SessionBegins(CBDR) and DOM
cbdr_hi := high
cbdr_lo := low
cbdr_diff := cbdr_hi - cbdr_lo
if ShowTSO
box.delete(cbdrbox )
line.delete(dev01posline )
line.delete(dev01negline )
line.delete(dev02posline )
line.delete(dev02negline )
line.delete(dev03posline )
line.delete(dev03negline )
line.delete(dev04posline )
line.delete(dev04negline )
if ShowCBDR
cbdrbox := box.new(cbdrOpenTime, cbdr_hi, cbdrEndTime, cbdr_lo, color.new(CBDRBoxCol,90), 1, line.style_solid, extend.none, xloc.bar_time, color.new(CBDRBoxCol,90), txt0, size.auto, color.new(box_text_cbdr_col,80), text_wrap=text.wrap_auto)
if dayofweek == dayofweek.friday
box.set_right(cbdrbox, cbdrOpenTime+187200000)
line.set_x2(cbdr_hi_line, cbdrOpenTime+187200000)
line.set_x2(cbdr_lo_line, cbdrOpenTime+187200000)
if box_text_cbdr == false
box.set_text(cbdrbox, "")
if ShowDev and ShowCBDR and bool_cbdr_dev
for i = 1 to DevCount by 1
if i == 1
dev01posline := line.new(cbdrOpenTime, cbdr_hi + cbdr_diff * i, cbdrEndTime, cbdr_hi + cbdr_diff * i, xloc=xloc.bar_time, color=DevLNCol, style=DEVLSS, width=DEVLW)
dev01negline := line.new(cbdrOpenTime, cbdr_hi - cbdr_diff * i, cbdrEndTime, cbdr_lo - cbdr_diff * i, xloc=xloc.bar_time, color=DevLNCol, style=DEVLSS, width=DEVLW)
if dayofweek == dayofweek.friday
line.set_x2(dev01posline, cbdrOpenTime+187200000)
line.set_x2(dev01negline, cbdrOpenTime+187200000)
if i == 2
dev02posline := line.new(cbdrOpenTime, cbdr_hi + cbdr_diff * i, cbdrEndTime, cbdr_lo + cbdr_diff * i, xloc=xloc.bar_time, color=DevLNCol, style=DEVLSS, width=DEVLW)
dev02negline := line.new(cbdrOpenTime, cbdr_hi - cbdr_diff * i, cbdrEndTime, cbdr_lo - cbdr_diff * i, xloc=xloc.bar_time, color=DevLNCol, style=DEVLSS, width=DEVLW)
if dayofweek == dayofweek.friday
line.set_x2(dev02posline, cbdrOpenTime+187200000)
line.set_x2(dev02negline, cbdrOpenTime+187200000)
if i == 3
dev03posline := line.new(cbdrOpenTime, cbdr_hi + cbdr_diff * i, cbdrEndTime, cbdr_lo + cbdr_diff * i, xloc=xloc.bar_time, color=DevLNCol, style=DEVLSS, width=DEVLW)
dev03negline := line.new(cbdrOpenTime, cbdr_hi - cbdr_diff * i, cbdrEndTime, cbdr_lo - cbdr_diff * i, xloc=xloc.bar_time, color=DevLNCol, style=DEVLSS, width=DEVLW)
if dayofweek == dayofweek.friday
line.set_x2(dev03posline, cbdrOpenTime+187200000)
line.set_x2(dev03negline, cbdrOpenTime+187200000)
if i == 4
dev04posline := line.new(cbdrOpenTime, cbdr_hi + cbdr_diff * i, cbdrEndTime, cbdr_lo + cbdr_diff * i, xloc=xloc.bar_time, color=DevLNCol, style=DEVLSS, width=DEVLW)
dev04negline := line.new(cbdrOpenTime, cbdr_hi - cbdr_diff * i, cbdrEndTime, cbdr_lo - cbdr_diff * i, xloc=xloc.bar_time, color=DevLNCol, style=DEVLSS, width=DEVLW)
if dayofweek == dayofweek.friday
line.set_x2(dev04posline, cbdrOpenTime+187200000)
line.set_x2(dev04negline, cbdrOpenTime+187200000)
else if CBDRTime
cbdr_hi := math.max(high, cbdr_hi)
cbdr_lo := math.min(low, cbdr_lo)
cbdr_diff := cbdr_hi - cbdr_lo
for i = 1 to DevCount by 1
if i == 1 and ShowDev
line.set_y1(dev01posline, cbdr_hi + cbdr_diff * i)
line.set_y2(dev01posline, cbdr_hi + cbdr_diff * i)
line.set_y1(dev01negline, cbdr_lo - cbdr_diff * i)
line.set_y2(dev01negline, cbdr_lo - cbdr_diff * i)
if i == 2 and ShowDev
line.set_y1(dev02posline, cbdr_hi + cbdr_diff * i)
line.set_y2(dev02posline, cbdr_hi + cbdr_diff * i)
line.set_y1(dev02negline, cbdr_lo - cbdr_diff * i)
line.set_y2(dev02negline, cbdr_lo - cbdr_diff * i)
if i == 3 and ShowDev
line.set_y1(dev03posline, cbdr_hi + cbdr_diff * i)
line.set_y2(dev03posline, cbdr_hi + cbdr_diff * i)
line.set_y1(dev03negline, cbdr_lo - cbdr_diff * i)
line.set_y2(dev03negline, cbdr_lo - cbdr_diff * i)
if i == 4 and ShowDev
line.set_y1(dev04posline, cbdr_hi + cbdr_diff * i)
line.set_y2(dev04posline, cbdr_hi + cbdr_diff * i)
line.set_y1(dev04negline, cbdr_lo - cbdr_diff * i)
line.set_y2(dev04negline, cbdr_lo - cbdr_diff * i)
if (cbdr_hi > cbdr_hi )
if ShowCBDR
box.set_top(cbdrbox, cbdr_hi)
if (cbdr_lo < cbdr_lo )
if ShowCBDR
box.set_bottom(cbdrbox, cbdr_lo)
if DevDirection == "Upside Only"
line.delete(dev01negline)
line.delete(dev02negline)
line.delete(dev03negline)
line.delete(dev04negline)
else if DevDirection == "Downside Only"
line.delete(dev01posline)
line.delete(dev02posline)
line.delete(dev03posline)
line.delete(dev04posline)
// ASIA Stuff
var float asia_hi = na
var float asia_lo = na
var float asia_diff = na
var box asia_box = na
var line asia_hi_line = na
var line asia_lo_line = na
var line dev01negline_asia = na
var line dev02negline_asia = na
var line dev03negline_asia = na
var line dev04negline_asia = na
var line dev01posline_asia = na
var line dev02posline_asia = na
var line dev03posline_asia = na
var line dev04posline_asia = na
if SessionBegins(ASIA) and DOM
asia_hi := high
asia_lo := low
asia_diff := asia_hi - asia_lo
if ShowTSO
box.delete(asia_box )
line.delete(dev01posline_asia )
line.delete(dev01negline_asia )
line.delete(dev02posline_asia )
line.delete(dev02negline_asia )
line.delete(dev03posline_asia )
line.delete(dev03negline_asia )
line.delete(dev04posline_asia )
line.delete(dev04negline_asia )
if ShowASIA
asia_box := box.new(asiaOpenTime, asia_hi, asiaEndTime, asia_lo, color.new(ASIABoxCol,90), 1, line.style_solid, extend.none, xloc.bar_time, color.new(ASIABoxCol,90), txt1, size.auto, color.new(box_text_asia_col,80), text_wrap=text.wrap_auto)
if box_text_asia == false
box.set_text(asia_box, "")
if ShowDev and ShowASIA and bool_asia_dev
for i = 1 to DevCount by 1
if i == 1
dev01posline_asia := line.new(asiaOpenTime, asia_hi + asia_diff * i, asiaEndTime, asia_hi + asia_diff * i, xloc=xloc.bar_time, color=DevLNCol, style=DEVLSS, width=DEVLW)
dev01negline_asia := line.new(asiaOpenTime, asia_hi - asia_diff * i, asiaEndTime, asia_lo - asia_diff * i, xloc=xloc.bar_time, color=DevLNCol, style=DEVLSS, width=DEVLW)
if i == 2
dev02posline_asia := line.new(asiaOpenTime, asia_hi + asia_diff * i, asiaEndTime, asia_lo + asia_diff * i, xloc=xloc.bar_time, color=DevLNCol, style=DEVLSS, width=DEVLW)
dev02negline_asia := line.new(asiaOpenTime, asia_hi - asia_diff * i, asiaEndTime, asia_lo - asia_diff * i, xloc=xloc.bar_time, color=DevLNCol, style=DEVLSS, width=DEVLW)
if i == 3
dev03posline_asia := line.new(asiaOpenTime, asia_hi + asia_diff * i, asiaEndTime, asia_lo + asia_diff * i, xloc=xloc.bar_time, color=DevLNCol, style=DEVLSS, width=DEVLW)
dev03negline_asia := line.new(asiaOpenTime, asia_hi - asia_diff * i, asiaEndTime, asia_lo - asia_diff * i, xloc=xloc.bar_time, color=DevLNCol, style=DEVLSS, width=DEVLW)
if i == 4
dev04posline_asia := line.new(asiaOpenTime, asia_hi + asia_diff * i, asiaEndTime, asia_lo + asia_diff * i, xloc=xloc.bar_time, color=DevLNCol, style=DEVLSS, width=DEVLW)
dev04negline_asia := line.new(asiaOpenTime, asia_hi - asia_diff * i, asiaEndTime, asia_lo - asia_diff * i, xloc=xloc.bar_time, color=DevLNCol, style=DEVLSS, width=DEVLW)
else if ASIATime
asia_hi := math.max(high, asia_hi)
asia_lo := math.min(low, asia_lo)
asia_diff := asia_hi - asia_lo
for i = 1 to DevCount by 1
if i == 1 and ShowDev
line.set_y1(dev01posline_asia, asia_hi + asia_diff * i)
line.set_y2(dev01posline_asia, asia_hi + asia_diff * i)
line.set_y1(dev01negline_asia, asia_lo - asia_diff * i)
line.set_y2(dev01negline_asia, asia_lo - asia_diff * i)
if i == 2 and ShowDev
line.set_y1(dev02posline_asia, asia_hi + asia_diff * i)
line.set_y2(dev02posline_asia, asia_hi + asia_diff * i)
line.set_y1(dev02negline_asia, asia_lo - asia_diff * i)
line.set_y2(dev02negline_asia, asia_lo - asia_diff * i)
if i == 3 and ShowDev
line.set_y1(dev03posline_asia, asia_hi + asia_diff * i)
line.set_y2(dev03posline_asia, asia_hi + asia_diff * i)
line.set_y1(dev03negline_asia, asia_lo - asia_diff * i)
line.set_y2(dev03negline_asia, asia_lo - asia_diff * i)
if i == 4 and ShowDev
line.set_y1(dev04posline_asia, asia_hi + asia_diff * i)
line.set_y2(dev04posline_asia, asia_hi + asia_diff * i)
line.set_y1(dev04negline_asia, asia_lo - asia_diff * i)
line.set_y2(dev04negline_asia, asia_lo - asia_diff * i)
if (asia_hi > asia_hi )
box.set_top(asia_box, asia_hi)
if (asia_lo < asia_lo )
box.set_bottom(asia_box, asia_lo)
if DevDirection == "Upside Only"
line.delete(dev01negline_asia)
line.delete(dev02negline_asia)
line.delete(dev03negline_asia)
line.delete(dev04negline_asia)
else if DevDirection == "Downside Only"
line.delete(dev01posline_asia)
line.delete(dev02posline_asia)
line.delete(dev03posline_asia)
line.delete(dev04posline_asia)
// FLOUT Stuff
var float flout_hi = na
var float flout_lo = na
var float flout_diff = na
var box floutbox = na
var line flout_hi_line = na
var line flout_lo_line = na
var line dev01negline_flout = na
var line dev02negline_flout = na
var line dev03negline_flout = na
var line dev04negline_flout = na
var line dev01posline_flout = na
var line dev02posline_flout = na
var line dev03posline_flout = na
var line dev04posline_flout = na
if SessionBegins(FLOUT) and DOM
flout_hi := high
flout_lo := low
flout_diff := flout_hi - flout_lo
if ShowTSO
box.delete(floutbox )
line.delete(dev01posline_flout )
line.delete(dev01negline_flout )
line.delete(dev02posline_flout )
line.delete(dev02negline_flout )
line.delete(dev03posline_flout )
line.delete(dev03negline_flout )
line.delete(dev04posline_flout )
line.delete(dev04negline_flout )
if ShowFLOUT
floutbox := box.new(floutOpenTime, flout_hi, floutEndTime, flout_lo, color.new(FLOUTBoxCol,90), 1, line.style_solid, extend.none, xloc.bar_time, color.new(FLOUTBoxCol,90), txt7, size.auto, color.new(box_text_flout_col,80), text_wrap=text.wrap_auto)
if dayofweek == dayofweek.friday
box.set_right(floutbox, floutOpenTime+201600000)
line.set_x2(flout_hi_line, floutOpenTime+201600000)
line.set_x2(flout_lo_line, floutOpenTime+201600000)
if box_text_cbdr == false
box.set_text(floutbox, "")
if ShowDev and ShowFLOUT and bool_flout_dev
for i = 0.5 to DevCount by 0.5
if i == 0.5
dev01posline_flout := line.new(floutOpenTime, flout_hi + flout_diff * i, floutEndTime, flout_hi + flout_diff * i, xloc=xloc.bar_time, color=DevLNCol, style=DEVLSS, width=DEVLW)
dev01negline_flout := line.new(floutOpenTime, flout_hi - flout_diff * i, floutEndTime, flout_lo - flout_diff * i, xloc=xloc.bar_time, color=DevLNCol, style=DEVLSS, width=DEVLW)
if dayofweek == dayofweek.friday
line.set_x2(dev01posline_flout, floutOpenTime+201600000)
line.set_x2(dev01negline_flout, floutOpenTime+201600000)
if i == 1
dev02posline_flout := line.new(floutOpenTime, flout_hi + flout_diff * i, floutEndTime, flout_lo + flout_diff * i, xloc=xloc.bar_time, color=DevLNCol, style=DEVLSS, width=DEVLW)
dev02negline_flout := line.new(floutOpenTime, flout_hi - flout_diff * i, floutEndTime, flout_lo - flout_diff * i, xloc=xloc.bar_time, color=DevLNCol, style=DEVLSS, width=DEVLW)
if dayofweek == dayofweek.friday
line.set_x2(dev02posline_flout, floutOpenTime+201600000)
line.set_x2(dev02negline_flout, floutOpenTime+201600000)
if i == 1.5
dev03posline_flout := line.new(floutOpenTime, flout_hi + flout_diff * i, floutEndTime, flout_lo + flout_diff * i, xloc=xloc.bar_time, color=DevLNCol, style=DEVLSS, width=DEVLW)
dev03negline_flout := line.new(floutOpenTime, flout_hi - flout_diff * i, floutEndTime, flout_lo - flout_diff * i, xloc=xloc.bar_time, color=DevLNCol, style=DEVLSS, width=DEVLW)
if dayofweek == dayofweek.friday
line.set_x2(dev03posline_flout, floutOpenTime+201600000)
line.set_x2(dev03negline_flout, floutOpenTime+201600000)
if i == 2
dev04posline_flout := line.new(floutOpenTime, flout_hi + flout_diff * i, floutEndTime, flout_lo + flout_diff * i, xloc=xloc.bar_time, color=DevLNCol, style=DEVLSS, width=DEVLW)
dev04negline_flout := line.new(floutOpenTime, flout_hi - flout_diff * i, floutEndTime, flout_lo - flout_diff * i, xloc=xloc.bar_time, color=DevLNCol, style=DEVLSS, width=DEVLW)
if dayofweek == dayofweek.friday
line.set_x2(dev04posline_flout, floutOpenTime+201600000)
line.set_x2(dev04negline_flout, floutOpenTime+201600000)
else if FLOUTTime
flout_hi := math.max(high, flout_hi)
flout_lo := math.min(low, flout_lo)
flout_diff := flout_hi - flout_lo
for i = 0.5 to DevCount by 0.5
if i == 0.5 and ShowDev
line.set_y1(dev01posline_flout, flout_hi + flout_diff * i)
line.set_y2(dev01posline_flout, flout_hi + flout_diff * i)
line.set_y1(dev01negline_flout, flout_lo - flout_diff * i)
line.set_y2(dev01negline_flout, flout_lo - flout_diff * i)
if i == 1 and ShowDev
line.set_y1(dev02posline_flout, flout_hi + flout_diff * i)
line.set_y2(

Pump/Dump Detector [Modular]//@version=5
indicator("Pump/Dump Detector ", overlay=true)
// ————— Inputs —————
risk_pct = input.float(1.0, "Risk %", minval=0.1)
capital = input.float(100000, "Capital")
stop_multiplier = input.float(1.5, "Stop Multiplier")
target_multiplier = input.float(2.0, "Target Multiplier")
volume_mult = input.float(2.0, "Volume Spike Multiplier")
rsi_low_thresh = input.int(15, "RSI Oversold Threshold")
rsi_high_thresh = input.int(85, "RSI Overbought Threshold")
rsi_len = input.int(2, "RSI Length")
bb_len = input.int(20, "BB Length")
bb_mult = input.float(2.0, "BB Multiplier")
atr_len = input.int(14, "ATR Length")
show_signals = input.bool(true, "Show Entry Signals")
use_orderflow = input.bool(true, "Use Order Flow Proxy")
use_ml_flag = input.bool(false, "Use ML Risk Flag")
use_session_filter = input.bool(true, "Use Volatility Sessions")
// ————— Symbol Filter (Optional) —————
symbol_nq = input.bool(true, "Enable NQ")
symbol_es = input.bool(true, "Enable ES")
symbol_gold = input.bool(true, "Enable Gold")
is_nq = str.contains(syminfo.ticker, "NQ")
is_es = str.contains(syminfo.ticker, "ES")
is_gold = str.contains(syminfo.ticker, "GC")
symbol_filter = (symbol_nq and is_nq) or (symbol_es and is_es) or (symbol_gold and is_gold)
// ————— Calculations —————
rsi = ta.rsi(close, rsi_len)
atr = ta.atr(atr_len)
basis = ta.sma(close, bb_len)
dev = bb_mult * ta.stdev(close, bb_len)
bb_upper = basis + dev
bb_lower = basis - dev
rolling_vol = ta.sma(volume, 20)
vol_spike = volume > volume_mult * rolling_vol
// ————— Session Filter (EST) —————
est_offset = -5
est_hour = (hour + est_offset + 24) % 24
session_filter = (est_hour >= 18 or est_hour < 6) or (est_hour >= 14 and est_hour < 17)
session_ok = not use_session_filter or session_filter
// ————— Order Flow Proxy —————
mfi = ta.mfi(close, 14)
buy_imbalance = ta.crossover(mfi, 50)
sell_imbalance = ta.crossunder(mfi, 50)
reversal_candle = close > open and close > ta.highest(close , 3)
// ————— ML Risk Flag (Placeholder) —————
ml_risk_flag = use_ml_flag and (ta.sma(close, 5) > ta.sma(close, 20))
// ————— Entry Conditions —————
long_cond = symbol_filter and session_ok and vol_spike and rsi < rsi_low_thresh and close < bb_lower and (not use_orderflow or (buy_imbalance and reversal_candle)) and (not use_ml_flag or ml_risk_flag)
short_cond = symbol_filter and session_ok and vol_spike and rsi > rsi_high_thresh and (not use_orderflow or sell_imbalance) and (not use_ml_flag or ml_risk_flag)
// ————— Position Sizing —————
risk_amt = capital * (risk_pct / 100)
position_size = risk_amt / atr
// ————— Plot Signals —————
plotshape(show_signals and long_cond, title="Long Signal", location=location.belowbar, color=color.green, style=shape.triangleup, size=size.small)
plotshape(show_signals and short_cond, title="Short Signal", location=location.abovebar, color=color.red, style=shape.triangledown, size=size.small)
// ————— Alerts —————
alertcondition(long_cond, title="Long Entry Alert", message="Pump fade detected: Long setup triggered")
alertcondition(short_cond, title="Short Entry Alert", message="Dump detected: Short setup triggered")

KAMA Trend Flip with Snap & Follow - SightLing Labs🔭 OVERVIEW
KAMA Snap Follow is a customized adaptation of the Kaufman Adaptive Moving Average (KAMA) that overlays a trend-tracking line on the chart. It computes an adaptive smoothing constant from the efficiency ratio, then incorporates conditional enhancements: a "snap" mechanism to boost responsiveness on significant counter-trend bars surpassing an ATR-based threshold, and a temporary "follow" mode after trend flips to intensify adaptation for a user-defined number of bars. This allows the line to hug price more closely during early reversal phases before returning to standard smoothing for noise filtration. The line colors green for upward trends (rising KAMA), red for downward (falling KAMA), and gray for neutral, with optional alerts on trend changes. If the structure invalidates (e.g., via excessive lag or unconfirmed flips), no automatic cleanup occurs—users manage via settings tweaks and backtesting.
🔭 CONCEPTS
* Adaptive smoothing core: Builds on KAMA's efficiency ratio to dynamically adjust between fast and slow constants, gliding over minor volatility while aiming to react to directional shifts.
* Snap trigger: Detects potential reversals via large bar changes opposing the prior trend, exceeding a multiplier of ATR; this temporarily amplifies the smoothing constant (capped at 1.0) to pull KAMA toward price.
* Follow mode activation: Post-flip, engages a boosted adaptation phase for a fixed bar count, forcing tighter shadowing in the new direction to reduce lag on true turns, then reverts to absorber mode.
* Trend detection: Simple comparison of current vs. prior KAMA values defines up/down/neutral, with no embedded signals—purely for visual trend context.
* Risk-aware design: No guarantees; focuses on lag reduction in simulations (e.g., 38-54% trough lag cuts on synthetic volatile series), but real-market performance varies—backtest thoroughly.
🔭 FEATURES
* Custom KAMA calculation with manual efficiency ratio and smoothing powers for baseline adaptation.
* ATR-integrated snap for reversal sensitivity, with adjustable multiplier and boost.
* Post-flip follow mode with configurable period and boost to enhance new-trend hugging.
* Trend coloring and flip alerts: Green/red/gray line with conditions for up/down/neutral; alerts on changes.
* User controls:
Source (e.g., close).
Efficiency Ratio Length (pivot-like sensitivity).
Fast/Slow Powers (adaptation speed).
ATR Length (volatility measure).
Snap Multiplier/Boost (reversal threshold/amplification).
Follow Period/Boost (post-flip duration/intensity).
* Efficient execution: Lightweight, no heavy buffers—suitable for intraday charts via backtested tweaks.
🔭 HOW TO USE
* Tune sensitivity: Shorten Efficiency Ratio Length on lower timeframes for quicker reactions; lengthen on higher for smoother trends. Test ATR Length against asset volatility.
* Monitor flips: Use green/red shifts as trend context—combine with your strategy (e.g., crossovers, support/resistance) for potential entries; alerts notify changes.
* Leverage modes: Snap helps catch sharp turns; follow mode tightens tracking post-reversal—observe on historical data to gauge lag reduction (e.g., 30-57% miss cuts on 0.20 moves in tests).
* Apply MTF: Spot broader trends on 5m; refine on 30s/1m near flips. Backtest configurations to avoid over-optimization.
* Integrate confluence: Pair with volume, RSI, or your filters; never rely solely—markets evolve, so validate via simulations and live observation.
🔭 CONCLUSION
KAMA Snap Follow evolves standard KAMA by adding snap and follow mechanics to combat reversal lag while filtering bumps, offering a visual tool for trend analysis in volatile intraday setups. Developed to address traditional adaptive averages' delays without introducing excessive whipsaw (e.g., zero added in noisy flats per tests), it provides adjustable parameters for customization. No performance promises—results hinge on backtesting and market fit; use as a framework for scenario evaluation, not automated trading.
Example Configurations (derived from synthetic tests on SOFI-like intraday volatility; backtest and adjust):
- For 30s charts (high noise, rapid shifts): Efficiency Ratio Length=20, Fast Power=1, Slow Power=15, ATR Length=10, Snap Multiplier=1.2, Snap Boost=2.0, Follow Period=5, Follow Boost=2.5—yields ~40% lag reduction on turns, filtering 85% of <0.01 fluctuations.
- For 1m charts (moderate volatility): Efficiency Ratio Length=30, Fast Power=2, Slow Power=20, ATR Length=14, Snap Multiplier=1.5, Snap Boost=2.5, Follow Period=8, Follow Boost=3.0—achieves ~30% lower reversal misses (e.g., 0.08 vs. 0.12 on 0.20 swings), stable in 50-bar chops.
- For 5m charts (trendier flows): Efficiency Ratio Length=50, Fast Power=3, Slow Power=40, ATR Length=20, Snap Multiplier=1.8, Snap Boost=3.0, Follow Period=12, Follow Boost=3.5—boosts post-flip hug by 25%, ignoring 90% of ±0.05 noise across 100 bars.

🏆 AI Gold Master IndicatorsAI Gold Master Indicators - Technical Overview
Core Purpose: Advanced Pine Script indicator that analyzes 20 technical indicators simultaneously for XAUUSD (Gold) trading, generating automated buy/sell signals through a sophisticated scoring system.
Key Features
📊 Multi-Indicator Analysis
Processes 20 indicators: RSI, MACD, Bollinger Bands, EMA crossovers, Stochastic, Williams %R, CCI, ATR, Volume, ADX, Parabolic SAR, Ichimoku, MFI, ROC, Fibonacci retracements, Support/Resistance, Candlestick patterns, MA Ribbon, VWAP, Market Structure, and Cloud MA
Each indicator generates BUY (🟢), SELL (🔴), or NEUTRAL (⚪) signals
⚖️ Dual Scoring Systems
Weighted System: Each indicator has configurable weights (10-200 points, total 1000), with higher weights for critical indicators like RSI (150) and MACD (150)
Simple Count System: Basic counting of BUY vs SELL signals across all indicators
🎯 Signal Generation
Configurable thresholds for both systems (weighted score threshold: 400-600 recommended)
Dynamic risk management with ATR-based TP/SL levels
Signal strength filtering to reduce false positives
📈 Advanced Configuration
Customizable thresholds for all 20 indicators (RSI levels, Stochastic bounds, Williams %R zones, etc.)
Dynamic weight bonuses that adapt to dominant market trends
Risk management with configurable TP1/TP2 multipliers and stop losses
🎛️ Visual Interface
Real-time master table displaying all indicators, their values, weights, and current signals
Visual trading signals (triangles) with detailed labels
Optional TP/SL lines and performance statistics
💡 Optimization Features
Gold-specific parameter tuning
Trend analysis with configurable lookback periods
Volume spike detection and volatility analysis
Multi-timeframe compatibility (15m, 1H, 4H recommended)
The system combines traditional technical analysis with modern weighting algorithms to provide comprehensive market analysis specifically optimized for gold trading.
Ragazzi è una meraviglia, pronto all uso, già configurato provatelo divertitevi e fate tanti soldoni poi magari una piccola donazione spontanea sarebbe molto gradita visto il tempo, risorse e gli insulti della moglie che mi diceva che perdevo tempo, fatemi sapere se vi piace.
nel codice troverete una descrizione del funzionamento se vi vengono in mente delle idee per migliorarlo contattatemi troverete i mie contatti in tabella un saluto.

VXN RSI VWAP basedThis indicator is based on other open source scripts. It's designed for trading Nasdaq futures (NQ and MNQ). It generates trading signals based on the Relative Strength Index (RSI) calculated from multiple VWAP-based price series with different lengths. The VXN index (CBOE Nasdaq Volatility Index) is used to filter signals via background color.
- RSI Signals: Bullish signals occur when any RSI crosses above the 20 level (oversold), and bearish signals occur when any RSI crosses below the 80 level (overbought). These are plotted as green/red circles.
- VXN Filter: Traders should only take bullish signals (RSI > 20) when the background is green (VXN 1-period EMA < 200-period SMA, indicating bullish sentiment) and bearish signals (RSI < 80) when the background is red (VXN 1-period EMA > 200-period SMA, indicating bearish sentiment).
- Additional Signals: Optional signals are generated when all RSI lines are simultaneously bullish (green) or bearish (red), plotted as triangles if enabled.
Usage: Apply this indicator to a Nasdaq futures chart (NQ or MNQ) in TradingView. Wait for RSI crossovers above 20 when the background is green for long trades, and crossunders below 80 when the background is red for short trades. Adjust VWAP lengths, RSI length, and VXN settings to suit your trading strategy.

Asistente de Barra de Estado ADX
// This is an all-in-one indicator designed to visually represent the market environment
// based on the G2 (trend-following) and SMOG (reversal/ranging) trading systems.
// It replaces the need for a separate ADX indicator.
//
// FEATURES:
//
// 1. Multi-Timeframe ADX:
// - 5-Minute ADX (Blue Line - The "Referee"): Determines the overall market environment (Trending or Ranging).
// - 1-Minute ADX (Yellow Line - The "Trigger"): Measures immediate momentum for trade entries.
//
// 2. Environment Background Coloring:
// The indicator's own background panel changes color to provide an instant signal:
// - Green: G2 Bullish Environment (5-min ADX > 25 & Price is Trending Up)
// - Red: G2 Bearish Environment (5-min ADX > 25 & Price is Trending Down)
// - Gray: Gray Zone (Indecisive/Risky Market, 5-min ADX between 20-25)
// - Blue: SMOG Environment (Weak/Ranging Market, 5-min ADX < 20)
//
// 3. Reference Lines:
// Includes horizontal lines at the key 20 and 25 levels for easy reference.
//
// HOW TO USE:
// Use this indicator as the primary tool to decide whether to look for a G2
// (trend-following) or a SMOG (reversal) setup.
//

EMA Range OscillatorEMA Range Oscillator (ERO) - User Guide
Overview
The EMA Range Oscillator (ERO) is a technical indicator that measures the distance between two Exponential Moving Averages (EMAs) and the distance between price and EMA. It normalizes these distances into a 0-100 range, helping traders identify trend strength, market momentum, and potential reversal points.
Components
Main Line
Green Line: EMA20 > EMA50 (Uptrend)
Red Line: EMA20 < EMA50 (Downtrend)
Histogram
White Histogram: Price distance from EMA20
Key Levels
Upper Level (80): High divergence zone
Middle Level (50): Neutral zone
Lower Level (20): Low divergence zone
Parameters
ParameterDefaultDescriptionFast EMA20Short-term EMA periodSlow EMA50Long-term EMA periodNormalization Period100Lookback period for scalingUpper80Upper threshold levelLower20Lower threshold level
How to Read the Indicator
High Values (Above 80)
Strong trend in progress
EMAs are widely separated
High momentum
Potential overbought/oversold conditions
Watch for possible trend exhaustion
Low Values (Below 20)
Consolidation phase
EMAs are close together
Low volatility
Potential breakout setup
Range-bound market conditions
Middle Zone (20-80)
Normal market conditions
Moderate trend strength
Balanced momentum
Look for directional clues from color changes

Trend Display Table (with Change Alerts)📌 Indicator: Trend Display Table (with Change Alerts)
This indicator helps identify trend direction based on a 15-minute 20 SMA compared against a 10 EMA applied to that SMA.
Trend Logic:
Bullish → 20 SMA crosses above 10 EMA (on SMA values)
Bearish → 20 SMA crosses below 10 EMA (on SMA values)
Neutral → No crossover (trend continues from previous state)
Display:
A compact trend table appears on the chart (top-right), showing the current trend with customizable colors, font size, and background.
Alerts:
Alerts are triggered only when the trend changes (from Bullish → Bearish or Bearish → Bullish).
This prevents repeated alerts on every bar.
✅ Useful for:
Confirming higher timeframe trend bias
Filtering trades in choppy markets
Getting notified instantly when the trend flips

DYNAMIC TRADING DASHBOARDStudy Material for the "Dynamic Trading Dashboard"
This Dynamic Trading Dashboard is designed as an educational tool within the TradingView environment. It compiles commonly used market indicators and analytical methods into one visual interface so that traders and learners can see relationships between indicators and price action. Understanding these indicators, step by step, can help traders develop discipline, improve technical analysis skills, and build strategies. Below is a detailed explanation of each module.
________________________________________
1. Price and Daily Reference Points
The dashboard displays the current price, along with percentage change compared to the day’s opening price. It also highlights whether the price is moving upward or downward using directional symbols. Alongside, it tracks daily high, low, open, and daily range.
For traders, daily levels provide valuable reference points. The daily high and low are considered intraday support and resistance, while the median price of the day often acts as a pivot level for mean reversion traders. Monitoring these helps learners see how price oscillates within daily ranges.
________________________________________
2. VWAP (Volume Weighted Average Price)
VWAP is calculated as a cumulative average price weighted by volume. The dashboard compares the current price with VWAP, showing whether the market is trading above or below it.
For traders, VWAP is often a guide for institutional order flow. Price trading above VWAP suggests bullish sentiment, while trading below VWAP indicates bearish sentiment. Learners can use VWAP as a training tool to recognize trend-following vs. mean reversion setups.
________________________________________
3. Volume Analysis
The system distinguishes between buy volume (when the closing price is higher than the open) and sell volume (when the closing price is lower than the open). A progress bar highlights the ratio of buying vs. selling activity in percentage.
This is useful because volume confirms price action. For instance, if prices rise but sell volume dominates, it can signal weakness. New traders learning with this tool should focus on how volume often precedes price reversals and trends.
________________________________________
4. RSI (Relative Strength Index)
RSI is a momentum oscillator that measures price strength on a scale from 0 to 100. The dashboard classifies RSI readings into overbought (>70), oversold (<30), or neutral zones and adds visual progress bars.
RSI helps learners understand momentum shifts. During training, one should notice how trending markets can keep RSI extended for longer periods (not immediate reversal signals), while range-bound markets react more sharply to RSI extremes. It is an excellent tool for practicing trend vs. range identification.
________________________________________
5. MACD (Moving Average Convergence Divergence)
The MACD indicator involves a fast EMA, slow EMA, and signal line, with focus on crossovers. The dashboard shows whether a “bullish cross” (MACD above signal line) or “bearish cross” (MACD below signal line) has occurred.
MACD teaches traders to identify trend momentum shifts and divergence. During practice, traders can explore how MACD signals align with VWAP trends or RSI levels, which helps in building a structured multi-indicator analysis.
________________________________________
6. Stochastic Oscillator
This indicator compares the current close relative to a range of highs and lows over a period. Displayed values oscillate between 0 and 100, marking zones of overbought (>80) and oversold (<20).
Stochastics are useful for students of trading to recognize short-term momentum changes. Unlike RSI, it reacts faster to price volatility, so false signals are common. Part of the training exercise can be to observe how stochastic “flips” can align with volume surges or daily range endpoints.
________________________________________
7. Trend & Momentum Classification
The dashboard adds simple labels for trend (uptrend, downtrend, neutral) based on RSI thresholds. Additionally, it provides quick momentum classification (“bullish hold”, “bearish hold”, or neutral).
This is beneficial for beginners as it introduces structured thinking: differentiating long-term market bias (trend) from short-term directional momentum. By combining both, traders can practice filtering signals instead of trading randomly.
________________________________________
8. Accumulation / Distribution Bias
Based on RSI levels, the script generates simplified tags such as “Accumulate Long”, “Accumulate Short”, or “Wait”.
This is purely an interpretive guide, helping learners think in terms of accumulation phases (when markets are low) and distribution phases (when markets are high). It reinforces the concept that trading is not only directional but also involves timing.
________________________________________
9. Overall Market Status and Score
Finally, the dashboard compiles multiple indicators (VWAP position, RSI, MACD, Stochastics, and price vs. median levels) into a Market Score expressed as a percentage. It also labels the market as Overbought, Oversold, or Normal.
This scoring system isn’t a recommendation but a learning framework. Students can analyze how combining different indicators improves decision-making. The key training focus here is confluence: not depending on one indicator but observing when several conditions align.
Extended Study Material with Formulas
________________________________________
1. Daily Reference Levels (High, Low, Open, Median, Range)
• Day High (H): Maximum price of the session.
DayHigh=max(Hightoday)DayHigh=max(Hightoday)
• Day Low (L): Minimum price of the session.
DayLow=min(Lowtoday)DayLow=min(Lowtoday)
• Day Open (O): Opening price of the session.
DayOpen=OpentodayDayOpen=Opentoday
• Day Range:
Range=DayHigh−DayLowRange=DayHigh−DayLow
• Median: Mid-point between high and low.
Median=DayHigh+DayLow2Median=2DayHigh+DayLow
These act as intraday guideposts for seeing how far the price has stretched from its key reference levels.
________________________________________
2. VWAP (Volume Weighted Average Price)
VWAP considers both price and volume for a weighted average:
VWAPt=∑i=1t(Pricei×Volumei)∑i=1tVolumeiVWAPt=∑i=1tVolumei∑i=1t(Pricei×Volumei)
Here, Price_i can be the average price (High + Low + Close) ÷ 3, also known as hlc3.
• Interpretation: Price above VWAP = bullish bias; Price below = bearish bias.
________________________________________
3. Volume Buy/Sell Analysis
The dashboard splits total volume into buy volume and sell volume based on candle type.
• Buy Volume:
BuyVol=Volumeif Close > Open, else 0BuyVol=Volumeif Close > Open, else 0
• Sell Volume:
SellVol=Volumeif Close < Open, else 0SellVol=Volumeif Close < Open, else 0
• Buy Ratio (%):
VolumeRatio=BuyVolBuyVol+SellVol×100VolumeRatio=BuyVol+SellVolBuyVol×100
This helps traders gauge who is in control during a session—buyers or sellers.
________________________________________
4. RSI (Relative Strength Index)
RSI measures strength of momentum by comparing gains vs. losses.
Step 1: Compute average gains (AG) and losses (AL).
AG=Average of Upward Closes over N periodsAG=Average of Upward Closes over N periodsAL=Average of Downward Closes over N periodsAL=Average of Downward Closes over N periods
Step 2: Calculate relative strength (RS).
RS=AGALRS=ALAG
Step 3: RSI formula.
RSI=100−1001+RSRSI=100−1+RS100
• Used to detect overbought (>70), oversold (<30), or neutral momentum zones.
________________________________________
5. MACD (Moving Average Convergence Divergence)
• Fast EMA:
EMAfast=EMA(Close,length=fast)EMAfast=EMA(Close,length=fast)
• Slow EMA:
EMAslow=EMA(Close,length=slow)EMAslow=EMA(Close,length=slow)
• MACD Line:
MACD=EMAfast−EMAslowMACD=EMAfast−EMAslow
• Signal Line:
Signal=EMA(MACD,length=signal)Signal=EMA(MACD,length=signal)
• Histogram:
Histogram=MACD−SignalHistogram=MACD−Signal
Crossovers between MACD and Signal are used in studying bullish/bearish phases.
________________________________________
6. Stochastic Oscillator
Stochastic compares the current close against a range of highs and lows.
%K=Close−LowestLowHighestHigh−LowestLow×100%K=HighestHigh−LowestLowClose−LowestLow×100
Where LowestLow and HighestHigh are the lowest and highest values over N periods.
The %D line is a smooth version of %K (using a moving average).
%D=SMA(%K,smooth)%D=SMA(%K,smooth)
• Values above 80 = overbought; below 20 = oversold.
________________________________________
7. Trend and Momentum Classification
This dashboard generates simplified trend/momentum logic using RSI.
• Trend:
• RSI < 40 → Downtrend
• RSI > 60 → Uptrend
• In Between → Neutral
• Momentum Bias:
• RSI > 70 → Bullish Hold
• RSI < 30 → Bearish Hold
• Otherwise Neutral
This is not predictive, only a classification framework for educational use.
________________________________________
8. Accumulation/Distribution Bias
Based on extreme RSI values:
• RSI < 25 → Accumulate Long Bias
• RSI > 80 → Accumulate Short Bias
• Else → Wait/No Action
This helps learners understand the idea of accumulation at lows (strength building) and distribution at highs (profit booking).
________________________________________
9. Overall Market Status and Score
The tool adds up 5 bullish conditions:
1. Price above VWAP
2. RSI > 50
3. MACD > Signal
4. Stochastic > 50
5. Price above Daily Median
BullishScore=ConditionsMet5×100BullishScore=5ConditionsMet×100
Then it categorizes the market:
• RSI > 70 or Stoch > 80 → Overbought
• RSI < 30 or Stoch < 20 → Oversold
• Else → Normal
This encourages learners to think in terms of probabilistic conditions instead of single-indicator signals.
________________________________________
⚠️ Warning:
• Trading financial markets involves substantial risk.
• You can lose more money than you invest.
• Past performance of indicators does not guarantee future results.
• This script must not be copied, resold, or republished without authorization from aiTrendview.
By using this material or the code, you agree to take full responsibility for your trading decisions and acknowledge that this is not financial advice.
________________________________________
⚠️ Disclaimer and Warning (From aiTrendview)
This Dynamic Trading Dashboard is created strictly for educational and research purposes on the TradingView platform. It does not provide financial advice, buy/sell recommendations, or guaranteed returns. Any use of this tool in live trading is completely at the user’s own risk. Markets are inherently risky; losses can exceed initial investment.
The intellectual property of this script and its methodology belongs to aiTrendview. Unauthorized reproduction, modification, or redistribution of this code is strictly prohibited. By using this study material or the script, you acknowledge personal responsibility for any trading outcomes. Always consult professional financial advisors before making investment decisions.
