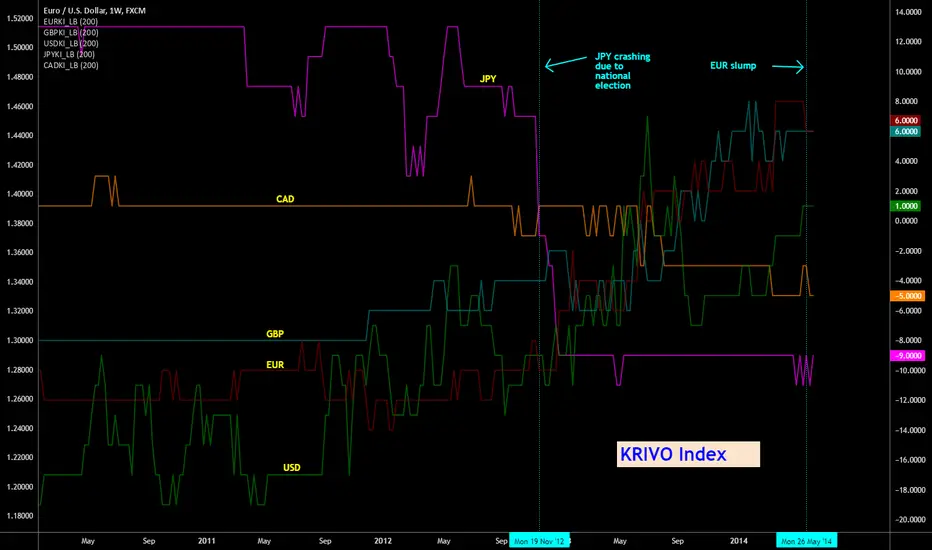
Indicator: Krivo Index [Forex]Krivo index, suggested by Richard Krivo, tries to quantify the "strength" of a currency by checking how many of its pairs are trading strongly (close above 200sma). As you can see from the chart, KI gives an excellent overview of their strength. Note how it correctly points out the JPY crash (Nov 2012).
I decided to implement KI for each currency separately to be compliant with Pine requirements. Also, this enables to add only the needed currency KI scripts (for ex., just CAD_KI and USD_KI). You can add the needed currency KI scripts and merge them all together to form a chart like this. Make sure you "right click" on all and select "Scale Right" (or "Scale Left". Thing to note is all KIs shd be aligned to the same scale).
I have published KI for only 5 currencies now, but can add more on request. BTW, this index is usable on all time frames.
More info on KrivoIndex:
-----------------------------
www.dailyfx.com
JPY crashing:
-----------------------------
webcache.googleusercontent.com
Euro Slump:
-----------------------------
www.bloomberg.com
Please see the comment below for the complete list of currency pairs I used for deriving these indexes.
Wyszukaj w skryptach "2014年日元兑美元平均汇率"
Indicator: Market Facilitation Index [MFIndex]
***** NOTE: You may see all GREEN circles (it is due to a recent TV update). To work around this issue, change the "Circles" to "Cross" via Format -> Style *****
Market Facilitation Index, by Bill Williams, plots the effectiveness of price movement by computing the price movement per volume unit.
4 possible combinations of MFIndex and Volume are:
Green :
---------------------------------
MFIndex increases and the volume increases. This means that the amount of participants entering the market increases, therefore the volume increases and the fresh incoming players align their positions in the direction of candlestick growth.
Fade :
------------------------------
MFIndex falls and volume falls. It means that the market participants are indifferent and the price movement is small on small volumes. This usually happens at the end of a trend.
Fake :
------------------------------
MFIndex increases, but the volume falls. It is highly likely that the market is being supported by broker speculation and not any significant client volume.
Squat :
--------------------------------
MFIndex falls, but the volume increases. In this particular situation bulls and bears are fighting between themselves to see who will dominate the next trend. These battles are noticeable by the large sell and buy volumes. However, the price does not change appreciably since the strengths are equal. One of the competing parties either the buyers or the sellers will ultimately triumph in the battle. Usually, the fracture of such a candle indicates if this particular candle determines the continuation of the trend, or terminates the trend.
More info: en.wikipedia.org
Code: pastebin.com

Indicator: Balance Of Power**** Code updated. Make sure you pick up the latest version posted (not the code in the published chart) ******
An oscillator that represents the battle between the bulls and the bears in the market.
BOP supports spotting price divergence, trends, and overbought-oversold levels.A change in the BOP trend serves as a warning signal and should be confirmed by a change in the price direction.
More info @ www.fxtimes.com
Updated the code to match ThinkOrSwim platform's indicator (request from user @mika2k1). v2 code here: pastebin.com
This allows you to plot only the EMA (instead of actual BOP). Sample image posted in the comments below.
