Dominant Cycle Tuned RsiIntroduction
Adaptive technical indicators are importants in a non stationary market, the ability to adapt to a situation can boost the efficiency of your strategy. A lot of methods have been proposed to make technical indicators "smarters" , from the use of variable smoothing constant for exponential smoothing to artificial intelligence.
The dominant cycle tuned rsi depend on the dominant cycle period of the market, such method allow the rsi to return accurate peaks and valleys levels. This indicator is an estimation of the cycle finder tuned rsi proposed by Lars von Thienen published in Decoding the Hidden Market Rhythm/Fine-tuning technical indicators using the dominant market vibration/2010 using the cycle measurement method described by John F.Ehlers in Cybernetic Analysis for Stocks and Futures .
The following section is for information purpose only, it can be technical so you can skip directly to the The Indicator section.
Frequency Estimation and Maximum Entropy Spectral Analysis
“Looks like rain,” said Tom precipitously.
Tom would have been a great weather forecaster, but market patterns are more complex than weather ones. The ability to measure dominant cycles in a complex signal is hard, also a method able to estimate it really fast add even more challenge to the task. First lets talk about the term dominant cycle , signals can be decomposed in a sum of various sine waves of different frequencies and amplitudes, the dominant cycle is considered to be the frequency of the sine wave with the highest amplitude. In general the highest frequencies are those who form the trend (often called fundamentals) , so detrending is used to eliminate those frequencies in order to keep only mid/mid - highs ones.
A lot of methods have been introduced but not that many target market price, Lars von Thienen proposed a method relying on the following processing chain :
Lars von Thienen Method = Input -> Filtering and Detrending -> Discrete Fourier Transform of the result -> Selection using Bartels statistical test -> Output
Thienen said that his method is better than the one proposed by Elhers. The method from Elhers called MESA was originally developed to interpret seismographic information. This method in short involve the estimation of the phase using low amount of information which divided by 360 return the frequency. At first sight there are no relations with the Maximum entropy spectral estimation proposed by Burg J.P. (1967). Maximum Entropy Spectral Analysis. Proceedings of 37th Meeting, Society of Exploration Geophysics, Oklahoma City.
You may also notice that these methods are plotted in the time domain where more classic method such as : power spectrum, spectrogram or FFT are not. The method from Elhers is the one used to tune our rsi.
The Indicator
Our indicator use the dominant cycle frequency to calculate the period of the rsi thus producing an adaptive rsi . When our adaptive rsi cross under 70, price might start a downtrend, else when our adaptive rsi crossover 30, price might start an uptrend. The alpha parameter is a parameter set to be always lower than 1 and greater than 0. Lower values of alpha minimize the number of detected peaks/valleys while higher ones increase the number of those. 0.07 for alpha seems like a great parameter but it can sometimes need to be changed.
The adaptive indicator can also detect small top/bottoms of small periods
Of course the indicator is subject to failures
At the end it is totally dependent of the dominant cycle estimation, which is still a rough method subject to uncertainty.
Conclusion
Tuning your indicator is a great way to make it adapt to the market, but its also a complex way to do so and i'm not that convinced about the complexity/result ratio. The version using chart background will be published separately.
Feel free to tune your indicators with the estimator from elhers and see if it provide a great enhancement :)
Thanks for reading !
References
for the calculation of the dominant cycle estimator originally from www.davenewberg.com
Decoding the Hidden Market Rhythm (2010) Lars von Thienen
Ehlers , J. F. 2004 . Cybernetic Analysis for Stocks and Futures: Cutting-Edge DSP Technology to Improve Your Trading . Wiley
Wyszukaj w skryptach "2010年+黄金价格+历史数据"

Fractal Adaptive Moving Average (real one)Ignore the other one (it contains some errors).
On this FRAMA you can play with length, SC and FC.
Just read on below links to understand more about this super useful moving average:
etfhq.com
etfhq.com
www.quantshare.com

BBMA Enhanced Pro - Multi-Timeframe Band Breakout StrategyShort Title : BBMA Pro
Overview
The BBMA Enhanced Pro is a professional-grade trading indicator that builds on the Bollinger Bands Moving Average (BBMA) strategy, pioneered by Omar Ali , a Malaysian forex trader and educator. Combining Bollinger Bands with Weighted Moving Averages (WMA) , this indicator identifies high-probability breakout and reversal opportunities across multiple timeframes. With advanced features like multi-timeframe Extreme signal detection, eight professional visual themes, and a dual-mode dashboard, it’s designed for traders seeking precision in trending and consolidating markets. Optimized for dark chart backgrounds, it’s ideal for forex, stocks, and crypto trading.
History
The BBMA strategy was developed by Omar Ali (BBMA Oma Ally) in the early 2010s, gaining popularity in the forex trading community, particularly in Southeast Asia. Building on John Bollinger’s Bollinger Bands, Omar Ali integrated Weighted Moving Averages and a multi-timeframe approach to create a structured system for identifying reversals, breakouts, and extreme conditions. The BBMA Enhanced Pro refines this framework with modern features like real-time dashboards and customizable visualizations, making it accessible to both novice and experienced traders.
Key Features
Multi-Timeframe Extreme Signals : Detects Extreme signals (overbought/oversold conditions) on both current and higher timeframes simultaneously, a rare feature that enhances signal reliability through trend alignment.
Professional Visual Themes : Eight distinct themes (e.g., Neon Contrast, Fire Gradient) optimized for dark backgrounds.
Dual-Mode Dashboard : Choose between Full Professional (detailed metrics) or Simplified Trader (essential info with custom notes).
Bollinger Band Squeeze Detection : Identifies low volatility periods (narrow bands) signaling potential sideways markets or breakouts.
Confirmation Labels : Displays labels when current timeframe signals align with recent higher timeframe signals, highlighting potential consolidations or squeezes.
Timeframe Validation : Prevents selecting the same timeframe for current and higher timeframe analysis.
Customizable Visualization : Toggle signal dots, EMA 50, and confirmation labels for a clean chart experience.
How It Works
The BBMA Enhanced Pro combines Bollinger Bands (20-period SMA, ±2 standard deviations) with WMA (5 and 10 periods) to generate trade signals:
Buy Signal : WMA 5 Low crosses above the lower Bollinger Band, indicating a recovery from an oversold condition (Extreme buy).
Sell Signal : WMA 5 High crosses below the upper Bollinger Band, signaling a rejection from an overbought condition (Extreme sell).
Extreme Signals : Occur when prices or WMAs move significantly beyond the Bollinger Bands (±2σ), indicating statistically rare overextensions. These often coincide with Bollinger Band Squeezes (narrow bands, low standard deviation), signaling potential sideways markets or impending breakouts.
Multi-Timeframe Confirmation : The indicator’s unique strength is its ability to detect Extreme signals on both the current and higher timeframe (HTF) within the same chart. When the HTF generates an Extreme signal (e.g., buy), and the current timeframe follows with an identical signal, it suggests the lower timeframe is aligning with the HTF’s trend, increasing reliability. Labels appear only when this alignment occurs within a user-defined lookback period (default: 50 bars), highlighting periods of band contraction across timeframes.
Bollinger Band Squeeze : Narrow bands (low standard deviation) indicate reduced volatility, often preceding consolidation or breakouts. The indicator’s dashboard tracks band width, helping traders anticipate these phases.
Why Multi-Timeframe Extremes Matter
The BBMA Enhanced Pro’s multi-timeframe approach is rare and powerful. When the higher timeframe shows an Extreme signal followed by a similar signal on the current timeframe, it suggests the market is following the HTF’s trend or entering a consolidation phase. For example:
HTF Sideways First : If the HTF Bollinger Bands are shrinking (low volatility, low standard deviation), it signals a potential sideways market. Waiting for the current timeframe to show a similar Extreme signal confirms this consolidation, reducing the risk of false breakouts.
Risk Management : By requiring HTF confirmation, the indicator encourages traders to lower risk during uncertain periods, waiting for both timeframes to align in a low-volatility state before acting.
Usage Instructions
Select Display Mode :
Current TF Only : Shows Bollinger Bands and WMAs on the chart’s timeframe.
Higher TF Only : Displays HTF bands and WMAs.
Both Timeframes : Combines both for comprehensive analysis.
Choose Higher Timeframe : Select from 1min to 1D (e.g., 15min, 1hr). Ensure it differs from the current timeframe to avoid validation errors.
Enable Signal Dots : Visualize buy/sell Extreme signals as dots, sourced from current, HTF, or both timeframes.
Toggle Confirmation Labels : Display labels when current timeframe Extremes align with recent HTF Extremes, signaling potential squeezes or consolidations.
Customize Dashboard :
Full Professional Mode : View metrics like BB width, WMA trend, and last signal.
Simplified Trader Mode : Focus on essential info with custom trader notes.
Select Visual Theme : Choose from eight themes (e.g., Ice Crystal, Royal Purple) for optimal chart clarity.
Trading Example
Setup : 5min chart, HTF set to 1hr, signal dots and confirmation labels enabled.
Buy Scenario : On the 5min chart, WMA 5 Low crosses above the lower Bollinger Band (Extreme buy), confirmed by a recent 1hr Extreme buy signal within 50 bars. The dashboard shows narrow bands (squeeze), and a green label appears.
Action : Enter a long position, targeting the middle band, with a stop-loss below the recent low. The HTF confirmation suggests a strong trend or consolidation phase.
Sell Scenario : WMA 5 High crosses below the upper Bollinger Band on the 5min chart, confirmed by a recent 1hr Extreme sell signal. The dashboard indicates a squeeze, and a red label appears.
Action : Enter a short position, targeting the middle band, with a stop-loss above the recent high. The aligned signals suggest a potential reversal or sideways market.
Customization Options
BBMA Display Mode : Current TF Only, Higher TF Only, or Both Timeframes.
Higher Timeframe : 1min to 1D.
Visual Theme : Eight professional themes (e.g., Neon Contrast, Forest Glow).
Line Style : Smooth or Step Line for HTF plots.
Signal Dots : Enable/disable, select timeframe source (Current, Higher, or Both).
Confirmation Labels : Toggle and set lookback window (1-100 bars).
Dashboard : Enable/disable, choose mode (Full/Simplified), and set position (Top Right, Bottom Left, etc.).
Notes
Extreme Signals and Squeezes : Extreme signals often occur during Bollinger Band contraction (low standard deviation), signaling potential sideways markets or breakouts. Use HTF confirmation to filter false signals.
Risk Management : If the HTF shows a squeeze (narrow bands), wait for the current timeframe to confirm with an Extreme signal to reduce risk in choppy markets.
Limitations : Avoid trading Extremes in highly volatile markets without additional confirmation (e.g., volume, RSI).
Author Enhanced Professional Edition, inspired by Omar Ali’s BBMA strategy
Version : 6.0 Pro - Simplified
Last Updated : September 2025
License : Mozilla Public License 2.0
We’d love to hear your feedback! Share your thoughts or questions in the comments below.

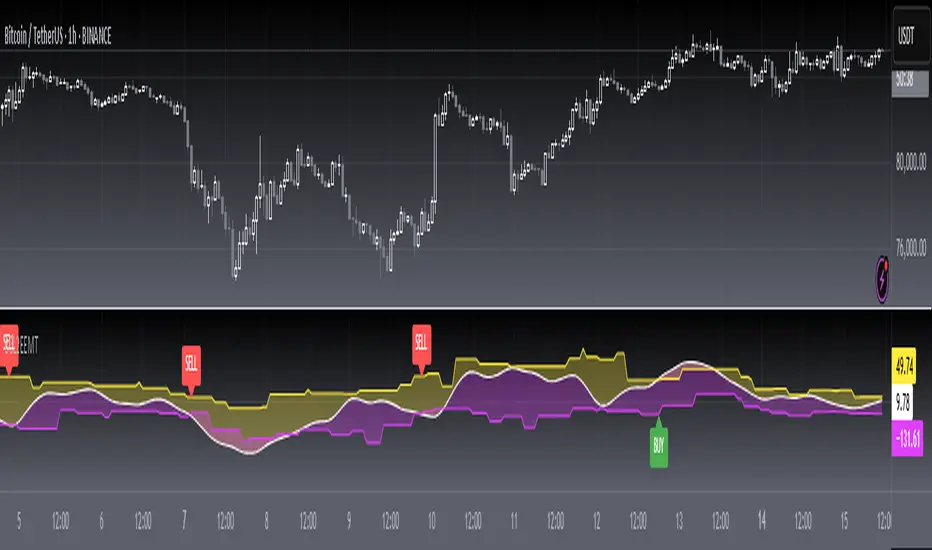
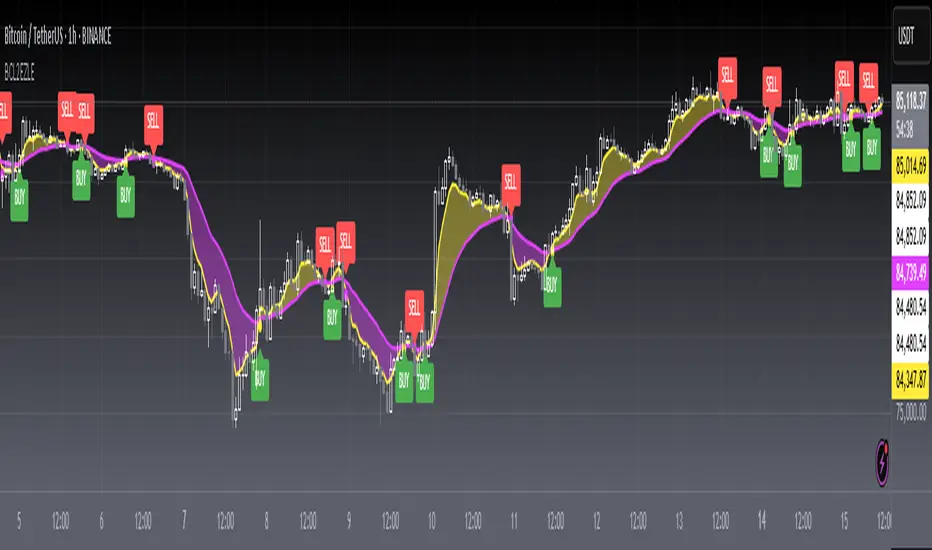
Xmaster Formula Indicator [TradingFinder] No Repaint Strategies🔵 Introduction
The Xmaster Formula Indicator is a powerful tool for forex trading, combining multiple technical indicators to provide insights into market trends, support and resistance levels, and price reversals. Developed in the early 2010s, it is widely valued for generating reliable buy and sell signals.
Key components include Exponential Moving Averages (EMA) for identifying trends and price momentum, and MACD (Moving Average Convergence Divergence) for analyzing trend strength and direction.
The Stochastic Oscillator and RSI (Relative Strength Index) enhance accuracy by signaling potential price reversals. Additionally, the Parabolic SAR assists in identifying trend reversals and managing risk.
By integrating these tools, the Xmaster Formula Indicator provides a comprehensive view of market conditions, empowering traders to make informed decisions.
🔵 How to Use
The Xmaster Formula Indicator offers two distinct methods for generating signals: Standard Mode and Advance Mode. Each method caters to different trading styles and strategies.
Standard Mode :
In Standard Mode, the indicator uses normalized moving average data to generate buy and sell signals. The difference between the short-term (10-period) and long-term (38-period) EMAs is calculated and normalized to a 0-100 scale.
Buy Signal : When the normalized value crosses above 55, accompanied by the trend line turning green, a buy signal is generated.
Sell Signal : When the normalized value crosses below 45, and the trend line turns red, a sell signal is issued.
This mode is simple, making it ideal for traders looking for straightforward signals without the need for additional confirmations.
Advance Mode :
Advance Mode combines multiple technical indicators to provide more detailed and robust signals.
This method analyzes trends by incorporating :
🟣 MACD
Buy Signal : When the MACD histogram bars are positive.
Sell Signal : When the MACD histogram bars are negative.
🟣 RSI
Buy Signal : When RSI is below 30, indicating oversold conditions.
Sell Signal : When RSI is above 70, suggesting overbought conditions.
🟣 Stochastic Oscillator
Buy Signal : When Stochastic is below 20.
Sell Signal : When Stochastic is above 80.
🟣 Parabolic SAR
Buy Signal : When SAR is below the price.
Sell Signal : When SAR is above the price.
A signal is generated in Advance Mode only when all these indicators align :
Buy Signal : All conditions point to a bullish trend.
Sell Signal : All conditions indicate a bearish trend.
This mode is more comprehensive and suitable for traders who prefer deeper analysis and stronger confirmations before executing trades.
🔵 Settings
Method :
Choose between "Standard" and "Advance" modes to determine how signals are generated. In Standard Mode, signals are based on normalized moving average data, while in Advance Mode, signals rely on the combination of MACD, RSI, Stochastic Oscillator, and Parabolic SAR.
Moving Average Settings :
Short Length : The period for the short-term EMA (default is 10).
Mid Length : The period for the medium-term EMA (default is 20).
Long Length : The period for the long-term EMA (default is 38).
MACD Settings :
Fast Length : The period for the fast EMA in the MACD calculation (default is 12).
Slow Length : The period for the slow EMA in the MACD calculation (default is 26).
Signal Line : The signal line period for MACD (default is 9).
Stochastic Settings :
Length : The period for the Stochastic Oscillator (default is 14).
RSI Settings :
Length : The period for the Relative Strength Index (default is 14).
🔵 Conclusion
The Xmaster Formula Indicator is a versatile and reliable tool for forex traders, offering both simplicity and advanced analysis through its Standard and Advance modes. In Standard Mode, traders benefit from straightforward signals based on normalized moving average data, making it ideal for quick decision-making.
Advance Mode, on the other hand, provides a more detailed analysis by combining multiple indicators like MACD, RSI, Stochastic Oscillator, and Parabolic SAR, delivering stronger confirmations for critical market decisions.
While the Xmaster Formula Indicator offers valuable insights and reliable signals, it is important to use it alongside proper risk management and other analytical methods. By leveraging its capabilities effectively, traders can enhance their trading strategies and achieve better outcomes in the dynamic forex market.

Grover Llorens Activator Strategy AnalysisThe Grover Llorens Activator is a trailing stop indicator deeply inspired by the parabolic SAR indicator, and aim to provide early exit points and reversal detection. The indicator was posted not so long ago, you can find it here :
Today a strategy using the indicator is proposed, and its profitability is analyzed on 3 different markets with the main time frame being 1 hour, remember that lower time frames involve lower absolute price changes, therefore we are way more affected by the spread, and we can require a larger position sizing depending on our investment target, trading higher time-frames is always a good practice and this is why 1 hour is selected. Based on the result we might make various conclusions regarding the indicator accuracy and might have ideas on future improvements of the indicator.
I'am not great when it comes to strategy design, i still hope to share correct and useful information in this post, let me know your thoughts on the post format and if i should make more of these.
Setup And Rules
The analysis is solely based on the indicator signals, money management isn't taken into account, this allow us to have an idea on the indicator robustness and resilience, particularly on extremely volatile markets and ones exhibiting a chaotic structure, altho it is normally good practice to close any position before a market closure in order to avoid any potential major gaps.
The settings used are 480 for length and 14 for mult, this create relatively mid term signals that are suited for a trend indicator such as the Grover Llorens Activator, unfortunately we can't infer the indicator optimal settings, thats how it is with any technical indicator anyway.
Here are the rules of our strategy :
long : closing price cross over the indicator
short : closing price cross under the indicator
We use constant position sizing, once a signal is triggered all the previous positions are closed.
Description Of The Statistics Used
Various statistics are presented in this post, here is a brief description of the main ones :
Percent Profitability (higher = better): Percentage of winning trades, that is : winning trades/total number of trades × 100
Maximum Drawdown (lower = better) : The highest difference between a peak and a valley in the balance, that is : peak - valley , in percentage : (peak - valley)/peak × 100
Profit Factor (higher = better) : Gross profit divided by gross loss, values under 1 represent gross losses superior to the gross profits
Remember that more volatility = more risk, since higher absolute price changes can logically cause larger losses.
EURUSD
The first market analyzed is the Forex market with the EURUSD major pair with a position sizing of 1000 units (1 micro lot). Since October EURUSD is not showing any particular strong trend but posses a discrete rising motion, fortunately cycles can be observed.
The equity was rising until two trades appeared causing a decline in the equity. Before October a bearish market could be observed.
We can see that the equity is rising, the trend still posses various retracements that affect our indicator, however we can see that the indicator totally nail the end of the trend, thats the power of converging toward the price.
In short :
$ 86.63 net profit
340 closed trades
37.65 % profitable (thats a lot of loosing trades)
1.19 profit factor
$ 76.67 max drawdown
Applying a spread would create negative results (in general the average spread is used), not a great start...
BTCUSD
The cryptocurrency market is relatively more volatile than others, which also mean potentially higher returns, we test the indicator using certainly the most traded cryptocurrency, BTCUSD. We will use a position sizing of 1 unit.
In the case of BTCUSD the strategy balance is relatively stationary around the initial capital, with of course high dispersion.
from september to december the market is bearish with various ranging periods, no apparent cycles can be observed, except maybe in the ranging period of october, this ranging period is followed by a non linear trend (relatively parabolic) that the indicator failed to capture in its integrity (this is a recurrent problem and it is starting to piss me off xD).
In short :
$ 2010.64 net profit (aka how i bet the crypto market)
395 closed trades
38.23 % profitable
1.036 profit factor
$ 5738.01 max drawdown (aka how i lost to the crypto market)
AMD
AMD stand for Advanced Micro Devices and is a company focused on the development of computer technology, i love the microprocessor market and i really like AMD who start this year in a pretty great way with a net bullish trend.
The performance of the indicator on AMD is decent (at last !) with the equity producing many new higher highs. The indicator performance still drop in the middle end of 2019 with a large equity drawdown of 17$ caused by the gap of august 8. Unfortunately AMD, like lot of well behaving stocks can only tells us that the indicator has good performances on heavily trending markets with no excess of noise or chaotic structures.
In short :
$ 17.86 net profit (Enough for a consistent lunch)
295 closed trades
36.27 % profitable
1.414 profit factor
$ 10.37 max drawdown.
Conclusion
A strategy using the recently proposed Grover Llorens activator has been presented. We can easily conclude that the indicator can't possibly generate long term returns under chaotic and volatile markets, and could even produce unnecessary trades in trending markets without much parasitic fluctuations such as noise and retracements (think about a simple linear trend) since the indicator converge toward the price and would therefore automatically cross over/under the trend, thus guaranteeing a false signal.
However we have seen its ability to provide accurate early reversal detection shine from time to time, thus over performing lagging indicators in this aspect, however the duration of price fluctuations isn't fixed at a certain period, the rate of convergence should be way faster during volatile fluctuations, of moderate speed during more cyclic fluctuations, and really slow with apparent long term trends, this could be achieved by making the indicator adaptive, but it won't really make it necessarily perform better.
That said i still believe that converging trend indicators are really interesting and aim to capture the non lasting behavior of price fluctuations, they shouldn't receive so much hate (think about the poor p-sar).
Thanks for reading !

BTC Performance Table / BTC Seasonality Visualization
This script visualizes Bitcoins "seasonality", in form of a colored table (based on the idea from "BigBangTheory")
The history table shows you which months do statistically perform better/worse in comparison to other months.
How to use this script:
Choose ticker "BLX" ("BraveNewCoin Liquid Index for Bitcoin").
Set the charts time frame to weekly or daily. Tables position on the screen and its colors are configurable.
Table explanation:
Cells show whether a gain or a loss occured from month to month, since BTC came out in 2010.
The price difference, between monthly open and monthly close, determines the cell color (negative -> red, positive -> green).
The year column shows total gain (green) or loss (red) for that particular year.
Each value is presented as a rounded percentage number.
How this script works:
The script calculates the price difference between each monthly and yearly open and close, storing those numbers inside arrays.
Then it populates the table, by using those numbers and doing the cell coloring (there will be a yellow cell, in case no change should occur).
German Short-Description
Prozentuale Übersicht in Tabellenform, der monatlichen, sowie jährlichen, Performance des Bitcoin (basierend auf der Idee von "BigBangTheory").
Hierdurch wird die "Saisonalität" des Bitcoin sichtbar. D.h. welche Monate des Jahres, im Vergleich zu anderen Monaten, statistisch gesehen öfter positiv/negativ schließen.
Zwecks vollständiger Darstellung muss der Ticker "BLX" ("BraveNewCoin Liquid Index for Bitcoin") im weekly oder daily time frame aktiv sein.

ahr999 Index█ OVERVIEW
The ahr999 index is very suitable for long-term value investors in Bitcoin.
When the index is above 1.2, it indicates that the price of Bitcoin is rising in a bull market.
When it is below 1.2, it indicates a reasonable cost averaging interval for investment.
When it is below 0.45, it indicates that the price of Bitcoin is underestimated and is a relatively high-certainty bottoming interval.
█ CONCEPTS
ahr999 is the product of two indices, one is Bitcoin's 200-day average price cost and the other is a price estimate fitted to Bitcoin's age.
The average cost is actually a geometric mean of bitcoin price in 200days.
and the estimate price was calculated by a log function based on the bitcoin price history since 2010.
finally we got the formula:
ahr999 Index = (close / GMA200) * (close / Estimate Price)
█ ACKNOWLEDGEMENT
This ahr999 index was originally created by Nine God in his book 《Bitcoin Accumulation》

Bollinger Bands Width and Bollinger Bands %BThis script shows both the Bollinger Band Width(BBW) and %B on the same indicator window.
Both the BBW and %B are introduced by John Bollinger(creator of Bollinger Bands) in 2010.
Default Parameter values: Length = 20, Source = Close, Mult = 2
Bollinger Bands Width (BBW): Color = (Default: Green )
- I consider stocks with "BBW >= 4" are at a volatile state and ready for price contraction, but this depends on the parameter values of your choice.
Bollinger Bands %B (%B): Color = (Default: Blue )
1. %B Above 10 = Price is Above the Upper Band
2. %B Equal to 10 = Price is at the Upper Band
3. %B Above 5 = Price is Above the Middle Line
4. %B Below 5 = Price is Below the Middle Line
5. %B Equal to 0 = Price is at the Lower Band
6. %B Below 0 = Price is Below the Lower Band

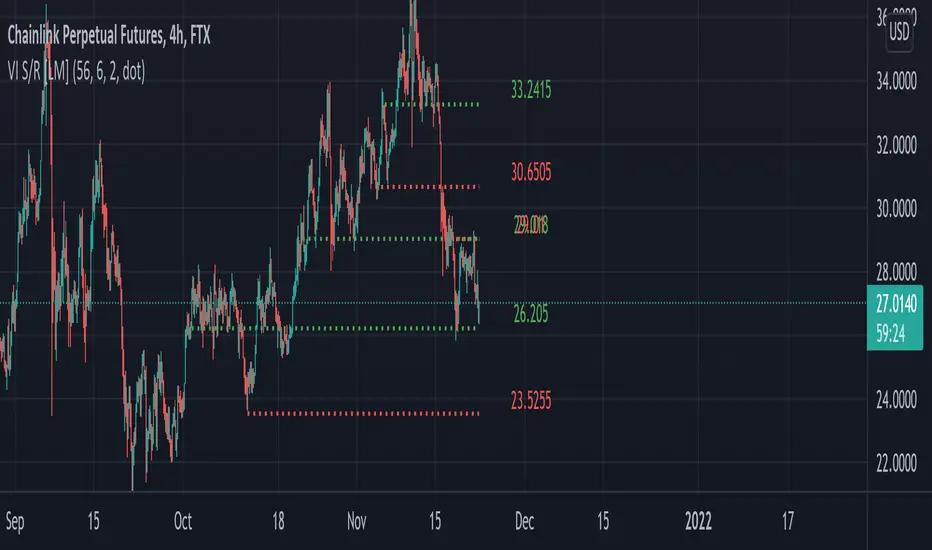
Vortex indicator cross support&resistance [LM]Hello traders,
I would like you to present Vortex indicator cross support&resistance script. The idea behind is same as my other S/R scripts to look for important S/R levels.
This time I have used little known and not that old Vortex Indicator that has been released in 2010. Vortex indicator has two plots that crosses each other and on the cross line is rendered. I have included smoothing with TEMA.
The indicator has following settings:
General control - here you can select period of vortex indicator and show/hide labels
Line control - where you can select type of line, colors...
Hope you will enjoy it,
Lukas
[blackcat] L2 Ehlers Empirical Mode TraderCircumstance Remarks: Because of my carelessness, the script of the same name that I posted before was banned and hidden because the description contained content that violated the TradingView House Rule. After communicating with the MOD, I corrected the description and obtained permission to publish it again. I hereby declare. Sorry for the inconvenience!
Level: 2
Background
John F. Ehlers introuced Empirical Mode Trader Indicator in Mar, 2010.
Function
In his article “Empirical Mode Decomposition,” John Ehlers and Ric Way suggest using methods based on bandpass filtering to distinguish trending from cycling markets. The article’s trading suggestions were used to create the Empirical Mode strategy given here for pine v4 script. If the strategy determines that the marke is in trending mode, then the strategy is allowed to trade with the trend — either long, in uptrends, or short, in downtrends. If the indicator determines that the market is in cycling mode, then the strategy allows trading cycle extremes, using Bollinger bands to trigger entries. You can do this by Choosing either cycle or trend mode at inputs.
Key Signal
Trend ---> Trend signal
FracAvgPeak ---> Upper band signal
FracAvgValley ---> Lower band signal
Pros and Cons
100% John F. Ehlers definition translation, even variable names are the same. This help readers who would like to use pine to read his book.
Remarks
The 75th script for Blackcat1402 John F. Ehlers Week publication.
Readme
In real life, I am a prolific inventor. I have successfully applied for more than 60 international and regional patents in the past 12 years. But in the past two years or so, I have tried to transfer my creativity to the development of trading strategies. Tradingview is the ideal platform for me. I am selecting and contributing some of the hundreds of scripts to publish in Tradingview community. Welcome everyone to interact with me to discuss these interesting pine scripts.
The scripts posted are categorized into 5 levels according to my efforts or manhours put into these works.
Level 1 : interesting script snippets or distinctive improvement from classic indicators or strategy. Level 1 scripts can usually appear in more complex indicators as a function module or element.
Level 2 : composite indicator/strategy. By selecting or combining several independent or dependent functions or sub indicators in proper way, the composite script exhibits a resonance phenomenon which can filter out noise or fake trading signal to enhance trading confidence level.
Level 3 : comprehensive indicator/strategy. They are simple trading systems based on my strategies. They are commonly containing several or all of entry signal, close signal, stop loss, take profit, re-entry, risk management, and position sizing techniques. Even some interesting fundamental and mass psychological aspects are incorporated.
Level 4 : script snippets or functions that do not disclose source code. Interesting element that can reveal market laws and work as raw material for indicators and strategies. If you find Level 1~2 scripts are helpful, Level 4 is a private version that took me far more efforts to develop.
Level 5 : indicator/strategy that do not disclose source code. private version of Level 3 script with my accumulated script processing skills or a large number of custom functions. I had a private function library built in past two years. Level 5 scripts use many of them to achieve private trading strategy.
[blackcat] L2 Ehlers Zero-lag EMACircumstance Remarks: Because of my carelessness, the script of the same name that I posted before was banned and hidden because the description contained content that violated the TradingView House Rule. After communicating with the MOD, I corrected the description and obtained permission to publish it again. I hereby declare. Sorry for the inconvenience!
Level: 2
Background
John F. Ehlers introuced Zero-lag EMA Indicator in Nov, 2010.
Function
In “Zero Lag (Well, Almost)” article, authors John Ehlers and Ric Way presented their zero-lag exponential moving average indicator and strategy. They have adapted their zero-lag EMA by extending the functionality in an additional chart indicator named “Zero-Lag EMA”. Labels were added so that the user can be alerted when a crossing of the averages occurs.
The authors created an error-correcting filter for an exponential moving average ( EMA ) that seeks to minimize the lag effect of increasing periods. Increasing the gain parameter from zero changes the filter from an EMA with lag to effectively zero lag (albeit with zero smoothing also). The crossover of these lines can be used to form a trading strategy, with the addition of some threshold value for the difference between the Price and error-correcting line.
Key Signal
ZLEMA ---> Zero-lag EMA fast line
Trigger ---> Zero-lag EMA slow line
Pros and Cons
100% John F. Ehlers definition translation, even variable names are the same. This help readers who would like to use pine to read his book.
Remarks
The 76th script for Blackcat1402 John F. Ehlers Week publication.
Readme
In real life, I am a prolific inventor. I have successfully applied for more than 60 international and regional patents in the past 12 years. But in the past two years or so, I have tried to transfer my creativity to the development of trading strategies. Tradingview is the ideal platform for me. I am selecting and contributing some of the hundreds of scripts to publish in Tradingview community. Welcome everyone to interact with me to discuss these interesting pine scripts.
The scripts posted are categorized into 5 levels according to my efforts or manhours put into these works.
Level 1 : interesting script snippets or distinctive improvement from classic indicators or strategy. Level 1 scripts can usually appear in more complex indicators as a function module or element.
Level 2 : composite indicator/strategy. By selecting or combining several independent or dependent functions or sub indicators in proper way, the composite script exhibits a resonance phenomenon which can filter out noise or fake trading signal to enhance trading confidence level.
Level 3 : comprehensive indicator/strategy. They are simple trading systems based on my strategies. They are commonly containing several or all of entry signal, close signal, stop loss, take profit, re-entry, risk management, and position sizing techniques. Even some interesting fundamental and mass psychological aspects are incorporated.
Level 4 : script snippets or functions that do not disclose source code. Interesting element that can reveal market laws and work as raw material for indicators and strategies. If you find Level 1~2 scripts are helpful, Level 4 is a private version that took me far more efforts to develop.
Level 5 : indicator/strategy that do not disclose source code. private version of Level 3 script with my accumulated script processing skills or a large number of custom functions. I had a private function library built in past two years. Level 5 scripts use many of them to achieve private trading strategy.
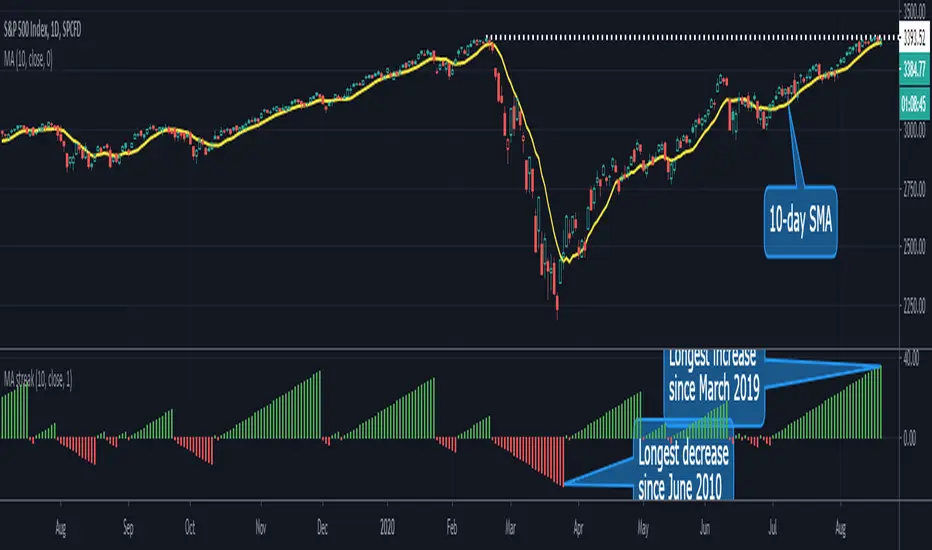
MA Streak Can Show When a Run Is Getting Long in the ToothMoving averages are one of the most common indicators in the world of technical analysis. And they’re often the ingredients of more complex indicators like MACD.
Today’s script shows how long prices have been moving in a given direction. Similar to our earlier Price Streak script, MA Streak counts the number of sessions that the average is rising or falling. It then plots the result in green (positive, rising) or red (negative, falling).
Because it uses a moving average instead of individual candles, this smooths out short-term noise to illustrate how long prices have been moving in a given direction.
Users can designate which price value (open, high, low, etc) to use under the Source input. They can also chose one of five moving average types. (See the code for a complete guide.)
Today’s chart shows that the S&P 500’s 10-day simple moving average (SMA) has been rising for 36 sessions. It’s the longest upside run since March 2019. Given the fact that the index is flirting with its pre-Covid highs, MA Streak may suggest the current rally is getting long in the tooth.
It's also noteworthy that the coronavirus correction in February and March saw the 10-day SMA drop for 24 straight sessions, which was its longest decline since June 2010.
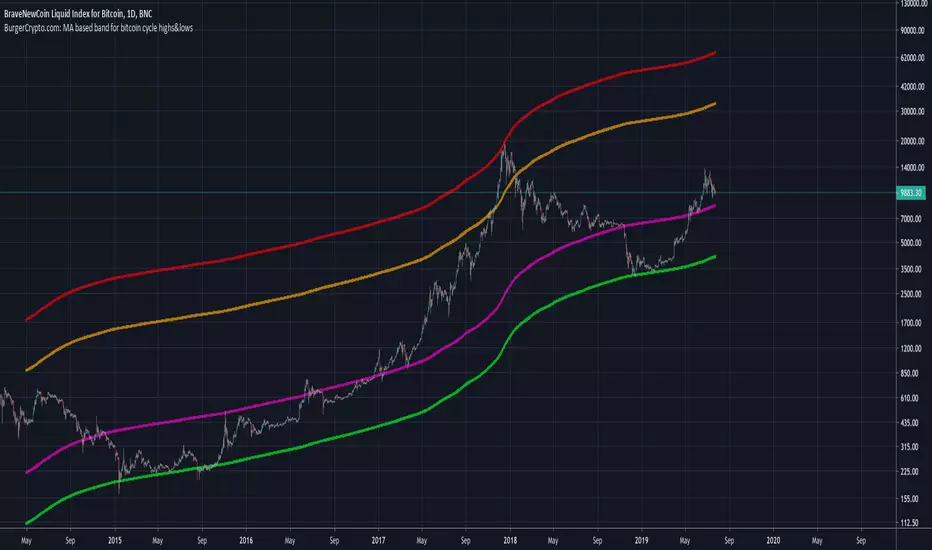
BurgerCrypto.com: MA based band for bitcoin cycle highs&lowsWarning: This script works only on a daily chart and only works for bitcoin charts with a long history. Best to be used on the BLX chart as it goes back to July 2010.
This script shows you the Moving Average with the length of a full bitcoin cycle, in which a cycle is defined as a period between two reward halvings; i.e. 210.000 blocks.
After data analysis in Python, I found that the average inter arrival time is a bit lower than the often communicated 10minutes; it's 9.46minutes, which makes the 210.000 block interval equal to 1379days.
The 1379d Moving Average seems to serve well as a support for the price of bitcoin over time and it's 4th 2^n multiple did a good job in catching the cycle tops.
If you like this indicator, please leave some claps for the Medium article in which I introduced this indicator:
medium.com
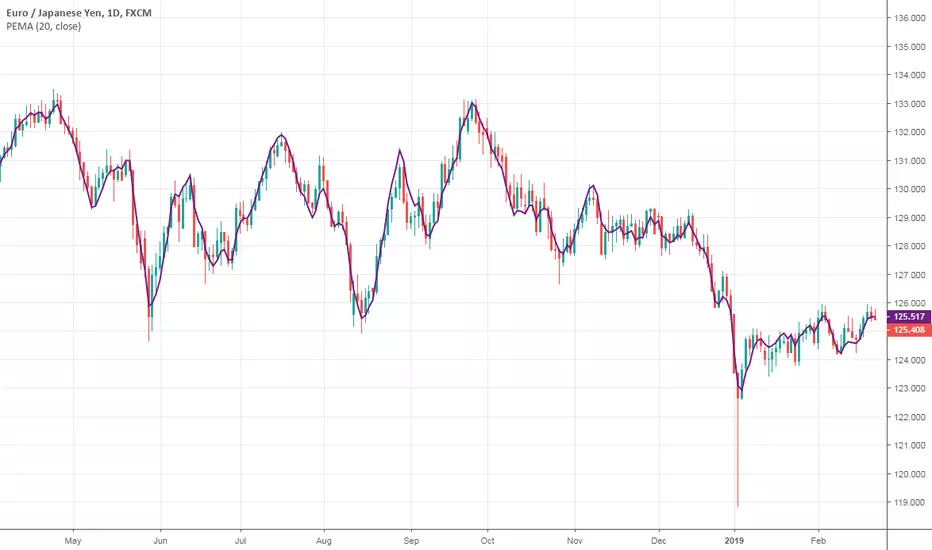
Pentuple Exponential Moving Average (PEMA)This type of moving average was originally developed by Bruno Pio in 2010. I just ported the original code from MetaTrader 5. The method uses a linear combination of EMA cascades to achieve better smoothness. Well, actually you can create your own X-uple EMA, but be sure that the combination' coefficients are valid.
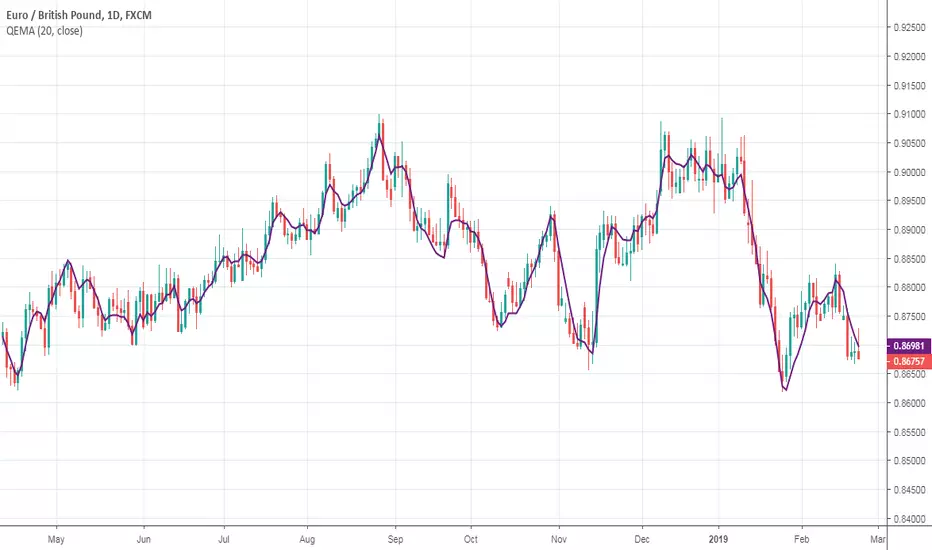
Quadruple Exponential Moving Average (QEMA)This type of moving average was originally developed by Bruno Pio in 2010. I just ported the original code from MetaTrader 5.
Creating long term bitcoin data
One of the problems, with bitcoin, is that we miss long term bitcoin data. There is not a single source from which to gather the value of bitcoin in any moment from it's inception. Or at least from when it was first exchanged into exchanges. If you look at coinmarketcap the data go back to the 28 apr 2013. But mtgox started in July 2010. If you go to yahoo, you will be able to gather data, but once you start working with this data you soon find out how poor is it. Basically it follows mtgox data while mtgox was alive, and then switched to some other exchange. But this means that we see a sudden jump in data which makes any indicator go wild. Basically it's really difficult to gather long term data on bitcoin. Also consider that mtgox did not just "go away" when it stopped trading. But in the database here it is still present with the fixed exchange rate of when it stopped.
So I tried to create the data we need. How? By taking three exchanges, and taking the median between them. The three exchanges I took were MTGOX: , BITFINEX: and KRAKEN: XBTUSD . We cannot avoid mtgox because it's the only source of data for the first years. But then as soon as the other exchanges come in we are going to use the median between them.
The indicator must be overlaid on another chart. And I use the forex usdeur which I then hide (If someone has a better idea, maybe something which is open 24/7, I would be happy to hear it).

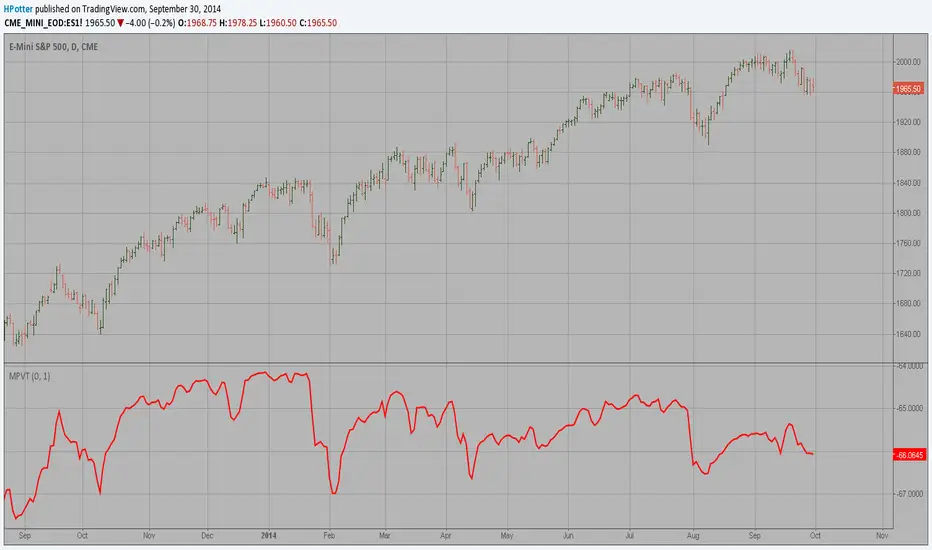
Modified Price-Volume Trend Indicator The related article is copyrighted material from Stocks & Commodities Apr 2010.
BTC HistoricMerged Bitstamp and Mt Gox precrash data.
To use you will need to use any chart with a start time before 7/2010. You will need this to see all the data otherwise it will get cut off. Publishing ideas using this indicator will spam some other symbol so I would not recommend doing so (sorry XAUUSD).
Click the "eye" button next to the primary security to hide it.
Make sure the indicator scale is set to "Right".
Right click on the right axis, and uncheck "Scale Series Only"
Note: Since this is going to be overlayed onto another chart it will likely be missing weekend data. If anyone knows of a current chart that is 24/7 that has data prior to July 2011 please leave a comment.
You can tweak the price weight between Gox and Stamp and the point when the data starts to blend to the time when Gox went off a cliff.
- Key date values:
1377 is Jan-6-2014
1385 is Jan-15-2014 (default)
1337 is about the ATH (coincidentally)
1192 is July-5-2013
--- Custom indicators for historic data:
I updated to the latest versions
- BTC Historic RSI
pastebin.com
created by @debani (www.tradingview.com)
original here:
- BTC Histroric Willy
pastebin.com
original indicator by @CRInvestor (www.tradingview.com)
created by @flibbr (www.tradingview.com)
original here:
- BTC Historic Ichimoku
pastebin.com
thanks to @flibbr, @debani for the indicators
Let me know if you have questions, comments.

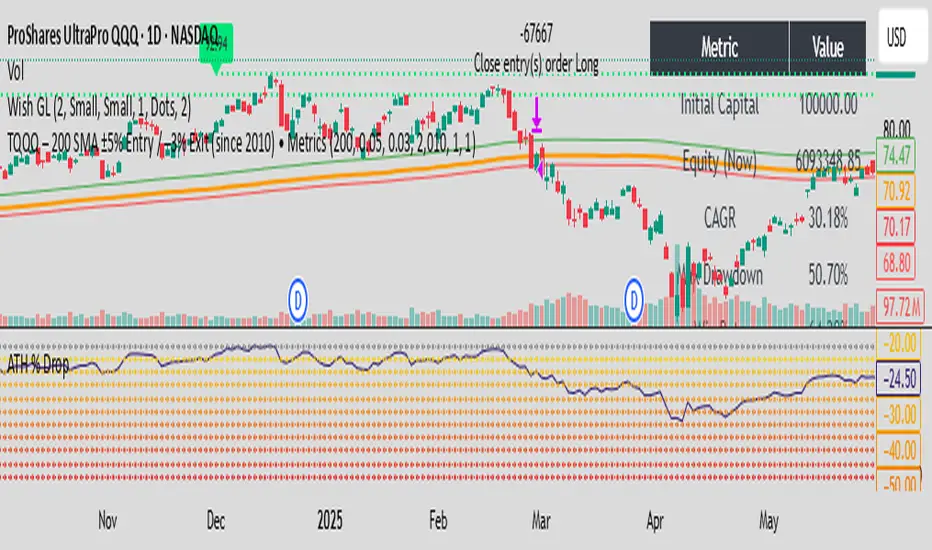
TQQQ – 200 SMA ±5% Entry / –3% Exit (since 2010) • Metrics by DE✅ In plain words:
You only buy TQQQ when it’s trading 5% above its 200-day SMA (a sign of strong uptrend momentum).
You stay long as long as the price holds above 3% below the 200-day SMA.
If price falls below that lower threshold, you exit to limit drawdown.
The strategy is designed to catch strong uptrends while cutting losses early.
Fury by Tetrad on TESLA v2Fury by Tetrad — TSLA v2 (Free Version)
📊 Fury v2 on TSLA — Financial Snapshot
First trade: August 11, 2010
Last trade: September 5, 2025
Net Profit: $10,549.10 (≈ +10,549%)
Gross Profit: $10,554.36
Gross Loss: $5.26
Commission Paid: $86.95
⚖️ Risk/Return Ratios
Sharpe Ratio: 0.42
Sortino Ratio: 17.63
Profit Factor: 2005.38
🔄 Trade Statistics
Total Trades: 37
Winning Trades: 37
Losing Trades: 0
Win Rate: 100%
Fury is a momentum-reversion hybrid designed for Tesla (TSLA) on higher-liquidity timeframes. It combines Bollinger Bands (signal extremes) with RSI (exhaustion filter) to time mean-reversion pops/drops, then exits via price multipliers or optional time-based stops. A Market Direction toggle (Market Neutral / Long Only / Short Only) lets you align with macro bias or risk constraints. Intrabar simulation is enabled for realistic stop/limit behavior, and labeled entries/exits improve visual auditability.
How it works
Entries:
• Long when price pierces lower band and RSI is below the long threshold.
• Short when price pierces upper band and RSI is above the short threshold.
Exits:
• Profit targets via entry×multiplier (independent for long/short).
• Optional price-based stop factors per side.
• Optional time stop (N days) to cap trade duration.
Controls:
• Market Direction switch (Neutral / Long Only / Short Only).
• Tunable BB length/multiplier, RSI length/thresholds, exit multipliers, stops.
Intended use
Swing or position trading TSLA; can be adapted to other high-beta equities with parameter retuning. Use on liquid timeframes and validate with robust out-of-sample testing.
Disclaimers
Backtests are approximations; past performance ≠ future results. Educational use only. Not financial advice.
Stay connected
Follow on TradingView for updates • Telegram: t.me • Website: tetradprotocol.com

Bitcoin Expectile Model [LuxAlgo]The Bitcoin Expectile Model is a novel approach to forecasting Bitcoin, inspired by the popular Bitcoin Quantile Model by PlanC. By fitting multiple Expectile regressions to the price, we highlight zones of corrections or accumulations throughout the Bitcoin price evolution.
While we strongly recommend using this model with the Bitcoin All Time History Index INDEX:BTCUSD on the 3 days or weekly timeframe using a logarithmic scale, this model can be applied to any asset using the daily timeframe or superior.
Please note that here on TradingView, this model was solely designed to be used on the Bitcoin 1W chart, however, it can be experimented on other assets or timeframes if of interest.
🔶 USAGE
The Bitcoin Expectile Model can be applied similarly to models used for Bitcoin, highlighting lower areas of possible accumulation (support) and higher areas that allow for the anticipation of potential corrections (resistance).
By default, this model fits 7 individual Expectiles Log-Log Regressions to the price, each with their respective expectile ( tau ) values (here multiplied by 100 for the user's convenience). Higher tau values will return a fit closer to the higher highs made by the price of the asset, while lower ones will return fits closer to the lower prices observed over time.
Each zone is color-coded and has a specific interpretation. The green zone is a buy zone for long-term investing, purple is an anomaly zone for market bottoms that over-extend, while red is considered the distribution zone.
The fits can be extrapolated, helping to chart a course for the possible evolution of Bitcoin prices. Users can select the end of the forecast as a date using the "Forecast End" setting.
While the model is made for Bitcoin using a log scale, other assets showing a tendency to have a trend evolving in a single direction can be used. See the chart above on QQQ weekly using a linear scale as an example.
The Start Date can also allow fitting the model more locally, rather than over a large range of prices. This can be useful to identify potential shorter-term support/resistance areas.
🔶 DETAILS
🔹 On Quantile and Expectile Regressions
Quantile and Expectile regressions are similar; both return extremities that can be used to locate and predict prices where tops/bottoms could be more likely to occur.
The main difference lies in what we are trying to minimize, which, for Quantile regression, is commonly known as Quantile loss (or pinball loss), and for Expectile regression, simply Expectile loss.
You may refer to external material to go more in-depth about these loss functions; however, while they are similar and involve weighting specific prices more than others relative to our parameter tau, Quantile regression involves minimizing a weighted mean absolute error, while Expectile regression minimizes a weighted squared error.
The squared error here allows us to compute Expectile regression more easily compared to Quantile regression, using Iteratively reweighted least squares. For Quantile regression, a more elaborate method is needed.
In terms of comparison, Quantile regression is more robust, and easier to interpret, with quantiles being related to specific probabilities involving the underlying cumulative distribution function of the dataset; on the other expectiles are harder to interpret.
🔹 Trimming & Alterations
It is common to observe certain models ignoring very early Bitcoin price ranges. By default, we start our fit at the date 2010-07-16 to align with existing models.
By default, the model uses the number of time units (days, weeks...etc) elapsed since the beginning of history + 1 (to avoid NaN with log) as independent variable, however the Bitcoin All Time History Index INDEX:BTCUSD do not include the genesis block, as such users can correct for this by enabling the "Correct for Genesis block" setting, which will add the amount of missed bars from the Genesis block to the start oh the chart history.
🔶 SETTINGS
Start Date: Starting interval of the dataset used for the fit.
Correct for genesis block: When enabled, offset the X axis by the number of bars between the Bitcoin genesis block time and the chart starting time.
🔹 Expectiles
Toggle: Enable fit for the specified expectile. Disabling one fit will make the script faster to compute.
Expectile: Expectile (tau) value multiplied by 100 used for the fit. Higher values will produce fits that are located near price tops.
🔹 Forecast
Forecast End: Time at which the forecast stops.
🔹 Model Fit
Iterations Number: Number of iterations performed during the reweighted least squares process, with lower values leading to less accurate fits, while higher values will take more time to compute.

Combo 2/20 EMA & Bandpass Filter by TamarokDescription:
This strategy combines a 2/20 exponential moving average (EMA) crossover with a custom bandpass filter to generate buy and sell signals.
Use the Fast EMA and Slow EMA inputs to adjust trend sensitivity, and the Bandpass Filter Length, Delta, and Zones to fine-tune momentum turns.
Signals occur when both EMA and BPF agree in direction, with optional reversal and time filters.
How to use:
1. Add the script to your chart in TradingView.
2. Adjust the EMA and BP Filter parameters to match your asset’s volatility.
3. Enable ‘Reverse Signals’ to trade counter-trend, or use the time filter to limit sessions.
4. Set alerts on Long Alert and Short Alert for automated notifications.
Inspiration:
Based on HPotter’s original combo strategy (Stocks & Commodities Mar 2010).
Updated to Pine Script v6 with streamlined code and alerts.
WARNING:
For purpose educate only

Bitcoin Power Law [LuxAlgo]The Bitcoin Power Law tool is a representation of Bitcoin prices first proposed by Giovanni Santostasi, Ph.D. It plots BTCUSD daily closes on a log10-log10 scale, and fits a linear regression channel to the data.
This channel helps traders visualise when the price is historically in a zone prone to tops or located within a discounted zone subject to future growth.
🔶 USAGE
Giovanni Santostasi, Ph.D. originated the Bitcoin Power-Law Theory; this implementation places it directly on a TradingView chart. The white line shows the daily closing price, while the cyan line is the best-fit regression.
A channel is constructed from the linear fit root mean squared error (RMSE), we can observe how price has repeatedly oscillated between each channel areas through every bull-bear cycle.
Excursions into the upper channel area can be followed by price surges and finishing on a top, whereas price touching the lower channel area coincides with a cycle low.
Users can change the channel areas multipliers, helping capture moves more precisely depending on the intended usage.
This tool only works on the daily BTCUSD chart. Ticker and timeframe must match exactly for the calculations to remain valid.
🔹 Linear Scale
Users can toggle on a linear scale for the time axis, in order to obtain a higher resolution of the price, (this will affect the linear regression channel fit, making it look poorer).
🔶 DETAILS
One of the advantages of the Power Law Theory proposed by Giovanni Santostasi is its ability to explain multiple behaviors of Bitcoin. We describe some key points below.
🔹 Power-Law Overview
A power law has the form y = A·xⁿ , and Bitcoin’s key variables follow this pattern across many orders of magnitude. Empirically, price rises roughly with t⁶, hash-rate with t¹² and the number of active addresses with t³.
When we plot these on log-log axes they appear as straight lines, revealing a scale-invariant system whose behaviour repeats proportionally as it grows.
🔹 Feedback-Loop Dynamics
Growth begins with new users, whose presence pushes the price higher via a Metcalfe-style square-law. A richer price pool funds more mining hardware; the Difficulty Adjustment immediately raises the hash-rate requirement, keeping profit margins razor-thin.
A higher hash rate secures the network, which in turn attracts the next wave of users. Because risk and Difficulty act as braking forces, user adoption advances as a power of three in time rather than an unchecked S-curve. This circular causality repeats without end, producing the familiar boom-and-bust cadence around the long-term power-law channel.
🔹 Scale Invariance & Predictions
Scale invariance means that enlarging the timeline in log-log space leaves the trajectory unchanged.
The same geometric proportions that described the first dollar of value can therefore extend to a projected million-dollar bitcoin, provided no catastrophic break occurs. Institutional ETF inflows supply fresh capital but do not bend the underlying slope; only a persistent deviation from the line would falsify the current model.
🔹 Implications
The theory assigns scarcity no direct role; iterative feedback and the Difficulty Adjustment are sufficient to govern Bitcoin’s expansion. Long-term valuation should focus on position within the power-law channel, while bubbles—sharp departures above trend that later revert—are expected punctuations of an otherwise steady climb.
Beyond about 2040, disruptive technological shifts could alter the parameters, but for the next order of magnitude the present slope remains the simplest, most robust guide.
Bitcoin behaves less like a traditional asset and more like a self-organising digital organism whose value, security, and adoption co-evolve according to immutable power-law rules.
🔶 SETTINGS
🔹 General
Start Calculation: Determine the start date used by the calculation, with any prior prices being ignored. (default - 15 Jul 2010)
Use Linear Scale for X-Axis: Convert the horizontal axis from log(time) to linear calendar time
🔹 Linear Regression
Show Regression Line: Enable/disable the central power-law trend line
Regression Line Color: Choose the colour of the regression line
Mult 1: Toggle line & fill, set multiplier (default +1), pick line colour and area fill colour
Mult 2: Toggle line & fill, set multiplier (default +0.5), pick line colour and area fill colour
Mult 3: Toggle line & fill, set multiplier (default -0.5), pick line colour and area fill colour
Mult 4: Toggle line & fill, set multiplier (default -1), pick line colour and area fill colour
🔹 Style
Price Line Color: Select the colour of the BTC price plot
Auto Color: Automatically choose the best contrast colour for the price line
Price Line Width: Set the thickness of the price line (1 – 5 px)
Show Halvings: Enable/disable dotted vertical lines at each Bitcoin halving
Halvings Color: Choose the colour of the halving lines
