20 and 200 SMA indicators with unnecessary additionsAs many of you know, world famous Oliver Velez uses the simple 20 and 200 simple moving averages on 2 min time frame with price actions above or below these key SMAs for day/scalp trading involving narrow state versus wide state trend or anti-trend methods. The 20 SMA line uses different colors to indicate whether it is going up or down.
Against Oliver's advice, I also unnecessarily added boll bands on the 200 SMA, two +/- percent lines off 200 SMA to measure how far away prices are from the 200 SMA. I also added 10 ema cross 20 SMA cross signal, MACD line up /down, RSI crossover RSI SMA for those are want to make things complicated or might find they helpful. You can turn off all these ideally to Keep It Simple.
Again trading success is 80% psychology and 20% a good trading system plus risk management. Good luck.
Wyszukaj w skryptach "200元+股票大盘"

Stage 2 Trend Signals (10/21/50/200) *Trend-following indicator designed to focus on **strong Stage 2 uptrends**, not bottom-fishing or chop.
* Plots **10 EMA, 21 EMA, 50 SMA, and 200 SMA** as core moving averages.
* Uses a **trend filter** so buy signals only occur when:
* Price is above the **50 SMA** (and optionally above the **200 SMA**), and
* The **50 SMA is above the 200 SMA**, reflecting classic Stage 2 alignment.
* Prints a **green “BUY” label** when the **10 EMA crosses above the 21 EMA** within this bullish environment, signaling momentum turning up in an established uptrend.
* Prints a **red “SELL” label** when the **10 EMA crosses below the 21 EMA** or when price is in a bearish context and closes below the 21 EMA, prompting risk reduction as trend/momentum weaken.
* Light **green background shading** highlights periods where the bullish Stage 2 conditions are active (“trend-on” zones).
* Works on **any timeframe**; commonly used on:
* **Weekly charts** for big-picture trend confirmation.
* **Daily charts** for swing entries, exits, and active trade management.

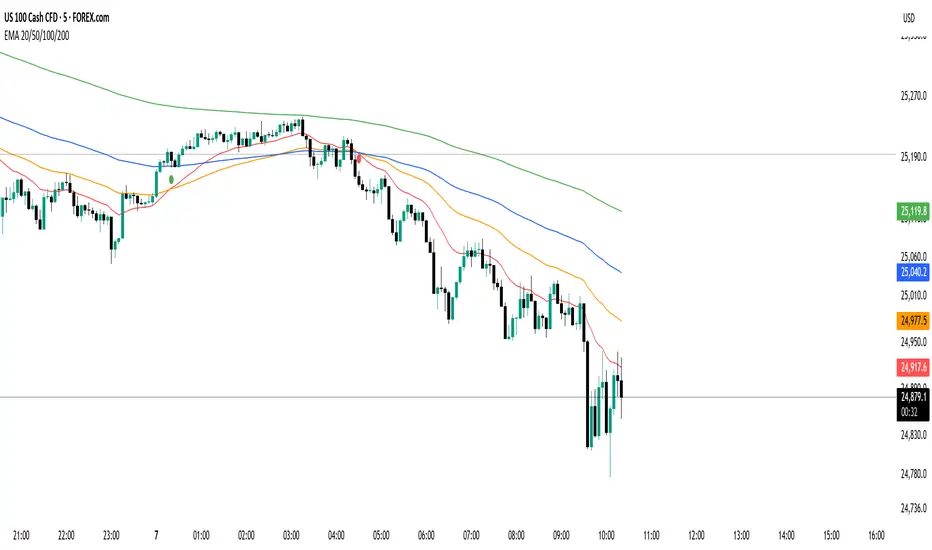
MA 9/21/50/100/200//@version=5
indicator("MA 9/21/50/100/200", overlay=true)
ma9 = ta.sma(close, 9)
ma21 = ta.sma(close, 21)
ma50 = ta.sma(close, 50)
ma100 = ta.sma(close, 100)
ma200 = ta.sma(close, 200)
plot(ma9, color=color.new(color.yellow, 0), title="MA 9")
plot(ma21, color=color.new(color.orange, 0), title="MA 21")
plot(ma50, color=color.new(color.blue, 0), title="MA 50")
plot(ma100, color=color.new(color.green, 0), title="MA 100")
plot(ma200, color=color.new(color.red, 0), title="MA 200")

Strict Weekly 50/200 WMA Signals True Weekly Only-Strict Weekly 50/200 WMA Signals True Weekly Only => also on other time frames than weekly (like daily, etc.) always indicates the indicators based on the weekly chart
-especially useful for Crypto
-gives buy and sell signals when the 200 WMA or the 50 WMA are crossed
-typically above the 50 WMA indicates a bull market
-reaching below the 200 WMA indicates a bear market and typically for investors with a longer time frame (>2-4 years) a good entry point

EMA 20/50/100/200 Trader IkkaEMA 20/50/100/200 📊 + Crossover Alerts 🔔 Trader Ikka
This indicator plots four key Exponential Moving Averages (EMA 20, 50, 100, and 200) to help identify trends.
It also detects and marks bullish 🟢 and bearish 🔴 crossovers between the EMA 20 and EMA 50, signaling potential trend reversals or continuations.
✨ Features:
📊 Plots EMA 20, 50, 100, and 200 with color-coded lines
🟢🔴 Highlights bullish and bearish crossovers between EMA 20 & EMA 50
🔔 Built-in alert conditions for automated notifications
⚡ Useful for identifying momentum shifts and entry/exit zones
dO / wO / mO + MA 50/200 + PrevDay H/L Description
This indicator plots key reference levels used by professional traders:
Daily Open (dO)
Weekly Open (wO)
Monthly Open (mO)
Previous Day High (pdH) and Previous Day Low (pdL)
Moving Averages: 50 & 200 SMA
Each level is drawn as a clean dotted white line with a fixed label directly on the price chart.
All levels can be individually toggled on or off via checkboxes in the settings panel.
The pdH/pdL lines start exactly from the candles that created them, providing clear structure for breakout, retracement, and liquidity analysis.
The 50/200 SMA are included for long-term trend context.
This tool is designed for traders who rely on multi-timeframe structure and precision levels for both intraday and swing strategies.
Features
Toggle visibility for dO, wO, mO, pdH, and pdL
Accurate placement of previous day levels
Lightweight and responsive
Clean minimal visual design
Supports any symbol and timeframe
Usage Notes
Perfect for confluence-based trading:
Combine pdH/pdL with session opens to identify key liquidity zones
Use SMA 50/200 for directional bias
Works on crypto, forex, indices, and equities

Goldencross & Deathcross Highlights (50/200 SMA) - Fixed dailyThis indicator visualizes major long-term trend shifts in the market
by tracking the daily 50-day and 200-day Simple Moving Averages (SMAs)
— regardless of your current chart timeframe.
🟩 A green flash (Golden Cross) appears when the 50-day SMA crosses
above the 200-day SMA — signaling potential long-term bullish momentum.
🟥 A red flash (Death Cross) appears when the 50-day SMA crosses
below the 200-day SMA — suggesting potential long-term bearish pressure.
Unlike typical SMA overlays, this script:
• Pulls daily data directly (fixed to daily timeframe)
• Works cleanly on any chart timeframe (5m, 1h, 4h, etc.)
• Avoids clutter by hiding moving average lines
• Shows only short, subtle flashes and one clean marker per event

FUMO MA Cross Matrix 9/21/50/100/200 FUMO MA Cross Matrix is a flexible and advanced indicator designed for traders who rely on moving average crossovers as part of their strategy.
🔹 Key Features:
Supports 5 types of Moving Averages: EMA, SMA, SMMA (RMA), WMA, HMA.
Includes 5 standard MAs: 9, 21, 50, 100, 200 (toggle on/off individually).
Choose which MA crosses to monitor (9×21, 21×50, 50×100, 100×200, and 6 extended combinations).
On-chart signals (labels) when crosses occur.
Alerts system for every selected cross and also summary alerts (“Any Cross Up/Down”).
Option to trigger signals only on confirmed bars (no repaint).
Fully adjustable label visibility and signal style.
🔹 Use Cases:
Detect trend shifts (short-term vs long-term).
Build scalping, swing, or position trading strategies.
Combine with price action or volume analysis for stronger setups.
Quickly react to Golden Cross and Death Cross events.
🔹 How to Use:
Select your preferred MA type (EMA, SMA, etc.).
Enable the MAs (9, 21, 50, 100, 200) you want to plot.
Choose which crossovers to track in the settings.
Enable/disable on-chart labels for better visualization.
Set up alerts:
“CROSS UP/DOWN X>Y” for specific pairs.
“ANY CROSS UP/DOWN” for aggregated signals.
📌 Example Alerts
MA Cross UP 9>21 on BTCUSDT 15m @ 65432
Any selected MA cross DOWN on AAPL 1D @ 195.2
Triple EMA with Alert | 21, 50, 200 EMA Strategy + Crossover🚀 Boost your trading edge with the Triple EMA with Alert — a professional-grade indicator designed for traders who want precise, real-time trend confirmation across short, medium, and long-term market movements.
🔹 What Makes This Indicator Powerful?
Three Adjustable EMAs — Default: 21, 50, 200 periods (fully customizable 1–200).
Toggle Visibility — Show only the EMAs you need for your strategy.
Real-Time Alerts — Get notified instantly when:
EMA 1 crosses EMA 2 → short-term trend change.
EMA 2 crosses EMA 3 → medium-term trend alignment.
Works on All Markets & Timeframes — Forex, crypto, stocks, indices, and commodities.
🔹 Why Traders Love It
📊 Multi-Timeframe Trend Confirmation — Filter out noise and trade with market momentum.
🎯 Accurate Crossover Signals — Identify bullish and bearish momentum shifts.
🔔 Hands-Free Monitoring — Alerts keep you informed even when you’re away from the chart.
💡 Versatile for Any Strategy — Perfect for scalping, swing trading, or long-term investing.
🔹 How to Use It
Bullish Signal — EMA 1 crossing above EMA 2 or EMA 2 crossing above EMA 3.
Bearish Signal — EMA 1 crossing below EMA 2 or EMA 2 crossing below EMA 3.
Combine with support/resistance zones, RSI, or volume for higher probability trades.
📌 Pro Tip:
Use EMA 21 & EMA 50 for momentum confirmation.
Use EMA 200 to spot the overall market direction.
If you’re serious about trend trading with precision, the Triple EMA with Alert will keep you one step ahead of market moves — no more missed entries or exits.

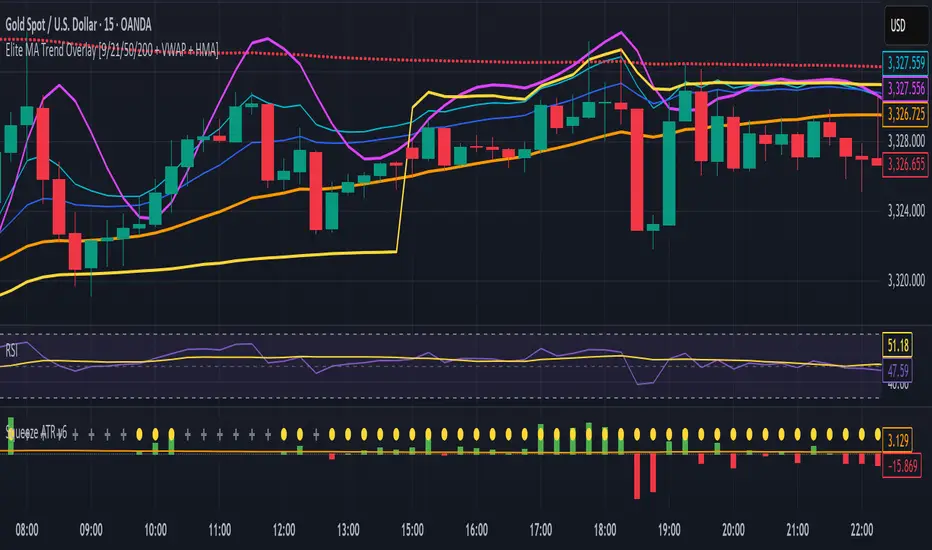
Elite MA Trend Overlay [9/21/50/200 + VWAP + HMA]🔍 What It Is:
The Elite MA Trend Overlay is a professional-grade moving average system built for day traders, scalpers, and swing traders who need clear, visual trend confirmation and precise entry zones across all timeframes.
This overlay combines 5 industry-proven tools into one compact indicator for sniper-level decision making:
EMA 9 – Entry momentum
EMA 21 – Microstructure guide
EMA 50 – Trend bias filter
EMA 200 – Institutional macro direction
VWAP – Intraday fair value (used by pros)
Hull MA (HMA) – Early shift detector
It also features auto-detected trend zones using color-coded background shading to help you instantly know if the market is in a bullish or bearish regime.
🧠 How It Works:
The script dynamically plots the short-term to long-term moving averages to reflect real-time market structure. When all EMAs are aligned in one direction, a colored background highlights the dominant trend:
✅ Green background = Bullish trend (9 > 21 > 50 > 200)
🔻 Red background = Bearish trend (9 < 21 < 50 < 200)
The VWAP line acts as a magnet and decision zone—traders use it for intraday entries or exits. The Hull Moving Average adapts quickly to price shifts, making it perfect for spotting early reversals before the EMAs cross.
🎯 Why It Helps Traders Succeed:
This indicator:
Removes guesswork: Know instantly if you’re in a strong trend or chop zone.
Filters bad trades: Avoid entering against structure or into volatility traps.
Improves timing: Use pullbacks to EMAs or Hull MA flips for sniper entries.
Works across timeframes: From scalping 1-minute to swing trading daily charts.
Whether you're trading gold, forex, stocks, or crypto — this overlay gives you clean, professional structure that keeps you disciplined and sharp.
⚙️ Features:
On/off toggles for VWAP & Hull MA
Minimalist, clutter-free plotting
Auto background color zones
Supports Pine Script v6 (latest version)
👑 Recommended Use:
Confirm trend with background + EMA alignment
Enter on pullbacks to EMA 21 or 50
Use Hull MA or RSI for early reversal detection
Exit at VWAP reversion or trend exhaustion
💬 “Structure is everything. Trade with the flow, not against it.”
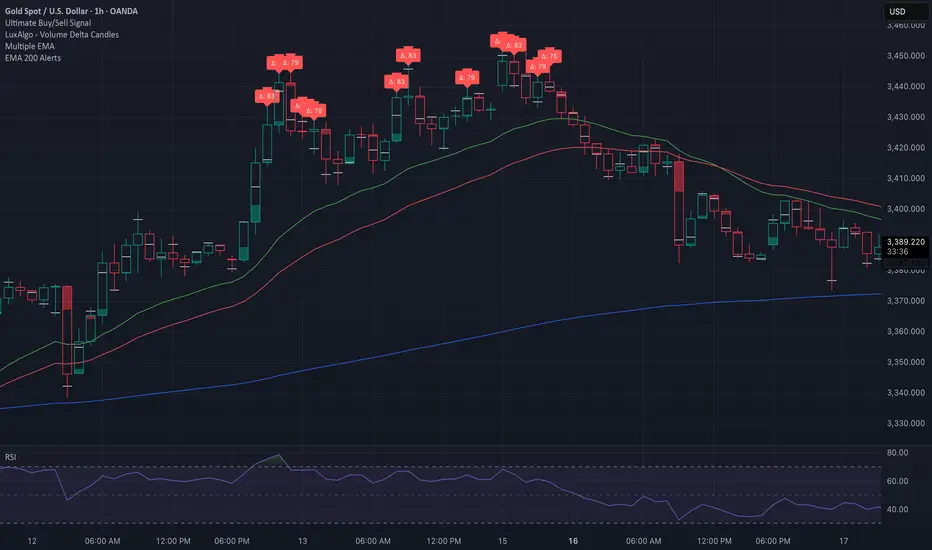
EMA 200 Price Deviation Alerts (1H Only)This script monitors the price deviation from the 200-period Exponential Moving Average (EMA) exclusively on the 1-hour chart. It generates alerts when the absolute difference between the current price and the EMA 200 exceeds a user-defined threshold (default: 65).
Features:
Works only on 1-hour (60-minute) charts to avoid false signals on other timeframes.
Customizable deviation threshold via script input.
Visual display of the 200 EMA on the chart.
Alert system to notify when price deviates significantly above or below the EMA.
Buy/Sell arrows shown when conditions are met:
Sell arrow appears when price is above the EMA and deviation exceeds threshold.
Buy arrow appears when price is below the EMA and deviation exceeds threshold.
Use this tool to identify potential overextended price moves relative to long-term trend support or resistance on the 1H timeframe.
Triple EMA Bundle (50, 100, 200) - Osbrah CRG📈 Advanced EMA Indicator – 50/100/200
This custom-built indicator displays the 50, 100, and 200 Exponential Moving Averages (EMAs), giving traders a powerful visual tool to identify key trend directions, dynamic support/resistance levels, and potential market reversals.
Designed for both beginners and advanced users, this tool offers extensive customization options:
* Select which EMAs to display (50, 100, 200)
* Adjust colors, line styles, and thickness
* Choose between different price sources (close, open, hl2, etc.)
* Set custom EMA lengths to fit your strategy
Use Cases:
* Spot trend direction and strength at a glance
* Identify key zones of support and resistance
* Confirm entries/exits based on EMA crossovers or rejections
* Align your trades with higher timeframe trends
Whether you're a swing trader or a scalper, this indicator helps you stay in sync with the market by bringing clarity to long-term momentum zones.
HMA 200 + EMA 20 Crossover StrategyThis strategy combines a long-term trend filter using the Hull Moving Average (HMA 200) with a short-term entry trigger using the Exponential Moving Average (EMA 20).
📈 Entry Logic:
Buy Entry: When price is above the HMA 200 and crosses above the EMA 20.
Sell Entry: When price is below the HMA 200 and crosses below the EMA 20.
The strategy closes the current position and reverses on the opposite signal.
⚙️ Strategy Settings (Backtest Configuration):
Position size: 10% of equity per trade
Commission: 0.1% per trade (to simulate broker fees)
Slippage: 2 ticks (to reflect realistic fill conditions)
✅ Purpose:
This script is designed to identify high-probability trades in the direction of the overall trend, avoiding whipsaw conditions. It is useful for traders looking for a dynamic crossover-based system that filters trades based on longer-term momentum.
🔎 Make sure to test across multiple assets and timeframes. For best results, apply this strategy to liquid trending markets like major FX pairs, indices, or high-cap stocks.

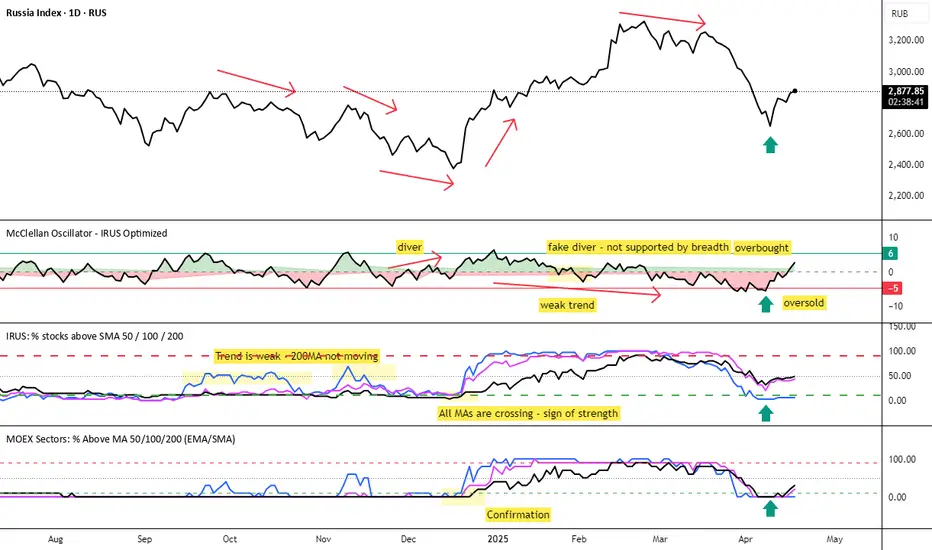
MOEX Sectors: % Above MA 50/100/200 (EMA/SMA)🧠 Name:
MOEX Sectors: % Above MA 50/100/200 (EMA/SMA)
📋 Description (for TradingView “Description” tab):
This indicator shows the percentage of Moscow Exchange sectoral indices trading above the selected moving average (SMA or EMA) with periods of 50, 100, or 200.
It uses 10 official MOEX sector indices:
MOEXOG (Oil & Gas)
MOEXCH (Chemicals)
MOEXMM (Metals & Mining)
MOEXTN (Transport)
MOEXCN (Consumer)
MOEXFN (Financials)
MOEXTL (Telecom)
MOEXEU (Utilities)
MOEXIT (IT)
MOEXRE (Real Estate)
The indicator plots up to 3 lines representing the % of sectors trading above MA 50, 100, and/or 200. The MA type is user-selectable: EMA (default) or SMA.
Horizontal reference levels (90, 50, 10) help interpret market conditions:
🔼 >90% — Overbought zone, potential market exhaustion
⚖️ ~50% — Neutral state
🔽 <10% — Oversold zone, possible rebound
📈 How to Use in Strategy:
✅ 1. Trend Filter
If >50% of sectors are above MA 200 → market in long-term uptrend
If <50% → avoid long bias, bearish regime likely
✅ 2. Bottom Detection
When <10% of sectors are above MA 200, the market is heavily oversold — often a bottoming signal
✅ 3. Trend Confirmation
If the main index is rising and % of sectors above MA is growing, the trend is supported by breadth
If the index rises while breadth declines → bearish divergence
✅ 4. Contrarian Setups
>90% of sectors above MA 50 → market may be overheated, watch for pullback
<20% above MA 50 → potential local bottom
⚙️ Tips:
Overlay this indicator on the IMOEX index chart to detect narrow leadership
Combine with other breadth metrics or RSI on the index
Use the EMA/SMA toggle to fine-tune sensitivity
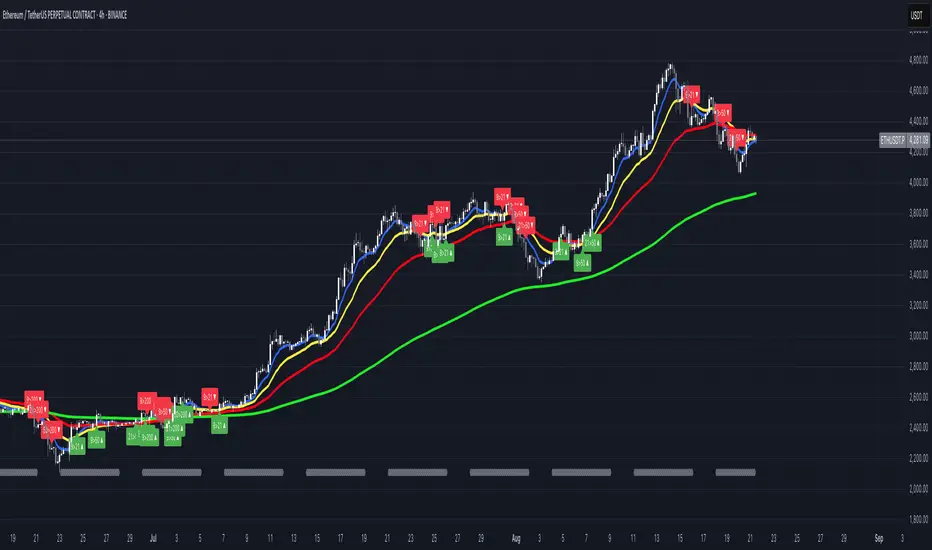
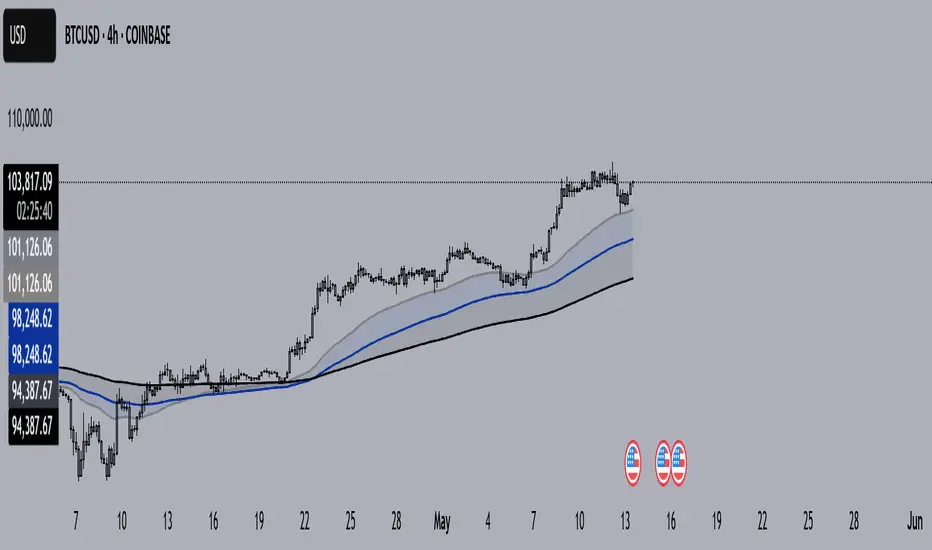
MBAND 200 4H BTC/USDT - By MGS-TradingMBAND 200 4H BTC/USDT with RSI and Volume by MGS-Trading: A Neural Network-Inspired Indicator
Introduction:
The MBAND 200 4H BTC/USDT with RSI and Volume represents a groundbreaking achievement in the integration of artificial intelligence (AI) into cryptocurrency market analysis. Developed by MGS-Trading, this indicator is the culmination of extensive research and development efforts aimed at leveraging AI's power to enhance trading strategies. By synthesizing neural network concepts with traditional technical analysis, the MBAND indicator offers a dynamic, multi-dimensional view of the market, providing traders with unparalleled insights and actionable signals.
Innovative Approach:
Our journey to create the MBAND indicator began with a simple question: How can we mimic the decision-making prowess of a neural network in a trading indicator? The answer lay in the weighted aggregation of Exponential Moving Averages (EMAs) from multiple timeframes, each serving as a unique input akin to a neuron in a neural network. These weights are not arbitrary; they were painstakingly optimized through backtesting across various market conditions to ensure they reflect the significance of each timeframe’s contribution to overall market dynamics.
Core Features:
Neural Network-Inspired Weights: The heart of the MBAND indicator lies in its AI-inspired weighting system, which treats each timeframe’s EMA as an input node in a neural network. This allows the indicator to process complex market data in a nuanced and sophisticated manner, leading to more refined and informed trading signals.
Multi-Timeframe EMA Analysis: By analyzing EMAs from 15 minutes to 3 days, the MBAND indicator captures a comprehensive snapshot of market trends, enabling traders to make informed decisions based on a broad spectrum of data.
RSI and Volume Integration: The inclusion of the Relative Strength Index (RSI) and volume data adds layers of confirmation to the signals generated by the EMA bands. This multi-indicator approach helps in identifying high-probability setups, reinforcing the neural network’s concept of leveraging multiple data points for decision-making.
Usage Guidelines:
Signal Interpretation: The MBAND bands provide a visual representation of the market’s momentum and direction. A price moving above the upper band signals strength and potential continuation of an uptrend, while a move below the lower band suggests weakness and a possible downtrend.
Overbought/Oversold Conditions: The RSI component identifies when the asset is potentially overbought (>70) or oversold (<30). Traders should watch for these conditions near the MBAND levels for potential reversal opportunities.
Volume Confirmation: An increase in volume accompanying a price move towards or beyond an MBAND level serves as confirmation of the strength behind the move. This can indicate whether a breakout is likely to sustain or if a reversal has substantial backing.
Strategic Entry and Exit Points: Combine the MBAND readings with RSI and volume indicators to pinpoint strategic entry and exit points. For example, consider entering a long position when the price is near the lower MBAND, RSI indicates oversold conditions, and there is a notable volume increase.
About MGS-Trading:
At MGS-Trading, we are passionate about harnessing the transformative power of AI to revolutionize cryptocurrency trading. Our indicators and tools are designed to provide traders with advanced analytics and insights, drawing on the latest AI techniques and methodologies. The MBAND 200 4H BTC/USDT with RSI and Volume indicator is a prime example of our commitment to innovation, offering traders a sophisticated, AI-enhanced tool for navigating the complexities of the cryptocurrency markets.
Disclaimer:
The MBAND indicator is provided for informational purposes only and does not constitute investment advice. Trading cryptocurrencies involves significant risk and can result in the loss of your investment. We recommend conducting your own research and consulting with a qualified financial advisor before making any trading decisions.

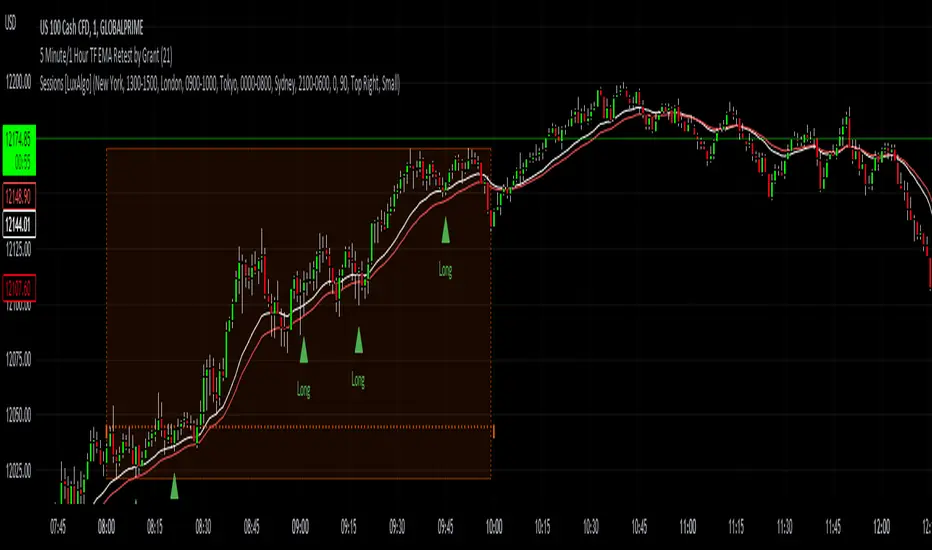
5 Minute TF 200 EMA Retest by Grantwww.tradingview.com
This indicator is a simple script meant to find retests on the 200 period moving average. It's current state is optimized for the 5 minute timeframe.
This works in all markets and all timeframes as long as you adjust certain rules for higher timeframes.
It's strengths and weaknesses
- Good at trend continuation in strong markets
- Bad in ranging markets (not surprising)
How does it work?
- It first identifies an overall trend by using the 200 ema.
- For long positions, it waits for price to close below the 200 ema, and then shortly closing back above the ema. For short positions its the opposite.
- For lower timeframes there are some other factors that help filter out bad signals that include:
- Makes sure that volume is increasing.
- Makes sure that volume is higher than average volume.
- For higher timeframes, the more specific factors aren't required.
How to use this indicator:
- Green triangles mean long positions
- Red triangles mean short positions
- Always trade with stoplosses and never risk too much of your account, please practice proper risk managment.
DISCLAIMER: Trading is inherently dangerous and carries lot's of risk. What you decide to do with my script has nothing to do with me. I am not responsible for any financial gains or losses made using this script. It is important to recognize other factors in the market to make better decisions.
% FROM 200-DAY MOVING AVERAGEOne of the stock market's paradoxes is that what seems too high goes higher and what seems too low goes lower. But there's a limit. Nothing goes up forever — even the best growth stocks.
Every experienced stock investor knows that at some point, what seems too high in price is in fact too high. So how do you objectively measure how high is too high?
One way is to calculate the distance from the 200-day moving average to the stock's current price on a daily chart. If the price is more than 70% to 100% above that level, maybe it's time to think about selling.
IBD founder and longtime former chair William O'Neil lists that as a sell signal in his book, "How to Make Money in Stocks," but admits he rarely uses it.
Use this script in your risk evaluation when starting a new position or thinking about selling a current position.
The percent from the 200-day moving average will be calculated and displayed in the top right of your chart. The flag symbols (⚑) will appear when a stock is >70% from its 200-day moving average line.

Crypto Scalper Divergence Macd Psar Ema 200This is a very efficient crypto scalper adapted to very short timeframes, however it can be optimized for other timeframes and assests as well.
Its components are
MACD
P SAR
EMA 200
Risk management
Rules for entry:
For short : we have an uptrend on PSAR , histogram is positive (divergence MACD) and close of a candle is below EMA 200
For long : we dont have an uptrend on PSAR, histogram is negative(divergence MACD) and close of a candle is above EMA 200
Rules for exit:
We exit when we either find a reverse condition than the entry one, or based on stop loss/take profit that are calculated on % movements of the price.
If you have any questions, let me know !

SMA 200 Ribbon MTF - Support and ResistanceThe SMA 200 is one of the most important and strongest support/resistance lines on any timeframe. This script pulls the SMA 200 line from multiple timeframes so traders can visually see price action bounce between support and resistance . The current timeframes SMA 200 is displayed in white and turns yellow to signify "pressure". Can be used on higher timeframes to find bull action. This indicator can also be used to filter out pumps and dumps as shown in example 3 and 4.
Example of indicator on 5 min timeframe. Candles bounce along SMA200 lines.
Example of indicator on daily timeframe . Lines turn green and price action pumps. Lines turn red and price action dumps.
Example 3: A clean crossover of lines usually signals a bullish pump.
Example 4: Tangled or messy lines tend to result in a dump as price action struggles to cross resistance. A pullback is required to "clean" the lines.
EMA Band can be turned on using "tickbox" in settings menu.

SMA 20, 50, 200This Script provides the 50 and 200 day moving average to provide a way to keep track of the classic Death Cross and Golden Cross. The 20 day moving average is just used as an early prediction of what the 50 day may do so you can keep and eye on it. If you are the kind of person that freaks out at sudden changes in the graphs it is probably best to just turn the 20 day off.
A Golden Cross is when the 50 day MA raises above the 200 day MA. This indicates the start of a Bull Market. This is the best time to buy as the market commonly will increase over the next few months or even years.
A Death Cross is when the 50 day MA drops below the 200 day MA. This indicates the start of a Bear Market. This is the best time to sell as the market will commonly decrease at least 20 percent or more over the next couple months or more.
I am not a financial advisor and this is just a tool to help you make your own decisions with your investments. My information is just based on common knowledge.

EMA 21,55,100,200/SMA 30,200 by Niko
Hi stranger,
This is my script with Exponencial moving average in my scales ( 21,55,100,200) which I use, and Simple moving average (30,200).
Enjoy

SPX Breadth – Stocks Above 200-day SMA//@version=6
indicator("SPX Breadth – Stocks Above 200-day SMA",
overlay = false,
max_lines_count = 500,
max_labels_count = 500)
//–––––––––––––––––––––––––––––––––––––––––––––––––––––––––––––––––––––––––––––
// Inputs
group_source = "Source"
breadthSymbol = input.symbol("SPXA200R", "Breadth symbol", group = group_source)
breadthTf = input.timeframe("", "Timeframe (blank = chart)", group = group_source)
group_params = "Parameters"
totalStocks = input.int(500, "Total stocks in index", minval = 1, group = group_params)
smoothingLen = input.int(10, "SMA length", minval = 1, group = group_params)
//–––––––––––––––––––––––––––––––––––––––––––––––––––––––––––––––––––––––––––––
// Breadth series (symbol assumed to be percent 0–100)
string tf = breadthTf == "" ? timeframe.period : breadthTf
float rawPct = request.security(breadthSymbol, tf, close) // 0–100 %
float breadthN = rawPct / 100.0 * totalStocks // convert to count
float breadthSma = ta.sma(breadthN, smoothingLen)
//–––––––––––––––––––––––––––––––––––––––––––––––––––––––––––––––––––––––––––––
// Regime levels (0–20 %, 20–40 %, 40–60 %, 60–80 %, 80–100 %)
float lvl0 = 0.0
float lvl20 = totalStocks * 0.20
float lvl40 = totalStocks * 0.40
float lvl60 = totalStocks * 0.60
float lvl80 = totalStocks * 0.80
float lvl100 = totalStocks * 1.0
p0 = plot(lvl0, "0%", color = color.new(color.black, 100))
p20 = plot(lvl20, "20%", color = color.new(color.red, 0))
p40 = plot(lvl40, "40%", color = color.new(color.orange, 0))
p60 = plot(lvl60, "60%", color = color.new(color.yellow, 0))
p80 = plot(lvl80, "80%", color = color.new(color.green, 0))
p100 = plot(lvl100, "100%", color = color.new(color.green, 100))
// Colored zones
fill(p0, p20, color = color.new(color.maroon, 80)) // very oversold
fill(p20, p40, color = color.new(color.red, 80)) // oversold
fill(p40, p60, color = color.new(color.gold, 80)) // neutral
fill(p60, p80, color = color.new(color.green, 80)) // bullish
fill(p80, p100, color = color.new(color.teal, 80)) // very strong
//–––––––––––––––––––––––––––––––––––––––––––––––––––––––––––––––––––––––––––––
// Plots
plot(breadthN, "Stocks above 200-day", color = color.orange, linewidth = 2)
plot(breadthSma, "Breadth SMA", color = color.white, linewidth = 2)
// Optional label showing live value
var label infoLabel = na
if barstate.islast
label.delete(infoLabel)
string txt = "Breadth: " +
str.tostring(breadthN, format.mintick) + " / " +
str.tostring(totalStocks) + " (" +
str.tostring(rawPct, format.mintick) + "%)"
infoLabel := label.new(bar_index, breadthN, txt,
style = label.style_label_left,
color = color.new(color.white, 20),
textcolor = color.black)

SMAs (10,50,100,200) by BenderDescription:
Multi-timeframe Simple Moving Average indicator displaying four popular SMAs (10, 50, 100, 200) commonly used for trend analysis and support/resistance levels. Each SMA is fully customizable with individual settings for period length, data source, timeframe, and color. Perfect for traders who want to view higher timeframe SMAs on lower timeframe charts or combine multiple timeframe analyses in one view.
Key Features:
Four independent SMAs with default periods of 10, 50, 100, and 200
Multi-timeframe capability - view daily SMAs on any chart timeframe
Fully customizable: length, source (close, open, high, low, etc.), timeframe, and color
Toggle each SMA on/off individually
Clean, organized settings menu with grouped parameters
Semi-transparent lines for better chart visibility
