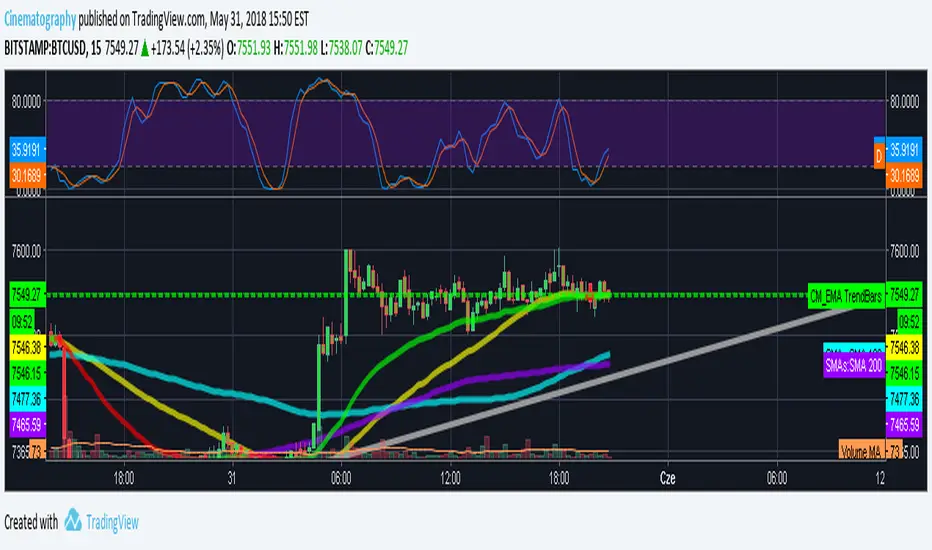
ALL Philakone's EMA's (8,13,21,55,100, 200)These are Philakone's EMA's. I added the 100 day in there as I didn't see that anyone had done that.
The 100 might be the same color as the 200 looking at the code, I changed it on my chart, but just make sure you check the colors.
Wyszukaj w skryptach "200元+股票大盘"


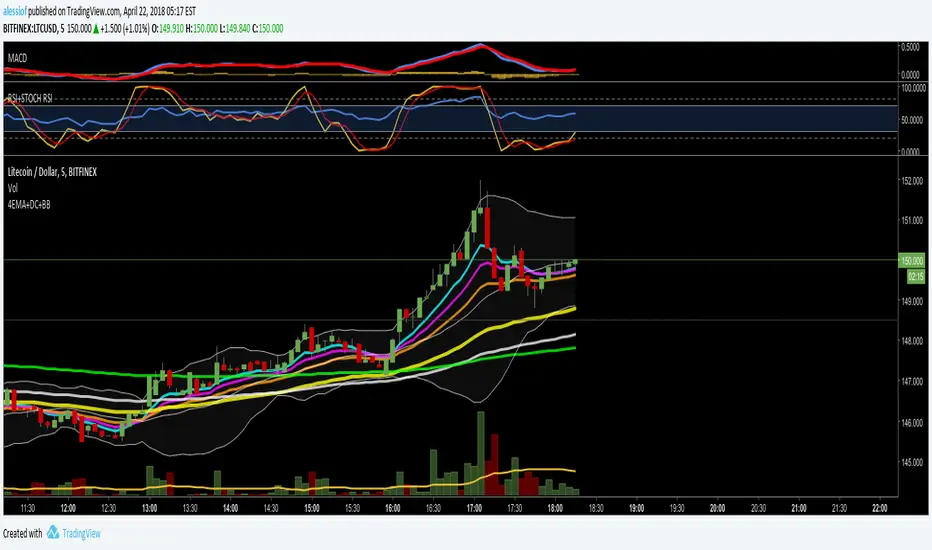
Philakone 4EMAs + 2MAs (200+50)Hi guys ^^
This is script combined all EMAs philakone use plus i added death and golden cross MA which is 200 MA + 50 MA
you can customize it hide show change colors all
and you can change the code add it do what ever you like
if you like this and want to support
BTC
3BMEXA9mJMhMBJR9MR3t7othh7BijxUNW7
Thanks ^^

crashm111 3-200 Moving Average RibbonAll the moving averages bewteen 3 and 200 in increments of 5.
with the ability to change colours
and change between simple and exponential.
It provides an easy and fast way to determine the trend direction and possible reversals.


Philakone EMA (8,13,21,55,200)Philakone's EMAs all in one indicator, including his recently added 200 line he uses in his recent analysis. :)

Simple Moving Averages (7, 30, 50, 100, 200)7, 30, 50, 100, 200 simple moving averages, bundled in one indicator (for users who are using the free TradingView service and can only load limited number of indicators at any given time).
You can turn each moving average on or off at will and change the colors.


SMA 50/100 / 200Couldn't find a simple moving average that combined the three i was looking for so I made it. Nothing special.

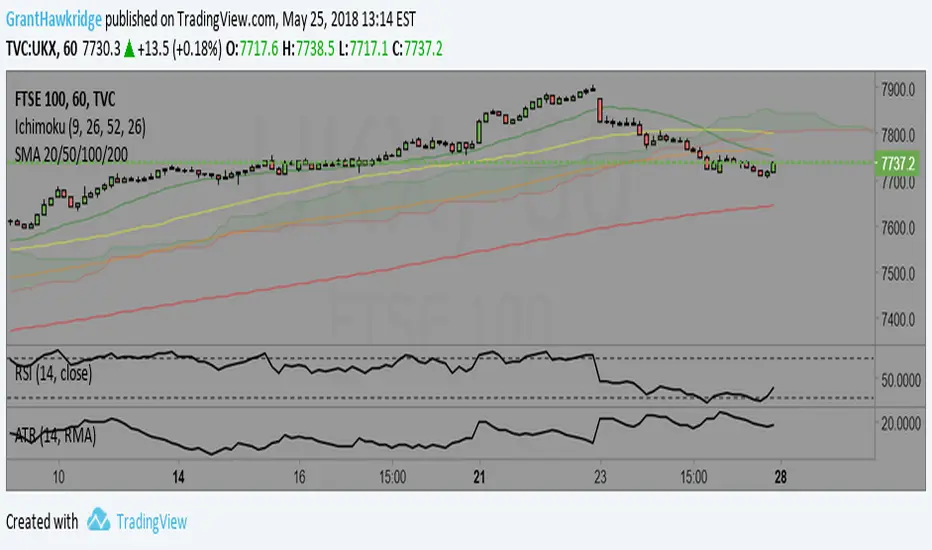
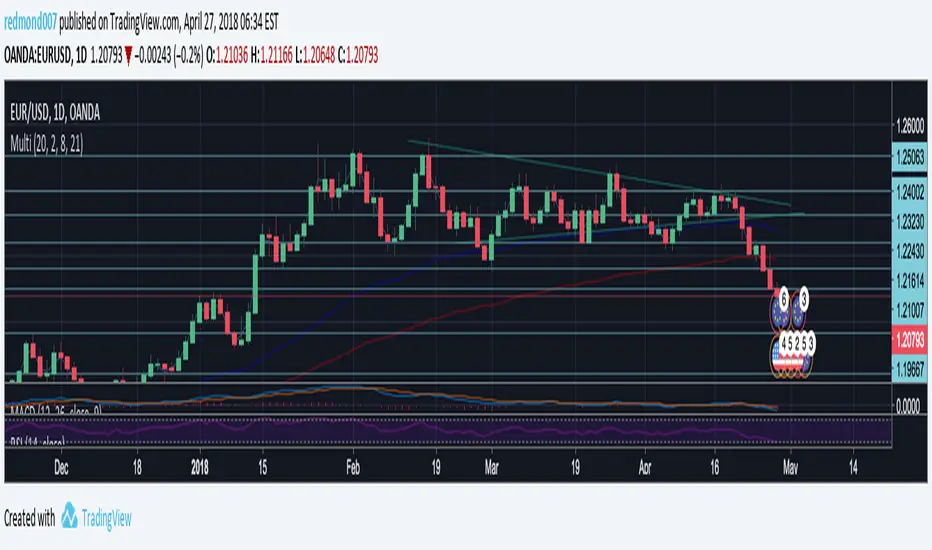
Multi Indicators v1 - 20 50 200 EMA/SMA, Bollinger Bands, VWAPMulti Indicators v1
20 50 200 EMA/SMA, Bollinger Bands, VWAP
These can be turned on and off
I'll be adding to this multi indicator in future updates
4EMA (8,13,21,55) + Death Cross (100,200) + Bollinger BandsUnited three indicators in one.
4 Moving Average Exponential: 8, 13, 21, 55 - as per @Philakone strategy
Moving Average Exponential - Death Cross: 100, 200
Bollinger Bands
Check out my other script for RSI and Stoch RSI all in one.
30, 50, 100 and 200 Day Simple Moving AveragesEasy to Use to see 30, 50, 100 and 200 Day Simple Moving Averages.
3xEMA 55 100 and 200the 55 blue 100 white and the 200 yellow EMA in one indicator uses current resolution time frame by default

Moving Averages (10, 55, 100 EMAs, 200 SMA close)10, 55, 100 EMAs, 200 SMA close. Increasing line stroke, standard colors.