AWR R & LR Oscillator with plots & tableHello trading viewers !
I'm glad to share with you one of my favorite indicator. It's the aggregate of many things. It is partly based on an indicator designed by gentleman goat. Many thanks to him.
1. Oscillator and Correlation Calculations
Overview and Functionality: This part of the indicator computes up to 10 Pearson correlation coefficients between a chosen source (typically the close price, though this is user-configurable) and the bar index over various periods. Starting with an initial period defined by the startPeriod parameter and increasing by a set increment (periodIncrement), each correlation coefficient is calculated using the built-in ta.correlation function over successive ranges. These coefficients are stored in an array, and the indicator calculates their average (avgPR) to provide a complete view of the market trend strength.
Display Features: Each individual coefficient, as well as the overall average, is plotted on the chart using a specific color. Horizontal lines (both dashed and solid) are drawn at levels 0, ±0.8, and ±1, serving as visual thresholds. Additionally, conditional fills in red or blue highlight when values exceed these thresholds, helping the user quickly identify potential extreme conditions (such as overbought or oversold situations).
2. Visual Signals and Automated Alerts
Graphical Signal Enhancements: To reinforce the analysis, the indicator uses graphical elements like emojis and shape markers. For example:
If all 10 curves drop below -0.79, a 🌋 emoji appears at the bottom of the chart;
When curves 2 through 10 are below -0.79, a ⛰️ emoji is displayed below the bar, potentially serving as a buy signal accompanied by an alert condition;
Likewise, symmetrical conditions for correlations exceeding 0.79 produce corresponding emojis (🤿 and 🏖️) at the top or bottom of the chart.
Alerts and Notifications: Using these visual triggers, several alertcondition statements are defined within the script. This allows users to set up TradingView alerts and receive real-time notifications whenever the market reaches these predefined critical zones identified by the multi-period analysis.
3. Regression Channel Analysis
Principles and Calculations: In addition to the oscillator, the indicator implements an analysis of regression channels. For each of the 8 configurable channels, the user can set a range of periods (for example, min1 to max1, etc.). The function calc_regression_channel iterates through the defined period range to find the optimal period that maximizes a statistical measure derived from a regression parameter calculated by the function r(p). Once this optimal period is identified, the indicator computes two key points (A and B) which define the main regression line, and then creates a channel based on the calculated deviation (an RMSE multiplied by a user-defined factor).
The regression channels are not displayed on the chart but are used to plot shapes & fullfilled a table.
Blue shapes are plotted when 6th channel or 7th channel are lower than 3 deviations
Yellow shapes are plotted when 6th channel or 7th channel are higher than 3 deviations
4. Scores, Conditions, and the Summary Table
Scoring System: The indicator goes further by assigning scores across multiple analytical categories, such as:
1. BigPear Score
What It Represents: This score is based on a longer-term moving average of the Pearson correlation values (SMA 100 of the average of the 10 curves of correlation of Pearson). The BigPear category is designed to capture where this longer-term average falls within specific ranges.
Conditions: The script defines nine boolean conditions (labeled BigPear1up through BigPear9up for the “up” direction).
Here's the rules :
BigPear1up = (bigsma_avgPR <= 0.5 and bigsma_avgPR > 0.25)
BigPear2up = (bigsma_avgPR <= 0.25 and bigsma_avgPR > 0)
BigPear3up = (bigsma_avgPR <= 0 and bigsma_avgPR > -0.25)
BigPear4up = (bigsma_avgPR <= -0.25 and bigsma_avgPR > -0.5)
BigPear5up = (bigsma_avgPR <= -0.5 and bigsma_avgPR > -0.65)
BigPear6up = (bigsma_avgPR <= -0.65 and bigsma_avgPR > -0.7)
BigPear7up = (bigsma_avgPR <= -0.7 and bigsma_avgPR > -0.75)
BigPear8up = (bigsma_avgPR <= -0.75 and bigsma_avgPR > -0.8)
BigPear9up = (bigsma_avgPR <= -0.8)
Conditions: The script defines nine boolean conditions (labeled BigPear1down through BigPear9down for the “down” direction).
BigPear1down = (bigsma_avgPR >= -0.5 and bigsma_avgPR < -0.25)
BigPear2down = (bigsma_avgPR >= -0.25 and bigsma_avgPR < 0)
BigPear3down = (bigsma_avgPR >= 0 and bigsma_avgPR < 0.25)
BigPear4down = (bigsma_avgPR >= 0.25 and bigsma_avgPR < 0.5)
BigPear5down = (bigsma_avgPR >= 0.5 and bigsma_avgPR < 0.65)
BigPear6down = (bigsma_avgPR >= 0.65 and bigsma_avgPR < 0.7)
BigPear7down = (bigsma_avgPR >= 0.7 and bigsma_avgPR < 0.75)
BigPear8down = (bigsma_avgPR >= 0.75 and bigsma_avgPR < 0.8)
BigPear9down = (bigsma_avgPR >= 0.8)
Weighting:
If BigPear1up is true, 1 point is added; if BigPear2up is true, 2 points are added; and so on up to 9 points from BigPear9up.
Total Score:
The positive score (posScoreBigPear) is the sum of these weighted conditions.
Similarly, there is a negative score (negScoreBigPear) that is calculated using a mirrored set of conditions (named BigPear1down to BigPear9down), each contributing a negative weight (from -1 to -9).
In essence, the BigPear score tells you—in a weighted cumulative way—where the longer-term correlation average falls relative to predefined thresholds.
2. Pear Score
What It Represents: This category uses the immediate average of the Pearson correlations (avgPR) rather than a longer-term smoothed version. It reflects a more current picture of the market’s correlation behavior.
How It’s Calculated:
Conditions: There are nine conditions defined for the “up” scenario (named Pear1up through Pear9up), which partition the range of avgPR into intervals. For instance:
Pear1up = (avgPR > -0.2 and avgPR <= 0)
Pear2up = (avgPR > -0.4 and avgPR <= -0.2)
Pear3up = (avgPR > -0.5 and avgPR <= -0.4)
Pear4up = (avgPR > -0.6 and avgPR <= -0.5)
Pear5up = (avgPR > -0.65 and avgPR <= -0.6)
Pear6up = (avgPR > -0.7 and avgPR <= -0.65)
Pear7up = (avgPR > -0.75 and avgPR <= -0.7)
Pear8up = (avgPR > -0.8 and avgPR <= -0.75)
Pear9up = (avgPR > -1 and avgPR <= -0.8)
There are nine conditions defined for the “down” scenario (named Pear1down through Pear9down), which partition the range of avgPR into intervals. For instance:
Pear1down = (avgPR >= 0 and avgPR < 0.2)
Pear2down = (avgPR >= 0.2 and avgPR < 0.4)
Pear3down = (avgPR >= 0.4 and avgPR < 0.5)
Pear4down = (avgPR >= 0.5 and avgPR < 0.6)
Pear5down = (avgPR >= 0.6 and avgPR < 0.65)
Pear6down = (avgPR >= 0.65 and avgPR < 0.7)
Pear7down = (avgPR >= 0.7 and avgPR < 0.75)
Pear8down = (avgPR >= 0.75 and avgPR < 0.8)
Pear9down = (avgPR >= 0.8 and avgPR <= 1)
Weighting:
Each condition has an associated weight, such as 0.9 for Pear1up, 1.9 for Pear2up, and so on, up to 9 for Pear9up.
Sum up :
Pear1up = 0.9
Pear2up = 1.9
Pear3up = 2.9
Pear4up = 3.9
Pear5up = 4.99
Pear6up = 6
Pear7up = 7
Pear8up = 8
Pear9up = 9
Total Score:
The positive score (posScorePear) is the sum of these values for each condition that returns true.
A corresponding negative score (negScorePear) is calculated using conditions for when avgPR falls on the positive side, with similar weights in the negative direction.
This score quantifies the current correlation reading by translating its relative level into a numeric score through a weighted sum.
3. Trendpear Score
What It Represents: The Trendpear score is more dynamic as it compares the current avgPR with its short-term moving average (sma_avgPR / 14 periods ) and also considers its relationship with an even longer moving average (bigsma_avgPR / 100 periods). It is meant to capture the trend or momentum in the correlation behavior.
How It’s Calculated:
Conditions: Nine conditions (from Trendpear1up to Trendpear9up) are defined to check:
Whether avgPR is below, equal to, or above sma_avgPR by different margins;
Whether it is trending upward (i.e., it is higher than its previous value).
Here are the rules
Trendpear1up = (avgPR <= sma_avgPR -0.2) and (avgPR >= avgPR )
Trendpear2up = (avgPR > sma_avgPR -0.2) and (avgPR <= sma_avgPR -0.07) and (avgPR >= avgPR )
Trendpear3up = (avgPR > sma_avgPR -0.07) and (avgPR <= sma_avgPR -0.03) and (avgPR >= avgPR )
Trendpear4up = (avgPR > sma_avgPR -0.03) and (avgPR <= sma_avgPR -0.02) and (avgPR >= avgPR )
Trendpear5up = (avgPR > sma_avgPR -0.02) and (avgPR <= sma_avgPR -0.01) and (avgPR >= avgPR )
Trendpear6up = (avgPR > sma_avgPR -0.01) and (avgPR <= sma_avgPR -0.001) and (avgPR >= avgPR )
Trendpear7up = (avgPR >= sma_avgPR) and (avgPR >= avgPR ) and (avgPR <= bigsma_avgPR)
Trendpear8up = (avgPR >= sma_avgPR) and (avgPR >= avgPR ) and (avgPR >= bigsma_avgPR -0.03)
Trendpear9up = (avgPR >= sma_avgPR) and (avgPR >= avgPR ) and (avgPR >= bigsma_avgPR)
Weighting:
The weights here are not linear. For example, the lightest condition may add 0.1 point, whereas the most extreme condition (e.g., when avgPR is not only above the moving average but also reaches a high proportion relative to bigsma_avgPR) might add as much as 90 points.
Trendpear1up = 0.1
Trendpear2up = 0.2
Trendpear3up = 0.3
Trendpear4up = 0.4
Trendpear5up = 0.5
Trendpear6up = 0.69
Trendpear7up = 7
Trendpear8up = 8.9
Trendpear9up = 90
Total Score:
The positive score (posScoreTrendpear) is the sum of the weights from all conditions that are satisfied.
A negative counterpart (negScoreTrendpear) exists similarly for when the trend indicates a downward bias.
Trendpear integrates both the level and the direction of change in the correlations, giving a strong numeric indication when the market starts to diverge from its short-term average.
4. Deviation Score
What It Represents: The “Écart” score quantifies how far the asset’s price deviates from the boundaries defined by the regression channels. This metric can indicate if the price is excessively deviating—which might signal an eventual reversion—or confirming a breakout.
How It’s Calculated:
Conditions: For each channel (with at least seven channels contributing to the scoring from the provided code), there are three levels of deviation:
First tier (EcartXup): Checks if the price is below the upper boundary but above a second boundary.
Second tier (EcartXup2): Checks if the price has dropped further, between a lower and a more extreme boundary.
Third tier (EcartXup3): Checks if the price is below the most extreme limit.
Weighting:
Each tier within a channel has a very small weight for the lowest severities (for example, 0.0001 for the first tier, 0.0002 for the second, 0.0003 for the third) with weights increasing with the channel index.
First channel : 0.0001 to 0.0003 (very short term)
Second channel : 0.001 to 0.003 (short term)
Third channel : 0.01 to 0.03 (short mid term)
4th channel : 0.1 to 0.3 ( mid term)
5th channel: 1 to 3 (long mid term)
6th channel : 10 to 30 (long term)
7th channel : 100 to 300 (very long term)
Total Score:
The overall positive score (posScoreEcart) is the sum of all the weights for conditions met among the first, second, and third tiers.
The corresponding negative score (negScoreEcart) is calculated similarly (using conditions when the price is above the channel boundaries), with the weights being the same in magnitude but negative in sign.
This layered scoring method allows the indicator to reflect both minor and major deviations in a gradated and cumulative manner.
Example :
Score + = 321.0001
Score - = -0.111
The asset price is really overextended in long term view, not for mid term & short term expect the in the very short term.
Score + = 0.0033
Score - = -1.11
The asset price is really extended in short term view, not for mid term (even a bit underextended) & long term is neutral
5. Slope Score
What It Represents: The Slope score captures the trend direction and steepness of the regression channels. It reflects whether the regression line (and hence the underlying trend) is sloping upward or downward.
How It’s Calculated:
Conditions:
if the slope has a uptrend = 1
if the slope has a downtrend = -1
Weighting:
First channel : 0.0001 to 0.0003 (very short term)
Second channel : 0.001 to 0.003 (short term)
Third channel : 0.01 to 0.03 (short mid term)
4th channel : 0.1 to 0.3 ( mid term)
5th channel: 1 to 3 (long mid term)
6th channel : 10 to 30 (long term)
7th channel : 100 to 300 (very long term)
The positive slope conditions incrementally add weights from 0.0001 for the smallest positive slopes to 100 for the largest among the seven checks. And negative for the downward slopes.
The positive score (posScoreSlope) is the sum of all the weights from the upward slope conditions that are met.
The negative score (negScoreSlope) sums the negative weights when downward conditions are met.
Example :
Score + = 111
Score - = -0.1111
Trend is up for longterm & down for mid & short term
The slope score therefore emphasizes both the magnitude and the direction of the trend as indicated by the regression channels, with an intentional asymmetry that flags strong downtrends more aggressively.
Summary
For each category—BigPear, Pear, Trendpear, Écart, and Slope—the indicator evaluates a defined set of conditions. Each condition is a binary test (true/false) based on different thresholds or comparisons (for example, comparing the current value to a moving average or a channel boundary). When a condition is true, its assigned weight is added to the cumulative score for that category. These individual scores, both positive and negative, are then displayed in a table, making it easy for the trader to see at a glance where the market stands according to each analytical dimension.
This comprehensive, weighted approach allows the indicator to encapsulate several layers of market information into a single set of scores, aiding in the identification of potential trading opportunities or market reversals.
5. Practical Use and Application
How to Use the Indicator:
Interpreting the Signals:
On your chart, observe the following components:
The individual correlation curves and their average, plotted with visual thresholds;
Visual markers (such as emojis and shape markers) that signal potential oversold or overbought conditions
The summary table that aggregates the scores from each category, offering a quick glance at the market’s state.
Trading Alerts and Decisions: Set your TradingView alerts through the alertcondition functions provided by the indicator. This way, you receive immediate notifications when critical conditions are met, allowing you to react as soon as the market reaches key levels. This tool is especially beneficial for advanced traders who want to combine multiple technical dimensions to optimize entry and exit points with a confluence of signals.
Conclusion and Additional Insights
In summary, this advanced indicator innovatively combines multi-scale Pearson correlation analysis (via multiple linear regressions) with robust regression channel analysis. It offers a deep and nuanced view of market dynamics by delivering clear visual signals and a comprehensive numerical summary through a built-in score table.
Combine this indicator with other tools (e.g., oscillators, moving averages, volume indicators) to enhance overall strategy robustness.
Wyszukaj w skryptach "马斯克+100万"

Mandelbrot-Fibonacci Cascade Vortex (MFCV)Mandelbrot-Fibonacci Cascade Vortex (MFCV) - Where Chaos Theory Meets Sacred Geometry
A Revolutionary Synthesis of Fractal Mathematics and Golden Ratio Dynamics
What began as an exploration into Benoit Mandelbrot's fractal market hypothesis and the mysterious appearance of Fibonacci sequences in nature has culminated in a groundbreaking indicator that reveals the hidden mathematical structure underlying market movements. This indicator represents months of research into chaos theory, fractal geometry, and the golden ratio's manifestation in financial markets.
The Theoretical Foundation
Mandelbrot's Fractal Market Hypothesis Traditional efficient market theory assumes normal distributions and random walks. Mandelbrot proved markets are fractal - self-similar patterns repeating across all timeframes with power-law distributions. The MFCV implements this through:
Hurst Exponent Calculation: H = log(R/S) / log(n/2)
Where:
R = Range of cumulative deviations
S = Standard deviation
n = Period length
This measures market memory:
H > 0.5: Trending (persistent) behavior
H = 0.5: Random walk
H < 0.5: Mean-reverting (anti-persistent) behavior
Fractal Dimension: D = 2 - H
This quantifies market complexity, where higher dimensions indicate more chaotic behavior.
Fibonacci Vortex Theory Markets don't move linearly - they spiral. The MFCV reveals these spirals using Fibonacci sequences:
Vortex Calculation: Vortex(n) = Price + sin(bar_index × φ / Fn) × ATR(Fn) × Volume_Factor
Where:
φ = 0.618 (golden ratio)
Fn = Fibonacci number (8, 13, 21, 34, 55)
Volume_Factor = 1 + (Volume/SMA(Volume,50) - 1) × 0.5
This creates oscillating spirals that contract and expand with market energy.
The Volatility Cascade System
Markets exhibit volatility clustering - Mandelbrot's "Noah Effect." The MFCV captures this through cascading volatility bands:
Cascade Level Calculation: Level(i) = ATR(20) × φ^i
Each level represents a different fractal scale, creating a multi-dimensional view of market structure. The golden ratio spacing ensures harmonic resonance between levels.
Implementation Architecture
Core Components:
Fractal Analysis Engine
Calculates Hurst exponent over user-defined periods
Derives fractal dimension for complexity measurement
Identifies market regime (trending/ranging/chaotic)
Fibonacci Vortex Generator
Creates 5 independent spiral oscillators
Each spiral follows a Fibonacci period
Volume amplification creates dynamic response
Cascade Band System
Up to 8 volatility levels
Golden ratio expansion between levels
Dynamic coloring based on fractal state
Confluence Detection
Identifies convergence of vortex and cascade levels
Highlights high-probability reversal zones
Real-time confluence strength calculation
Signal Generation Logic
The MFCV generates two primary signal types:
Fractal Signals: Generated when:
Hurst > 0.65 (strong trend) AND volatility expanding
Hurst < 0.35 (mean reversion) AND RSI < 35
Trend strength > 0.4 AND vortex alignment
Cascade Signals: Triggered by:
RSI > 60 AND price > SMA(50) AND bearish vortex
RSI < 40 AND price < SMA(50) AND bullish vortex
Volatility expansion AND trend strength > 0.3
Both signals implement a 15-bar cooldown to prevent overtrading.
Advanced Input System
Mandelbrot Parameters:
Cascade Levels (3-8):
Controls number of volatility bands
Crypto: 5-7 (high volatility)
Indices: 4-5 (moderate volatility)
Forex: 3-4 (low volatility)
Hurst Period (20-200):
Lookback for fractal calculation
Scalping: 20-50
Day Trading: 50-100
Swing Trading: 100-150
Position Trading: 150-200
Cascade Ratio (1.0-3.0):
Band width multiplier
1.618: Golden ratio (default)
Higher values for trending markets
Lower values for ranging markets
Fractal Memory (21-233):
Fibonacci retracement lookback
Uses Fibonacci numbers for harmonic alignment
Fibonacci Vortex Settings:
Spiral Periods:
Comma-separated Fibonacci sequence
Fast: "5,8,13,21,34" (scalping)
Standard: "8,13,21,34,55" (balanced)
Extended: "13,21,34,55,89" (swing)
Rotation Speed (0.1-2.0):
Controls spiral oscillation frequency
0.618: Golden ratio (balanced)
Higher = more signals, more noise
Lower = smoother, fewer signals
Volume Amplification:
Enables dynamic spiral expansion
Essential for stocks and crypto
Disable for forex (no central volume)
Visual System Architecture
Cascade Bands:
Multi-level volatility envelopes
Gradient coloring from primary to secondary theme
Transparency increases with distance from price
Fill between bands shows fractal structure
Vortex Spirals:
5 Fibonacci-period oscillators
Blue above price (bullish pressure)
Red below price (bearish pressure)
Multiple display styles: Lines, Circles, Dots, Cross
Dynamic Fibonacci Levels:
Auto-updating retracement levels
Smart update logic prevents disruption near levels
Distance-based transparency (closer = more visible)
Updates every 50 bars or on volatility spikes
Confluence Zones:
Highlighted boxes where indicators converge
Stronger confluence = stronger support/resistance
Key areas for reversal trades
Professional Dashboard System
Main Fractal Dashboard: Displays real-time:
Hurst Exponent with market state
Fractal Dimension with complexity level
Volatility Cascade status
Vortex rotation impact
Market regime classification
Signal strength percentage
Active indicator levels
Vortex Metrics Panel: Shows:
Individual spiral deviations
Convergence/divergence metrics
Real-time vortex positioning
Fibonacci period performance
Fractal Metrics Display: Tracks:
Dimension D value
Market complexity rating
Self-similarity strength
Trend quality assessment
Theory Guide Panel: Educational reference showing:
Mandelbrot principles
Fibonacci vortex concepts
Dynamic trading suggestions
Trading Applications
Trend Following:
High Hurst (>0.65) indicates strong trends
Follow cascade band direction
Use vortex spirals for entry timing
Exit when Hurst drops below 0.5
Mean Reversion:
Low Hurst (<0.35) signals reversal potential
Trade toward vortex spiral convergence
Use Fibonacci levels as targets
Tighten stops in chaotic regimes
Breakout Trading:
Monitor cascade band compression
Watch for vortex spiral alignment
Volatility expansion confirms breakouts
Use confluence zones for targets
Risk Management:
Position size based on fractal dimension
Wider stops in high complexity markets
Tighter stops when Hurst is extreme
Scale out at Fibonacci levels
Market-Specific Optimization
Cryptocurrency:
Cascade Levels: 5-7
Hurst Period: 50-100
Rotation Speed: 0.786-1.2
Enable volume amplification
Stock Indices:
Cascade Levels: 4-5
Hurst Period: 80-120
Rotation Speed: 0.5-0.786
Moderate cascade ratio
Forex:
Cascade Levels: 3-4
Hurst Period: 100-150
Rotation Speed: 0.382-0.618
Disable volume amplification
Commodities:
Cascade Levels: 4-6
Hurst Period: 60-100
Rotation Speed: 0.5-1.0
Seasonal adjustment consideration
Innovation and Originality
The MFCV represents several breakthrough innovations:
First Integration of Mandelbrot Fractals with Fibonacci Vortex Theory
Unique synthesis of chaos theory and sacred geometry
Novel application of Hurst exponent to spiral dynamics
Dynamic Volatility Cascade System
Golden ratio-based band expansion
Multi-timeframe fractal analysis
Self-adjusting to market conditions
Volume-Amplified Vortex Spirals
Revolutionary spiral calculation method
Dynamic response to market participation
Multiple Fibonacci period integration
Intelligent Signal Generation
Cooldown system prevents overtrading
Multi-factor confirmation required
Regime-aware signal filtering
Professional Analytics Dashboard
Institutional-grade metrics display
Real-time fractal analysis
Educational integration
Development Journey
Creating the MFCV involved overcoming numerous challenges:
Mathematical Complexity: Implementing Hurst exponent calculations efficiently
Visual Clarity: Displaying multiple indicators without cluttering
Performance Optimization: Managing array operations and calculations
Signal Quality: Balancing sensitivity with reliability
User Experience: Making complex theory accessible
The result is an indicator that brings PhD-level mathematics to practical trading while maintaining visual elegance and usability.
Best Practices and Guidelines
Start Simple: Use default settings initially
Match Timeframe: Adjust parameters to your trading style
Confirm Signals: Never trade MFCV signals in isolation
Respect Regimes: Adapt strategy to market state
Manage Risk: Use fractal dimension for position sizing
Color Themes
Six professional themes included:
Fractal: Balanced blue/purple palette
Golden: Warm Fibonacci-inspired colors
Plasma: Vibrant modern aesthetics
Cosmic: Dark mode optimized
Matrix: Classic green terminal
Fire: Heat map visualization
Disclaimer
This indicator is for educational and research purposes only. It does not constitute financial advice. While the MFCV reveals deep market structure through advanced mathematics, markets remain inherently unpredictable. Past performance does not guarantee future results.
The integration of Mandelbrot's fractal theory with Fibonacci vortex dynamics provides unique market insights, but should be used as part of a comprehensive trading strategy. Always use proper risk management and never risk more than you can afford to lose.
Acknowledgments
Special thanks to Benoit Mandelbrot for revolutionizing our understanding of markets through fractal geometry, and to the ancient mathematicians who discovered the golden ratio's universal significance.
"The geometry of nature is fractal... Markets are fractal too." - Benoit Mandelbrot
Revealing the Hidden Order in Market Chaos Trade with Mathematical Precision. Trade with MFCV.
— Created with passion for the TradingView community
Trade with insight. Trade with anticipation.
— Dskyz , for DAFE Trading Systems

Enhanced Volume Trend Indicator with BB SqueezeEnhanced Volume Trend Indicator with BB Squeeze: Comprehensive Explanation
The visualization system allows traders to quickly scan multiple securities to identify high-probability setups without detailed analysis of each chart. The progression from squeeze to breakout, supported by volume trend confirmation, offers a systematic approach to identifying trading opportunities.
The script combines multiple technical analysis approaches into a comprehensive dashboard that helps traders make informed decisions by identifying high-probability setups while filtering out noise through its sophisticated confirmation requirements. It combines multiple technical analysis approaches into an integrated visual system that helps traders identify potential trading opportunities while filtering out false signals.
Core Features
1. Volume Analysis Dashboard
The indicator displays various volume-related metrics in customizable tables:
AVOL (After Hours + Pre-Market Volume): Shows extended hours volume as a percentage of the 21-day average volume with color coding for buying/selling pressure. Green indicates buying pressure and red indicates selling pressure.
Volume Metrics: Includes regular volume (VOL), dollar volume ($VOL), relative volume compared to 21-day average (RVOL), and relative volume compared to 90-day average (RVOL90D).
Pre-Market Data: Optional display of pre-market volume (PVOL), pre-market dollar volume (P$VOL), pre-market relative volume (PRVOL), and pre-market price change percentage (PCHG%).
2. Enhanced Volume Trend (VTR) Analysis
The Volume Trend indicator uses adaptive analysis to evaluate buying and selling pressure, combining multiple factors:
MACD (Moving Average Convergence Divergence) components
Volume-to-SMA (Simple Moving Average) ratio
Price direction and market conditions
Volume change rates and momentum
EMA (Exponential Moving Average) alignment and crossovers
Volatility filtering
VTR Visual Indicators
The VTR score ranges from 0-100, with values above 50 indicating bullish conditions and below 50 indicating bearish conditions. This is visually represented by colored circles:
"●" (Filled Circle):
Green: Strong bullish trend (VTR ≥ 80)
Red: Strong bearish trend (VTR ≤ 20)
"◯" (Hollow Circle):
Green: Moderate bullish trend (VTR 65-79)
Red: Moderate bearish trend (VTR 21-35)
"·" (Small Dot):
Green: Weak bullish trend (VTR 55-64)
Red: Weak bearish trend (VTR 36-45)
"○" (Medium Hollow Circle): Neutral conditions (VTR 46-54), shown in gray
In "Both" display mode, the VTR shows both the numerical score (0-100) alongside the appropriate circle symbol.
Enhanced VTR Settings
The Enhanced Volume Trend component offers several advanced customization options:
Adaptive Volume Analysis (volTrendAdaptive):
When enabled, dynamically adjusts volume thresholds based on recent market volatility
Higher volatility periods require proportionally higher volume to generate significant signals
Helps prevent false signals during highly volatile markets
Keep enabled for most trading conditions, especially in volatile markets
Speed of Change Weight (volTrendSpeedWeight, range 0-1):
Controls emphasis on volume acceleration/deceleration rather than absolute levels
Higher values (0.7-1.0): More responsive to new volume trends, better for momentum trading
Lower values (0.2-0.5): Less responsive, better for trend following
Helps identify early volume trends before they fully develop
Momentum Period (volTrendMomentumPeriod, range 2-10):
Defines lookback period for volume change rate calculations
Lower values (2-3): More responsive to recent changes, better for short timeframes
Higher values (7-10): Smoother, better for daily/weekly charts
Directly affects how quickly the indicator responds to new volume patterns
Volatility Filter (volTrendVolatilityFilter):
Adjusts significance of volume by factoring in current price volatility
High volume during high volatility receives less weight
High volume during low volatility receives more weight
Helps distinguish between genuine volume-driven moves and volatility-driven moves
EMA Alignment Weight (volTrendEmaWeight, range 0-1):
Controls importance of EMA alignments in final VTR calculation
Analyzes multiple EMA relationships (5, 10, 21 period)
Higher values (0.7-1.0): Greater emphasis on trend structure
Lower values (0.2-0.5): More focus on pure volume patterns
Display Mode (volTrendDisplayMode):
"Value": Shows only numerical score (0-100)
"Strength": Shows only symbolic representation
"Both": Shows numerical score and symbol together
3. Bollinger Band Squeeze Detection (SQZ)
The BB Squeeze indicator identifies periods of low volatility when Bollinger Bands contract inside Keltner Channels, often preceding significant price movements.
SQZ Visual Indicators
"●" (Filled Circle): Strong squeeze - high probability setup for an impending breakout
Green: Strong squeeze with bullish bias (likely upward breakout)
Red: Strong squeeze with bearish bias (likely downward breakout)
Orange: Strong squeeze with unclear direction
"◯" (Hollow Circle): Moderate squeeze - medium probability setup
Green: With bullish EMA alignment
Red: With bearish EMA alignment
Orange: Without clear directional bias
"-" (Dash): Gray dash indicates no squeeze condition (normal volatility)
The script identifies squeeze conditions through multiple methods:
Bollinger Bands contracting inside Keltner Channels
BB width falling to bottom 20% of recent range (BB width percentile)
Very narrow Keltner Channel (less than 5% of basis price)
Tracking squeeze duration in consecutive bars
Different squeeze strengths are detected:
Strong Squeeze: BB inside KC with tight BB width and narrow KC
Moderate Squeeze: BB inside KC with either tight BB width or narrow KC
No Squeeze: Normal market conditions
4. Breakout Detection System
The script includes two breakout indicators working in sequence:
4.1 Pre-Breakout (PBK) Indicator
Detects potential upcoming breakouts by analyzing multiple factors:
Squeeze conditions lasting 2-3 bars or more
Significant price ranges
Strong volume confirmation
EMA/MACD crossovers
Consistent price direction
PBK Visual Indicators
"●" (Filled Circle): Detected pre-breakout condition
Green: Likely upward breakout (bullish)
Red: Likely downward breakout (bearish)
Orange: Direction not yet clear, but breakout likely
"-" (Dash): Gray dash indicates no pre-breakout condition
The PBK uses sophisticated conditions to reduce false signals including minimum squeeze length, significant price movement, and technical confirmations.
4.2 Breakout (BK) Indicator
Confirms actual breakouts in progress by identifying:
End of squeeze or strong expansion of Bollinger Bands
Volume expansion
Price moving outside Bollinger Bands
EMA crossovers with volume confirmation
MACD crossovers with significant price range
BK Visual Indicators
"●" (Filled Circle): Confirmed breakout in progress
Green: Upward breakout (bullish)
Red: Downward breakout (bearish)
Orange: Unusual breakout pattern without clear direction
"◆" (Diamond): Special breakout conditions (meets some but not all criteria)
"-" (Dash): Gray dash indicates no breakout detected
The BK indicator uses advanced filters for confirmation:
Requires consecutive breakout signals to reduce false positives
Strong volume confirmation requirements (40% above average)
Significant price movement thresholds
Consistency checks between price action and indicators
5. Market Metrics and Analysis
Price Change Percentage (CHG%)
Displays the current percentage change relative to the previous day's close, color-coded green for positive changes and red for negative changes.
Average Daily Range (ADR%)
Calculates the average daily percentage range over a specified period (default 20 days), helping traders gauge volatility and set appropriate price targets.
Average True Range (ATR)
Shows the Average True Range value, a volatility indicator developed by J. Welles Wilder that measures market volatility by decomposing the entire range of an asset price for that period.
Relative Strength Index (RSI)
Displays the standard 14-period RSI, a momentum oscillator that measures the speed and change of price movements on a scale from 0 to 100.
6. External Market Indicators
QQQ Change
Shows the percentage change in the Invesco QQQ Trust (tracking the Nasdaq-100 Index), useful for understanding broader tech market trends.
UVIX Change
Displays the percentage change in UVIX, a volatility index, providing insight into market fear and potential hedging activity.
BTC-USD
Shows the current Bitcoin price from Coinbase, useful for traders monitoring crypto correlation with equities.
Market Breadth (BRD)
Calculates the percentage difference between ATHI.US and ATLO.US (high vs. low securities), indicating overall market direction and strength.
7. Session Analysis and Volume Direction
Session Detection
The script accurately identifies different market sessions:
Pre-market: 4:00 AM to 9:30 AM
Regular market: 9:30 AM to 4:00 PM
After-hours: 4:00 PM to 8:00 PM
Closed: Outside trading hours
This detection works on any timeframe through careful calculation of current time in seconds.
Buy/Sell Volume Direction
The script analyzes buying and selling pressure by:
Counting up volume when close > open
Counting down volume when close < open
Tracking accumulated volume within the day
Calculating intraday pressure (up volume minus down volume)
Enhanced AVOL Calculation
The improved AVOL calculation works in all timeframes by:
Estimating typical pre-market and after-hours volume percentages
Combining yesterday's after-hours with today's pre-market volume
Calculating this as a percentage of the 21-day average volume
Determining buying/selling pressure by analyzing after-hours and pre-market price changes
Color-coding results: green for buying pressure, red for selling pressure
This calculation is particularly valuable because it works consistently across any timeframe.
Customization Options
Display Settings
The dashboard has two customizable tables: Volume Table and Metrics Table, with positions selectable as bottom_left or bottom_right.
All metrics can be individually toggled on/off:
Pre-market data (PVOL, P$VOL, PRVOL, PCHG%)
Volume data (AVOL, RVOL Day, RVOL 90D, Volume, SEED_YASHALGO_NSE_BREADTH:VOLUME )
Price metrics (ADR%, ATR, RSI, Price Change%)
Market indicators (QQQ, UVIX, Breadth, BTC-USD)
Analysis indicators (Volume Trend, BB Squeeze, Pre-Breakout, Breakout)
These toggle options allow traders to customize the dashboard to show only the metrics they find most valuable for their trading style.
Table and Text Customization
The dashboard's appearance can be customized:
Table background color via tableBgColor
Text color (White or Black) via textColorOption
The indicator uses smart formatting for volume and price values, automatically adding appropriate suffixes (K, M, B) for readability.
MACD Configuration for VTR
The Volume Trend calculation incorporates MACD with customizable parameters:
Fast Length: Controls the period for the fast EMA (default 3)
Slow Length: Controls the period for the slow EMA (default 9)
Signal Length: Controls the period for the signal line EMA (default 5)
MACD Weight: Controls how much influence MACD has on the volume trend score (default 0.3)
These settings allow traders to fine-tune how momentum is factored into the volume trend analysis.
Bollinger Bands and Keltner Channel Settings
The Bollinger Bands and Keltner Channels used for squeeze detection have preset (hidden) parameters:
BB Length: 20 periods
BB Multiplier: 2.0 standard deviations
Keltner Length: 20 periods
Keltner Multiplier: 1.5 ATR
These settings follow standard practice for squeeze detection while maintaining simplicity in the user interface.
Practical Trading Applications
Complete Trading Strategies
1. Squeeze Breakout Strategy
This strategy combines multiple components of the indicator:
Wait for a strong squeeze (SQZ showing ●)
Look for pre-breakout confirmation (PBK showing ● in green or red)
Enter when breakout is confirmed (BK showing ● in same direction)
Use VTR to confirm volume supports the move (VTR ≥ 65 for bullish or ≤ 35 for bearish)
Set profit targets based on ADR (Average Daily Range)
Exit when VTR begins to weaken or changes direction
2. Volume Divergence Strategy
This strategy focuses on the volume trend relative to price:
Identify when price makes a new high but VTR fails to confirm (divergence)
Look for VTR to show weakening trend (● changing to ◯ or ·)
Prepare for potential reversal when SQZ begins to form
Enter counter-trend position when PBK confirms reversal direction
Use external indicators (QQQ, BTC, Breadth) to confirm broader market support
3. Pre-Market Edge Strategy
This strategy leverages pre-market data:
Monitor AVOL for unusual pre-market activity (significantly above 100%)
Check pre-market price change direction (PCHG%)
Enter position at market open if VTR confirms direction
Use SQZ to determine if volatility is likely to expand
Exit based on RVOL declining or price reaching +/- ADR for the day
Market Context Integration
The indicator provides valuable context for trading decisions:
QQQ change shows tech market direction
BTC price shows crypto market correlation
UVIX change indicates volatility expectations
Breadth measurement shows market internals
This context helps traders avoid fighting the broader market and align trades with overall market direction.
Timeframe Optimization
The indicator is designed to work across different timeframes:
For day trading: Focus on AVOL, VTR, PBK/BK, and use shorter momentum periods
For swing trading: Focus on SQZ duration, VTR strength, and broader market indicators
For position trading: Focus on larger VTR trends and use EMA alignment weight
Advanced Analytical Components
Enhanced Volume Trend Score Calculation
The VTR score calculation is sophisticated, with the base score starting at 50 and adjusting for:
Price direction (up/down)
Volume relative to average (high/normal/low)
Volume acceleration/deceleration
Market conditions (bull/bear)
Additional factors are then applied, including:
MACD influence weighted by strength and direction
Volume change rate influence (speed)
Price/volume divergence effects
EMA alignment scores
Volatility adjustments
Breakout strength factors
Price action confirmations
The final score is clamped between 0-100, with values above 50 indicating bullish conditions and below 50 indicating bearish conditions.
Anti-False Signal Filters
The indicator employs multiple techniques to reduce false signals:
Requiring significant price range (minimum percentage movement)
Demanding strong volume confirmation (significantly above average)
Checking for consistent direction across multiple indicators
Requiring prior bar consistency (consecutive bars moving in same direction)
Counting consecutive signals to filter out noise
These filters help eliminate noise and focus on high-probability setups.
MACD Enhancement and Integration
The indicator enhances standard MACD analysis:
Calculating MACD relative strength compared to recent history
Normalizing MACD slope relative to volatility
Detecting MACD acceleration for stronger signals
Integrating MACD crossovers with other confirmation factors
EMA Analysis System
The indicator uses a comprehensive EMA analysis system:
Calculating multiple EMAs (5, 10, 21 periods)
Detecting golden cross (10 EMA crosses above 21 EMA)
Detecting death cross (10 EMA crosses below 21 EMA)
Assessing price position relative to EMAs
Measuring EMA separation percentage
Recent Enhancements and Evolution
Version 5.2 includes several improvements:
Enhanced AVOL to show buying/selling direction through color coding
Improved VTR with adaptive analysis based on market conditions
AVOL display now works in all timeframes through sophisticated estimation
Removed animal symbols and streamlined code with bright colors for better visibility
Improved anti-false signal filters throughout the system
Optimizing Indicator Settings
For Different Market Types
Range-Bound Markets:
Lower EMA Alignment Weight (0.2-0.4)
Higher Speed of Change Weight (0.8-1.0)
Focus on SQZ and PBK signals for breakout potential
Trending Markets:
Higher EMA Alignment Weight (0.7-1.0)
Moderate Speed of Change Weight (0.4-0.6)
Focus on VTR strength and BK confirmations
Volatile Markets:
Enable Volatility Filter
Enable Adaptive Volume Analysis
Lower Momentum Period (2-3)
Focus on strong volume confirmation (VTR ≥ 80 or ≤ 20)
For Different Asset Classes
Equities:
Standard settings work well
Pay attention to AVOL for gap potential
Monitor QQQ correlation
Futures:
Consider higher Volume/RVOL weight
Reduce MACD weight slightly
Pay close attention to SQZ duration
Crypto:
Higher volatility thresholds may be needed
Monitor BTC price for correlation
Focus on stronger confirmation signals
Integrated Visual System for Trading Decisions
The colored circle indicators create an intuitive visual system for quick market assessment:
Progression Sequence: SQZ (Squeeze) → PBK (Pre-Breakout) → BK (Breakout)
This sequence often occurs in order, with the squeeze leading to pre-breakout conditions, followed by an actual breakout.
VTR (Volume Trend): Provides context about the volume supporting these movements.
Color Coding: Green for bullish conditions, red for bearish conditions, and orange/gray for neutral or undefined conditions.

True Strength Index (TSI)%📌 Script Name: TSI Percentuale
This script is a custom True Strength Index (TSI) indicator that expresses momentum strength as a percentage from 0% to 100%, instead of the traditional TSI scale.
✅ What the Script Does
Calculates the standard TSI:
Uses double exponential smoothing of price changes and their absolute values.
Formula:
TSI_raw
=
100
×
DoubleSmoothed(ΔPrice)
DoubleSmoothed(|ΔPrice|)
TSI_raw=100×
DoubleSmoothed(|ΔPrice|)
DoubleSmoothed(ΔPrice)
Normalizes TSI to a percentile scale:
Over a user-defined lookback period, the script finds the lowest and highest TSI values.
It then rescales the current TSI to a value between 0% (minimum) and 100% (maximum).
50% represents neutral momentum (i.e., "flat").
Plots the result:
tsi_percent is plotted as a blue line.
Horizontal dashed/dotted lines are drawn at:
0% → strong downward momentum
50% → neutral
100% → strong upward momentum
⚙️ Inputs
Long Length: Long EMA smoothing period (default: 25)
Short Length: Short EMA smoothing period (default: 13)
Signal Length: (not used in this version, can be removed or extended)
Lookback Period: Number of bars to calculate min/max normalization (default: 100)
🧠 Why Use This Indicator
The classic TSI ranges around and can be hard to interpret.
This version makes TSI visually intuitive by converting it to percentile form, allowing easier comparison of momentum strength across time and instruments.
It’s particularly useful for defining zones like:
Above 70% = strong bullish
Below 30% = strong bearish

HL2 Moving Average with BandsThis indicator is designed to assist traders in identifying potential trade entries and exits for S&P 500 (ES) and Nasdaq-100 (NQ) futures. It calculates a Simple Moving Average (SMA) based on the HL2 value (average of high and low prices) of the current candle over a user-defined lookback period (default: 200 periods). The indicator plots this SMA as a blue line, providing a smoothed reference for price trends.
Additionally, it includes upper and lower bands calculated as a percentage (default: 0.5%) above and below the SMA, plotted as green and red lines, respectively. These bands act as dynamic thresholds to identify overbought or oversold conditions. The indicator generates trade signals based on price action relative to these bands:
Long Entry: A green upward triangle is plotted below the candle when the close crosses above the upper band, signaling a potential buy.
Close Long: A red square is plotted above the candle when the close crosses back below the upper band, indicating an exit for the long position.
Short Entry: A red downward triangle is plotted above the candle when the close crosses below the lower band, signaling a potential sell.
Close Short: A green square is plotted below the candle when the close crosses back above the lower band, indicating an exit for the short position.
The script is customizable, allowing users to adjust the SMA length and band percentage to suit their trading style or market conditions. It is plotted as an overlay on the price chart for easy integration with other technical analysis tools.
Recommended Time Frame and Settings for Trading S&P 500 and Nasdaq-100 Futures
Based on research and market dynamics for S&P 500 (ES) and Nasdaq-100 (NQ) futures, the 5-minute chart is recommended as the optimal time frame for day trading with this indicator. This time frame strikes a balance between capturing intraday trends and filtering out excessive noise, which is critical for futures trading due to their high volatility and leverage. The 5-minute chart aligns well with periods of high liquidity and volatility, such as the U.S. market open (9:30 AM–11:00 AM EST) and the afternoon session (2:00 PM–4:00 PM EST), when institutional traders are most active.
Why 5-minute? It allows traders to react to short-term price movements while avoiding the rapid fluctuations of 1-minute charts, which can be prone to false signals in choppy markets. It also provides enough data points to make the SMA and bands meaningful without the lag associated with longer time frames like 15-minute or hourly charts.
Recommended Settings
SMA Length: Set to 200 periods. This longer lookback period smooths the HL2 data, reducing noise and providing a reliable trend reference for the 5-minute chart. A 200-period SMA helps identify significant trend shifts without being overly sensitive to minor price fluctuations.
Band Percentage: 0.5% is more suitable for the volatility of ES and NQ futures on a 5-minute chart, as it generates fewer but higher-probability signals. Wider bands (e.g., 1%) may miss short-term opportunities, while narrower bands (e.g., 0.1%) may produce excessive false signals.
Trading Session Recommendations
Futures markets for ES and NQ are open nearly 24 hours (Sunday 6:00 PM EST to Friday 5:00 PM EST, with a daily break from 4:00 PM–5:00 PM EST), but not all hours are equally optimal due to varying liquidity and volatility. The best times to trade with this indicator are:
U.S. Market Open (9:30 AM–11:00 AM EST): This period is characterized by high volume and volatility, driven by the opening of U.S. equity markets and economic data releases (e.g., 8:30 AM EST reports like CPI or GDP). The indicator’s signals are more reliable during this window due to strong order flow and price momentum.
Afternoon Session (2:00 PM–4:00 PM EST): After the lunchtime lull, volume picks up as institutional traders return, and news or FOMC announcements often drive price action. The indicator can capture breakout moves as prices test the upper or lower bands.
Pre-Market (7:30 AM–9:30 AM EST): For traders comfortable with lower liquidity, this period can offer opportunities, especially around 8:30 AM EST economic releases. However, use tighter risk management due to wider spreads and potential volatility spikes.
Additional Tips
Avoid Low-Volume Periods: Steer clear of trading during low-liquidity hours, such as the overnight session (11:00 PM–3:00 AM EST), when spreads widen and price movements can be erratic, leading to false signals from the indicator.
Combine with Other Tools: Enhance the indicator’s effectiveness by pairing it with support/resistance levels, Fibonacci retracements, or volume analysis to confirm signals. For example, a long entry signal above the upper band is stronger if it coincides with a breakout above a key resistance level.
Risk Management: Given the leverage in futures (e.g., Micro E-mini contracts require ~$1,200 margin for ES), use tight stop-losses (e.g., below the lower band for longs or above the upper band for shorts) to manage risk. Aim for a risk-reward ratio of at least 1:2.
Test Settings: Backtest the indicator on a demo account to optimize the SMA length and band percentage for your specific trading style and risk tolerance. Micro E-mini contracts (MES for S&P 500, MNQ for Nasdaq-100) are ideal for testing due to their lower capital requirements.
Why These Settings and Time Frame?
The 5-minute chart with a 200-period SMA and 0.5% bands is tailored for the volatility and liquidity of ES and NQ futures during peak trading hours. The longer SMA period ensures the indicator captures meaningful trends, while the 0.5% bands are tight enough to signal actionable breakouts but wide enough to avoid excessive whipsaws. Trading during high-volume sessions maximizes the likelihood of valid signals, as institutional participation drives clearer price action.
By focusing on these settings and time frames, traders can leverage the indicator to capitalize on the dynamic price movements of S&P 500 and Nasdaq-100 futures while managing the inherent risks of these markets.

Aurora Flow Oscillator [QuantAlgo]The Aurora Flow Oscillator is an advanced momentum-based technical indicator designed to identify market direction, momentum shifts, and potential reversal zones using adaptive filtering techniques. It visualizes price momentum through a dynamic oscillator that quantifies trend strength and direction, helping traders and investors recognize momentum shifts and trading opportunities across various timeframes and asset class.
🟢 Technical Foundation
The Aurora Flow Oscillator employs a sophisticated mathematical approach with adaptive momentum filtering to analyze market conditions, including:
Price-Based Momentum Calculation: Calculates logarithmic price changes to measure the rate and magnitude of market movement
Adaptive Momentum Filtering: Applies an advanced filtering algorithm to smooth momentum calculations while preserving important signals
Acceleration Analysis: Incorporates momentum acceleration to identify shifts in market direction before they become obvious
Signal Normalization: Automatically scales the oscillator output to a range between -100 and 100 for consistent interpretation across different market conditions
The indicator processes price data through multiple filtering stages, applying mathematical principles including exponential smoothing with adaptive coefficients. This creates an oscillator that dynamically adjusts to market volatility while maintaining responsiveness to genuine trend changes.
🟢 Key Features & Signals
1. Momentum Flow and Extreme Zone Identification
The oscillator presents market momentum through an intuitive visual display that clearly indicates both direction and strength:
Above Zero: Indicates positive momentum and potential bullish conditions
Below Zero: Indicates negative momentum and potential bearish conditions
Slope Direction: The angle and direction of the oscillator provide immediate insight into momentum strength
Zero Line Crossings: Signal potential trend changes and new directional momentum
The indicator also identifies potential overbought and oversold market conditions through extreme zone markings:
Upper Zone (>50): Indicates strong bullish momentum that may be approaching exhaustion
Lower Zone (<-50): Indicates strong bearish momentum that may be approaching exhaustion
Extreme Boundaries (±95): Mark potentially unsustainable momentum levels where reversals become increasingly likely
These zones are displayed with gradient intensity that increases as the oscillator moves toward extremes, helping traders and investors:
→ Identify potential reversal zones
→ Determine appropriate entry and exit points
→ Gauge overall market sentiment strength
2. Customizable Trading Style Presets
The Aurora Flow Oscillator offers pre-configured settings for different trading approaches:
Default (80,150): Balanced configuration suitable for most trading and investing situations.
Scalping (5,80): Highly responsive settings for ultra-short-term trades. Generates frequent signals and catches quick price movements. Best for 1-15min charts when making many trades per day.
Day Trading (8,120): Optimized for intraday movements with faster response than default settings while maintaining reasonable signal quality. Ideal for 5-60min or 4h-12h timeframes.
Swing Trading (10,200): Designed for multi-day positions with stronger noise filtering. Focuses on capturing larger price swings while avoiding minor fluctuations. Works best on 1-4h and daily charts.
Position Trading (14,250): For longer-term position traders/investors seeking significant market trends. Reduces false signals by heavily filtering market noise. Ideal for daily or even weekly charts.
Trend Following (16,300): Maximum smoothing that prioritizes established directional movements over short-term fluctuations. Best used on daily and weekly charts, but can also be used for lower timeframe trading.
Countertrend (7,100): Tuned to detect potential reversals and exhaustion points in trends. More sensitive to momentum shifts than other presets. Effective on 15min-4h charts, as well as daily and weekly charts.
Each preset automatically adjusts internal parameters for optimal performance in the selected trading context, providing flexibility across different market approaches without requiring complex manual configuration.
🟢 Practical Usage Tips
1/ Trend Analysis and Interpretation
→ Direction Assessment: Evaluate the oscillator's position relative to zero to determine underlying momentum bias
→ Momentum Strength: Measure the oscillator's distance from zero within the -100 to +100 range to quantify momentum magnitude
→ Trend Consistency: Monitor the oscillator's path for sustained directional movement without frequent zero-line crossings
→ Reversal Detection: Watch for oscillator divergence from price and deceleration of movement when approaching extreme zones
2/ Signal Generation Strategies
Depending on your trading approach, multiple signal strategies can be employed:
Trend Following Signals:
Enter long positions when the oscillator crosses above zero
Enter short positions when the oscillator crosses below zero
Add to positions on pullbacks while maintaining the overall trend direction
Countertrend Signals:
Look for potential reversals when the oscillator reaches extreme zones (±95)
Enter contrary positions when momentum shows signs of exhaustion
Use oscillator divergence with price as additional confirmation
Momentum Shift Signals:
Enter positions when oscillator changes direction after establishing a trend
Exit positions when oscillator direction reverses against your position
Scale position size based on oscillator strength percentage
3/ Timeframe Optimization
The indicator can be effectively applied across different timeframes with these considerations:
Lower Timeframes (1-15min):
Use Scalping or Day Trading presets
Focus on quick momentum shifts and zero-line crossings
Be cautious of noise in extreme market conditions
Medium Timeframes (30min-4h):
Use Default or Swing Trading presets
Look for established trends and potential reversal zones
Combine with support/resistance analysis for entry/exit precision
Higher Timeframes (Daily+):
Use Position Trading or Trend Following presets
Focus on major trend identification and long-term positioning
Use extreme zones for position management rather than immediate reversals
🟢 Pro Tips
Price Momentum Period:
→ Lower values (5-7) increase sensitivity to minor price fluctuations but capture more market noise
→ Higher values (10-16) emphasize sustained momentum shifts at the cost of delayed response
→ Adjust based on your timeframe (lower for shorter timeframes, higher for longer timeframes)
Oscillator Filter Period:
→ Lower values (80-120) produce more frequent directional changes and earlier response to momentum shifts
→ Higher values (200-300) filter out shorter-term fluctuations to highlight dominant market cycles
→ Match to your typical holding period (shorter holding time = lower filter values)
Multi-Timeframe Analysis:
→ Compare oscillator readings across different timeframes for confluence
→ Look for alignment between higher and lower timeframe signals
→ Use higher timeframe for trend direction, lower for earlier entries
Volatility-Adaptive Trading:
→ Use oscillator strength to adjust position sizing (stronger = larger)
→ Consider reducing exposure when oscillator reaches extreme zones
→ Implement tighter stops during periods of oscillator acceleration
Combination Strategies:
→ Pair with volume indicators for confirmation of momentum shifts
→ Use with support/resistance levels for strategic entry and exit points
→ Combine with volatility indicators for comprehensive market context

Fibonacci Levels with SMA SignalsThis strategy leverages Fibonacci retracement levels along with the 100-period and 200-period Simple Moving Averages (SMAs) to generate robust entry and exit signals for long-term swing trades, particularly on the daily timeframe. The combination of Fibonacci levels and SMAs provides a powerful way to capitalize on major trend reversals and market retracements, especially in stocks and major crypto assets.
The core of this strategy involves calculating key Fibonacci retracement levels (23.6%, 38.2%, 61.8%, and 78.6%) based on the highest high and lowest low over a 365-day lookback period. These Fibonacci levels act as potential support and resistance zones, indicating areas where price may retrace before continuing its trend. The 100-period SMA and 200-period SMA are used to define the broader market trend, with the strategy favoring uptrend conditions for buying and downtrend conditions for selling.
This indicator highlights high-probability zones for long or short swing setups based on Fibonacci retracements and the broader trend, using the 100 and 200 SMAs.
In addition, this strategy integrates alert conditions to notify the trader when these key conditions are met, providing real-time notifications for optimal entry and exit points. These alerts ensure that the trader does not miss significant trade opportunities.
Key Features:
Fibonacci Retracement Levels: The Fibonacci levels provide natural price zones that traders often watch for potential reversals, making them highly relevant in the context of swing trading.
100 and 200 SMAs: These moving averages help define the overall market trend, ensuring that the strategy operates in line with broader price action.
Buy and Sell Signals: The strategy generates buy signals when the price is above the 200 SMA and retraces to the 61.8% Fibonacci level. Sell signals are triggered when the price is below the 200 SMA and retraces to the 38.2% Fibonacci level.
Alert Conditions: The alert conditions notify traders when the price is at the key Fibonacci levels in the context of an uptrend or downtrend, allowing for efficient monitoring of trade opportunities.
Application:
This strategy is ideal for long-term swing trades in both stocks and major cryptocurrencies (such as BTC and ETH), particularly on the daily timeframe. The daily timeframe allows for capturing broader, more sustained trends, making it suitable for identifying high-quality entries and exits. By using the 100 and 200 SMAs, the strategy filters out noise and focuses on larger, more meaningful trends, which is especially useful for longer-term positions.
This script is optimized for swing traders looking to capitalize on retracements and trends in markets like stocks and crypto. By combining Fibonacci levels with SMAs, the strategy ensures that traders are not only entering at optimal levels but also trading in the direction of the prevailing trend.

Normalized MACD with RSI & Stoch RSI + SignalsNormalized MACD with RSI & Stoch RSI Indicator
Overview:
This indicator combines three popular momentum indicators (MACD, RSI, and Stochastic RSI) into a single cohesive, normalized view, making it easier for traders to interpret market momentum and potential buy/sell signals. It specifically addresses an important issue—the different scale ranges of indicators—by normalizing MACD values to match the 0–100 scale of RSI and Stochastic RSI.
Here’s a clear and concise description of your updated Pine Script indicator:
⸻
Normalized MACD with RSI & Stoch RSI Indicator
Overview:
This indicator combines three popular momentum indicators (MACD, RSI, and Stochastic RSI) into a single cohesive, normalized view, making it easier for traders to interpret market momentum and potential buy/sell signals. It specifically addresses an important issue—the different scale ranges of indicators—by normalizing MACD values to match the 0–100 scale of RSI and Stochastic RSI.
⸻
Key Components:
① MACD (Normalized):
• The Moving Average Convergence Divergence (MACD) originally has an unlimited numerical range.
• Normalization Method:
• Uses a custom tanh(x) function implemented directly in Pine Script:
\tanh(x) = \frac{e^{x}-e^{-x}}{e^{x}+e^{-x}}
• MACD values are scaled using this method to a range of 0–100, with the neutral line at exactly 50.
• Interpretation:
• Values above 50 indicate bullish momentum.
• Values below 50 indicate bearish momentum.
② RSI (Relative Strength Index):
• Measures market momentum on a 0–100 scale.
• Traditional RSI interpretation:
• Overbought conditions: RSI > 70–80.
• Oversold conditions: RSI < 30–20.
③ Stochastic RSI:
• Combines RSI and Stochastic Oscillator to give short-term, highly sensitive signals.
• Helps identify immediate market extremes:
• Above 80 → Short-term overbought.
• Below 20 → Short-term oversold.
⸻
How the Indicator Works:
• Visualization:
• All three indicators (Normalized MACD, RSI, Stochastic RSI) share the same 0–100 scale.
• Clear visual lines and reference levels:
• Midline at 50 indicates neutral momentum.
• Dashed lines at 20 and 80 clearly mark oversold/overbought zones.
• Trading Signals (Recommended approach):
• Bullish Signal (Potential Buy):
• Normalized MACD crosses above 50.
• RSI below or approaching oversold zone (below 30–20).
• Stochastic RSI below 20, indicating short-term oversold conditions.
• Bearish Signal (Potential Sell):
• Normalized MACD crosses below 50.
• RSI above or approaching overbought zone (above 70–80).
• Stochastic RSI above 80, indicating short-term overbought conditions.
⸻
Why Use This Indicator?
• Harmonized Signals:
Normalization of MACD significantly improves clarity and comparability with RSI and Stochastic RSI, providing a unified momentum picture.
• Intuitive Analysis:
Traders can rapidly and intuitively identify momentum shifts without needing multiple indicator windows.
• Improved Decision-Making:
Clear visual references and signals help reduce subjective interpretation, potentially improving trading outcomes.
⸻
Suggested Usage:
• Combine with traditional support

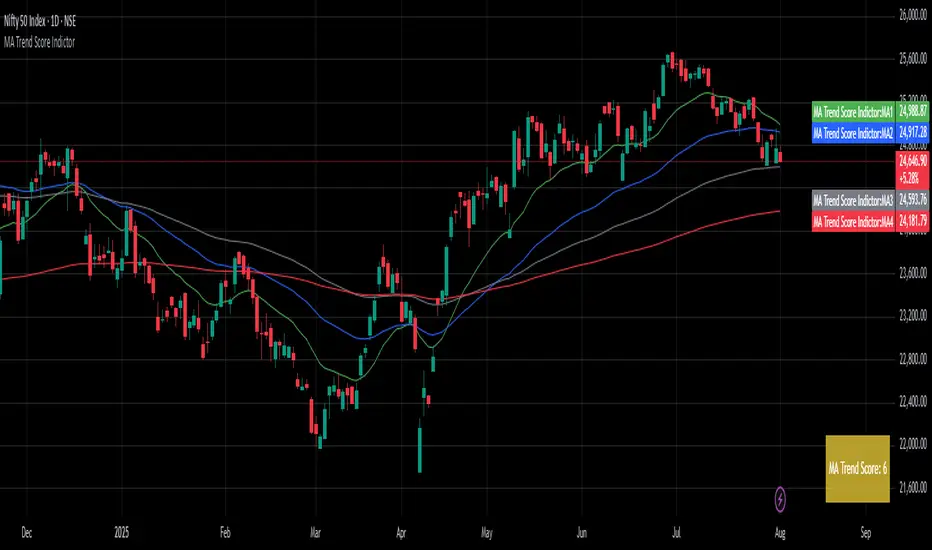
MA Trend ScoreA Trend Score Indicator inspired by an interview by Navy Ramavat, where I liked the idea presented and decided to publish a script for it.
Disclaimer: I am not associated with Navy Ramavat in any manner.
The goal is to objectify the trend of an instrument and calculate a score which represents the trend strength and direction.
The score is calculated as follows:
If price is > EMA 20 add 1 to the score
If price is > EMA 50 add 1 to the score
If price is > EMA 100 add 1 to the score
If EMA 20 is > EMA 50 add 1 to the score
If EMA 20 is > EMA 100 add 1 to the score
If EMA 50 is > EMA 100 add 1 to the score
If EMA 20 is < EMA 50 deduct 1 from the score
If EMA 20 is < EMA 100 deduct 1 from the score
If EMA 50 is < EMA 100 deduct 1 from the score
The highest score can be 6, and lowest score can be -6
The trend score can be used as per your discretion on the long and short side.
An example of using the trend score on the long side for position sizing is:
100% position size if Score greater than 4
75% position size if Score between 2-4
50% position size if Score between 0-2
25% position size if Score between 0 and -2
0% position size if Score is less than -2
Adaptive Regression Channel [MissouriTim]The Adaptive Regression Channel (ARC) is a technical indicator designed to empower traders with a clear, adaptable, and precise view of market trends and price boundaries. By blending advanced statistical techniques with real-time market data, ARC delivers a comprehensive tool that dynamically adjusts to price action, volatility, volume, and momentum. Whether you’re navigating the fast-paced world of cryptocurrencies, the steady trends of stocks, or the intricate movements of FOREX pairs, ARC provides a robust framework for identifying opportunities and managing risk.
Core Components
1. Color-Coded Regression Line
ARC’s centerpiece is a linear regression line derived from a Weighted Moving Average (WMA) of closing prices. This line adapts its calculation period based on market volatility (via ATR) and is capped between a minimum of 20 bars and a maximum of 1.5 times the user-defined base length (default 100). Visually, it shifts colors to reflect trend direction: green for an upward slope (bullish) and red for a downward slope (bearish), offering an instant snapshot of market sentiment.
2. Dynamic Residual Channels
Surrounding the regression line are upper (red) and lower (green) channels, calculated using the standard deviation of residuals—the difference between actual closing prices and the regression line. This approach ensures the channels precisely track how closely prices follow the trend, rather than relying solely on overall price volatility. The channel width is dynamically adjusted by a multiplier that factors in:
Volatility: Measured through the Average True Range (ATR), widening channels during turbulent markets.
Trend Strength: Based on the regression slope, expanding channels in strong trends and contracting them in consolidation phases.
3. Volume-Weighted Moving Average (VWMA)
Plotted in orange, the VWMA overlays a volume-weighted price trend, emphasizing movements backed by significant trading activity. This complements the regression line, providing additional confirmation of trend validity and potential breakout strength.
4. Scaled RSI Overlay
ARC features a Relative Strength Index (RSI) overlay, plotted in purple and scaled to hover closely around the regression line. This compact display reflects momentum shifts within the trend’s context, keeping RSI visible on the price chart without excessive swings. User-defined overbought (default 70) and oversold (default 30) levels offer reference points for momentum analysis."
Technical Highlights
ARC leverages a volatility-adjusted lookback period, residual-based channel construction, and multi-indicator integration to achieve high accuracy. Its parameters—such as base length, channel width, ATR period, and RSI length—are fully customizable, allowing traders to tailor it to their specific needs.
Why Choose ARC?
ARC stands out for its adaptability and precision. The residual-based channels offer tighter, more relevant support and resistance levels compared to standard volatility measures, while the dynamic adjustments ensure it performs well in both trending and ranging markets. The inclusion of VWMA and scaled RSI adds depth, merging trend, volume, and momentum into a single, cohesive overlay. For traders seeking a versatile, all-in-one indicator, ARC delivers actionable insights with minimal noise.
Best Ways to Use the Adaptive Regression Channel (ARC)
The Adaptive Regression Channel (ARC) is a flexible tool that supports a variety of trading strategies, from trend-following to breakout detection. Below are the most effective ways to use ARC, along with practical tips for maximizing its potential. Adjustments to its settings may be necessary depending on the timeframe (e.g., intraday vs. daily) and the asset being traded (e.g., stocks, FOREX, cryptocurrencies), as each market exhibits unique volatility and behavior.
1. Trend Following
• How to Use: Rely on the regression line’s color to guide your trades. A green line (upward slope) signals a bullish trend—consider entering or holding long positions. A red line (downward slope) indicates a bearish trend—look to short or exit longs.
• Best Practice: Confirm the trend with the VWMA (orange line). Price above the VWMA in a green uptrend strengthens the bullish case; price below in a red downtrend reinforces bearish momentum.
• Adjustment: For short timeframes like 15-minute crypto charts, lower the Base Regression Length (e.g., to 50) for quicker trend detection. For weekly stock charts, increase it (e.g., to 200) to capture broader movements.
2. Channel-Based Trades
• How to Use: Use the upper channel (red) as resistance and the lower channel (green) as support. Buy when the price bounces off the lower channel in an uptrend, and sell or short when it rejects the upper channel in a downtrend.
• Best Practice: Check the scaled RSI (purple line) for momentum cues. A low RSI (e.g., near 30) at the lower channel suggests a stronger buy signal; a high RSI (e.g., near 70) at the upper channel supports a sell.
• Adjustment: In volatile crypto markets, widen the Base Channel Width Coefficient (e.g., to 2.5) to reduce false signals. For stable FOREX pairs (e.g., EUR/USD), a narrower width (e.g., 1.5) may work better.
3. Breakout Detection
• How to Use: Watch for price breaking above the upper channel (bullish breakout) or below the lower channel (bearish breakout). These moves often signal strong momentum shifts.
• Best Practice: Validate breakouts with VWMA position—price above VWMA for bullish breaks, below for bearish—and ensure the regression line’s slope aligns (green for up, red for down).
• Adjustment: For fast-moving assets like crypto on 1-hour charts, shorten ATR Length (e.g., to 7) to make channels more reactive. For stocks on daily charts, keep it at 14 or higher for reliability.
4. Momentum Analysis
• How to Use: The scaled RSI overlay shows momentum relative to the regression line. Rising RSI in a green uptrend confirms bullish strength; falling RSI in a red downtrend supports bearish pressure.
• Best Practice: Look for RSI divergences—e.g., price hitting new highs at the upper channel while RSI flattens or drops could signal an impending reversal.
• Adjustment: Reduce RSI Length (e.g., to 7) for intraday trading in FOREX or crypto to catch short-term momentum shifts. Increase it (e.g., to 21) for longer-term stock trades.
5. Range Trading
• How to Use: When the regression line’s slope is near zero (flat) and channels are tight, ARC indicates a ranging market. Buy near the lower channel and sell near the upper channel, targeting the regression line as the mean price.
• Best Practice: Ensure VWMA hovers close to the regression line to confirm the range-bound state.
• Adjustment: For low-volatility stocks on daily charts, use a moderate Base Regression Length (e.g., 100) and tight Base Channel Width (e.g., 1.5). For choppy crypto markets, test shorter settings.
Optimization Strategies
• Timeframe Customization: Adjust ARC’s parameters to match your trading horizon. Short timeframes (e.g., 1-minute to 1-hour) benefit from lower Base Regression Length (20–50) and ATR Length (7–10) for agility, while longer timeframes (e.g., daily, weekly) favor higher values (100–200 and 14–21) for stability.
• Asset-Specific Tuning:
○ Stocks: Use longer lengths (e.g., 100–200) and moderate widths (e.g., 1.8) for stable equities; tweak ATR Length based on sector volatility (shorter for tech, longer for utilities).
○ FOREX: Set Base Regression Length to 50–100 and Base Channel Width to 1.5–2.0 for smoother trends; adjust RSI Length (e.g., 10–14) based on pair volatility.
○ Crypto: Opt for shorter lengths (e.g., 20–50) and wider widths (e.g., 2.0–3.0) to handle rapid price swings; use a shorter ATR Length (e.g., 7) for quick adaptation.
• Backtesting: Test ARC on historical data for your asset and timeframe to optimize settings. Evaluate how often price respects channels and whether breakouts yield profitable trades.
• Enhancements: Pair ARC with volume surges, key support/resistance levels, or candlestick patterns (e.g., doji at channel edges) for higher-probability setups.
Practical Considerations
ARC’s adaptability makes it suitable for diverse markets, but its performance hinges on proper calibration. Cryptocurrencies, with their high volatility, may require shorter, wider settings to capture rapid moves, while stocks on longer timeframes benefit from broader, smoother configurations. FOREX pairs often fall in between, depending on their inherent volatility. Experiment with the adjustable parameters to align ARC with your trading style and market conditions, ensuring it delivers the precision and reliability you need.

iD EMARSI on ChartSCRIPT OVERVIEW
The EMARSI indicator is an advanced technical analysis tool that maps RSI values directly onto price charts. With adaptive scaling capabilities, it provides a unique visualization of momentum that flows naturally with price action, making it particularly valuable for FOREX and low-priced securities trading.
KEY FEATURES
1 PRICE MAPPED RSI VISUALIZATION
Unlike traditional RSI that displays in a separate window, EMARSI plots the RSI directly on the price chart, creating a flowing line that identifies momentum shifts within the context of price action:
// Map RSI to price chart with better scaling
mappedRsi = useAdaptiveScaling ?
median + ((rsi - 50) / 50 * (pQH - pQL) / 2 * math.min(1.0, 1/scalingFactor)) :
down == pQL ? pQH : up == pQL ? pQL : median - (median / (1 + up / down))
2 ADAPTIVE SCALING SYSTEM
The script features an intelligent scaling system that automatically adjusts to different market conditions and price levels:
// Calculate adaptive scaling factor based on selected method
scalingFactor = if scalingMethod == "ATR-Based"
math.min(maxScalingFactor, math.max(1.0, minTickSize / (atrValue/avgPrice)))
else if scalingMethod == "Price-Based"
math.min(maxScalingFactor, math.max(1.0, math.sqrt(100 / math.max(avgPrice, 0.01))))
else // Volume-Based
math.min(maxScalingFactor, math.max(1.0, math.sqrt(1000000 / math.max(volume, 100))))
3 MODIFIED RSI CALCULATION
EMARSI uses a specially formulated RSI calculation that works with an adaptive base value to maintain consistency across different price ranges:
// Adaptive RSI Base based on price levels to improve flow
adaptiveRsiBase = useAdaptiveScaling ? rsiBase * scalingFactor : rsiBase
// Calculate RSI components with adaptivity
up = ta.rma(math.max(ta.change(rsiSourceInput), adaptiveRsiBase), emaSlowLength)
down = ta.rma(-math.min(ta.change(rsiSourceInput), adaptiveRsiBase), rsiLengthInput)
// Improved RSI calculation with value constraint
rsi = down == 0 ? 100 : up == 0 ? 0 : 100 - (100 / (1 + up / down))
4 MOVING AVERAGE CROSSOVER SYSTEM
The indicator creates a smooth moving average of the RSI line, enabling a crossover system that generates trading signals:
// Calculate MA of mapped RSI
rsiMA = ma(mappedRsi, emaSlowLength, maTypeInput)
// Strategy entries
if ta.crossover(mappedRsi, rsiMA)
strategy.entry("RSI Long", strategy.long)
if ta.crossunder(mappedRsi, rsiMA)
strategy.entry("RSI Short", strategy.short)
5 VISUAL REFERENCE FRAMEWORK
The script includes visual guides that help interpret the RSI movement within the context of recent price action:
// Calculate pivot high and low
pQH = ta.highest(high, hlLen)
pQL = ta.lowest(low, hlLen)
median = (pQH + pQL) / 2
// Plotting
plot(pQH, "Pivot High", color=color.rgb(82, 228, 102, 90))
plot(pQL, "Pivot Low", color=color.rgb(231, 65, 65, 90))
med = plot(median, style=plot.style_steplinebr, linewidth=1, color=color.rgb(238, 101, 59, 90))
6 DYNAMIC COLOR SYSTEM
The indicator uses color fills to clearly visualize the relationship between the RSI and its moving average:
// Color fills based on RSI vs MA
colUp = mappedRsi > rsiMA ? input.color(color.rgb(128, 255, 0), '', group= 'RSI > EMA', inline= 'up') :
input.color(color.rgb(240, 9, 9, 95), '', group= 'RSI < EMA', inline= 'dn')
colDn = mappedRsi > rsiMA ? input.color(color.rgb(0, 230, 35, 95), '', group= 'RSI > EMA', inline= 'up') :
input.color(color.rgb(255, 47, 0), '', group= 'RSI < EMA', inline= 'dn')
fill(rsiPlot, emarsi, mappedRsi > rsiMA ? pQH : rsiMA, mappedRsi > rsiMA ? rsiMA : pQL, colUp, colDn)
7 REAL TIME PARAMETER MONITORING
A transparent information panel provides real-time feedback on the adaptive parameters being applied:
// Information display
var table infoPanel = table.new(position.top_right, 2, 3, bgcolor=color.rgb(0, 0, 0, 80))
if barstate.islast
table.cell(infoPanel, 0, 0, "Current Scaling Factor", text_color=color.white)
table.cell(infoPanel, 1, 0, str.tostring(scalingFactor, "#.###"), text_color=color.white)
table.cell(infoPanel, 0, 1, "Adaptive RSI Base", text_color=color.white)
table.cell(infoPanel, 1, 1, str.tostring(adaptiveRsiBase, "#.####"), text_color=color.white)
BENEFITS FOR TRADERS
INTUITIVE MOMENTUM VISUALIZATION
By mapping RSI directly onto the price chart, traders can immediately see the relationship between momentum and price without switching between different indicator windows.
ADAPTIVE TO ANY MARKET CONDITION
The three scaling methods (ATR-Based, Price-Based, and Volume-Based) ensure the indicator performs consistently across different market conditions, volatility regimes, and price levels.
PREVENTS EXTREME VALUES
The adaptive scaling system prevents the RSI from generating extreme values that exceed chart boundaries when trading low-priced securities or during high volatility periods.
CLEAR TRADING SIGNALS
The RSI and moving average crossover system provides clear entry signals that are visually reinforced through color changes, making it easy to identify potential trading opportunities.
SUITABLE FOR MULTIPLE TIMEFRAMES
The indicator works effectively across multiple timeframes, from intraday to daily charts, making it versatile for different trading styles and strategies.
TRANSPARENT PARAMETER ADJUSTMENT
The information panel provides real-time feedback on how the adaptive system is adjusting to current market conditions, helping traders understand why the indicator is behaving as it is.
CUSTOMIZABLE VISUALIZATION
Multiple visualization options including Bollinger Bands, different moving average types, and customizable colors allow traders to adapt the indicator to their personal preferences.
CONCLUSION
The EMARSI indicator represents a significant advancement in RSI visualization by directly mapping momentum onto price charts with adaptive scaling. This approach makes momentum shifts more intuitive to identify and helps prevent the scaling issues that commonly affect RSI-based indicators when applied to low-priced securities or volatile markets.

GRID EXTENSIONGRID EXTENSION
Overview
The GRID EXTENSION is a simple grid-based indicator for TradingView, built with Pine Script v6. It plots horizontal price levels starting from a user-defined anchor price, with spacing set by a tick increment. Use it to identify key support, resistance, or price zones on charts for Crypto, Forex, or Futures.
Key Features
Custom Grid Levels: Plot up to 22 levels (e.g., 0, 0.25, 1.25, -2.50) with options to show/hide, set values, and choose colors.
Market-Specific Tick Increments: Select your asset type (Crypto, Forex, Futures) and choose from a range of tick increments tailored for each market:
Crypto: 1 to 5000 ticks (e.g., 100 ticks = $0.001 on ADA/USD, 5000 ticks = $50 on BTC/USD).
Forex: 5 to 5000 ticks (e.g., 100 ticks = 1 pip on EUR/USD, 5000 ticks = 50 pips).
Futures: 1 to 2500 ticks (e.g., 25 ticks = 6.25 points on E-mini S&P 500, $312.50 per contract).
Visual Options:
Extend lines to the right.
Show price and level labels (as values or percentages).
Place labels on the left or right.
Adjust background transparency for filled areas between levels.
How to Use
Set Asset Type: Choose "Crypto," "Forex," or "Futures" to match your chart.
Set Anchor Price: Enter a starting price for the grid.
Pick Tick Increment: Select a tick increment from the dropdown, following the guidance for your asset type (see Key Features).
Customize Levels: Turn levels on/off, set values, and pick colors.
Add to Chart: Apply the indicator to see the grid on your chart.
Tips
Use levels to mark support/resistance zones for entries or exits.
Extend lines to project future price zones.
Choose smaller increments (e.g., 5 ticks) for scalping, or larger ones (e.g., 1000 ticks) for swing trading.
Combine with indicators like moving averages for better signals.
Settings
Asset Type: Select "Crypto," "Forex," or "Futures" (default: "Crypto").
Anchor Price: Starting price for the grid (default: 0.0).
Tick Increment: Space between levels (options: 1, 5, 10, 25, 50, 100, 250, 500, 1000, 2500, 5000). Choose based on asset type.
Extend Right: Extend lines to the right (default: true).
Show Prices: Show price labels (default: true).
Show Levels: Show level values or percentages (default: true).
Format: Display levels as "Values" or "Percent" (default: "Values").
Labels Position: Place labels on "Left" or "Right" (default: "Left").
Background Transparency: Set transparency for filled areas (default: 100, range 0-100).
Level Options: Enable/disable levels, set values, and choose colors.
Notes
Set the anchor price to a key level (like a recent high or low) for best results.
Check the tick increment tooltip to ensure the spacing suits your market type.
Works on any chart, best for clear price trends or ranges.
Acknowledgments
Made with Pine Script v6 for TradingView. This is v1.0—feedback welcome for future updates!

Cognitive Echo IndexCognitive Echo Index – User Guide
Overview
The Cognitive Echo Index is a composite indicator that combines several technical aspects—including price deviation from a moving average, normalized volatility (via ATR), and volume variations—to create a single numeric value. The output is scaled between -100 and +100, offering insights into market momentum and potential trend reversals.
How It Works
Price Component:
The indicator calculates the percentage change between the current price and its 14-period simple moving average (SMA). This helps identify how far the price deviates from its recent trend.
Volatility Component:
Using the Average True Range (ATR) over a 14-period, the script normalizes current ATR against its 14-period SMA. This shows relative volatility, highlighting unusual market activity.
Volume Component:
It computes the percentage change between the current volume and its 14-period SMA to detect spikes or drops in trading activity.
Composite Calculation:
The three components are summed together to produce the final index value, which is then clipped to remain between -100 and +100.
Interpreting the Indicator
Indicator Value Scale:
Positive Values (0 to +100):
Suggest that bullish forces are stronger. Higher values (e.g., above +50) could indicate a strong bullish sentiment.
Negative Values (0 to -100):
Indicate bearish pressures. Lower values (e.g., below -50) may signal strong bearish conditions.
Zero Level:
The midline indicates a balanced market condition with no dominant trend.
Key Horizontal Levels:
+50 Level:
When the indicator crosses above +50, it can be interpreted as a strong bullish signal.
-50 Level:
When the indicator crosses below -50, it can be considered a strong bearish signal.
Usage Tips
Confirmation Tool:
Use the Cognitive Echo Index as an additional confirmation tool in conjunction with other technical indicators or chart patterns to make more informed trading decisions.
Parameter Adjustments:
The script uses a 14-period setting for the moving average, ATR, and volume SMA by default. Depending on your trading timeframe or asset, consider tweaking these periods for better sensitivity.
Trend Analysis:
Watch how the indicator behaves during major price moves. A divergence between the index and the price trend (e.g., price rises while the index falls) may suggest a potential reversal or a false breakout.
Risk Management:
Always incorporate sound risk management practices. Use stop losses and position sizing rules, and consider the indicator as one part of your overall trading strategy.
Customization
Adjusting the Weights:
Although the current version gives equal weight to all three components, advanced users can modify the script to apply different weights to the price, volatility, and volume components based on historical performance or specific market conditions.
Adding Additional Inputs:
Future versions could incorporate external sentiment data or other technical factors if accessible. For now, the indicator focuses on technical inputs available directly within TradingView.
By following this guide, traders can integrate the Cognitive Echo Index into their TradingView platform to gain a unique perspective on market momentum and potential turning points. Enjoy testing and refining the indicator to better suit your trading style!
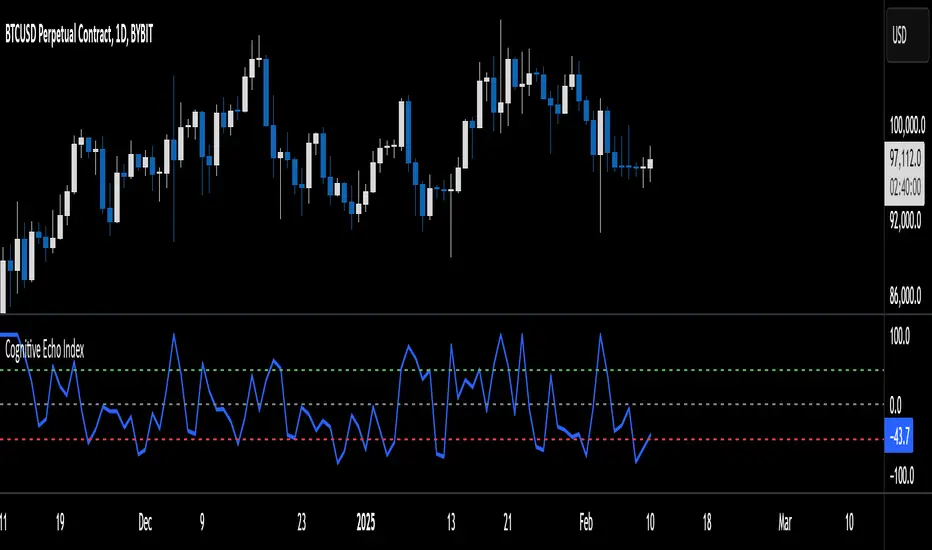
Market Participation Ratio-MPR(TechnoBlooms)Market Participation Ratio (MPR) Indicator - Description
The Market Participation Ratio (MPR) is a custom indicator designed to assess market activity by analyzing price and volume relationships over a specified period. This indicator is useful for identifying trends, participation levels, and key thresholds in market behavior.
Key Features:
1. MPR Calculation:
o The indicator calculates a ratio of the current price and volume relative to their respective moving averages over a user-defined period (Length).
o This ratio is scaled to 100 for better visualization and comparison.
2. Smoothing:
o To reduce noise and make the trend clearer, the MPR is smoothed using an Exponential Moving Average (Smoothing Length), making it easier to interpret.
3. Zero Line & Threshold Levels:
o A zero line at 0 is plotted for baseline comparison.
o Horizontal reference lines at 100 (threshold for strong participation) and 50 (optional secondary level) help in evaluating market trends.
Usage:
• Traders can use the MPR to identify when market participation is increasing or decreasing, which may signal potential trend reversals or continuations.
• Values above 100 often suggest robust market activity, favorable for long positions.
• Values below 100 may indicate waning interest, potentially signaling pullbacks or bearish trends.
Customizable Inputs:
• Length: Adjusts the moving average period for price and volume calculations.
• Smoothing Length: Determines the degree of smoothing applied to the MPR.
Applications:
• Trend Analysis: Detect shifts in bullish or bearish momentum based on participation levels.
• Market Strength: Identify periods of increased or reduced market involvement by traders and investors.
• Entry/Exit Signals: Use levels around 100 as potential cues for positioning in the market.
This indicator is versatile for both short-term and long-term trading strategies and is a valuable addition for technical analysis enthusiasts seeking deeper insights into market dynamics.

13W High/Low/Fibs w/100D SMAIndicator: 13 Week High/100 Day SMA/13 Week Low with 0.382, 0.5, and 0.618 Fibonacci Levels
Description:
This indicator for TradingView, written in Pine Script version 6
It displays a table on the chart that provides a visual analysis of key price levels based on a 13-week timeframe and a 100-day Simple Moving Average (SMA).
Core Calculations:
100-Day SMA: The indicator calculates the 100-day Simple Moving Average of the closing price using daily data. The SMA is a widely used trend-following indicator.
13-Week High and Low: The indicator calculates the highest high and lowest low over the past 13 weeks using weekly data. This provides a longer-term perspective on the price range.
13-Week Fibonacci Retracement Levels: Based on the calculated 13-week high and low, the script determines the 0.382, 0.5, and 0.618 Fibonacci retracement levels.
The table includes the following information:
13W High: The highest price reached over the last 13 weeks.
100D SMA: The calculated 100-day Simple Moving Average value.
13W Low: The lowest price reached over the last 13 weeks.
Fibonacci Levels: The 0.382, 0.5, and 0.618 Fibonacci retracement levels, labeled as "↗," "|," and "↘," respectively.

Multi-Timeframe Stochastic Alert [tradeviZion]# Multi-Timeframe Stochastic Alert : Complete User Guide
## 1. Introduction
### What is the Multi-Timeframe Stochastic Alert?
The Multi-Timeframe Stochastic Alert is an advanced technical analysis tool that helps traders identify potential trading opportunities by analyzing momentum across multiple timeframes. It combines the power of the stochastic oscillator with multi-timeframe analysis to provide more reliable trading signals.
### Key Features and Benefits
- Simultaneous analysis of 6 different timeframes
- Advanced alert system with customizable conditions
- Real-time visual feedback with color-coded signals
- Comprehensive data table with instant market insights
- Motivational trading messages for psychological support
- Flexible theme support for comfortable viewing
### How it Can Help Your Trading
- Identify stronger trends by confirming momentum across multiple timeframes
- Reduce false signals through multi-timeframe confirmation
- Stay informed of market changes with customizable alerts
- Make more informed decisions with comprehensive market data
- Maintain trading discipline with clear visual signals
## 2. Understanding the Display
### The Stochastic Chart
The main chart displays three key components:
1. ** K-Line (Fast) **: The primary stochastic line (default color: green)
2. ** D-Line (Slow) **: The signal line (default color: red)
3. ** Reference Lines **:
- Overbought Level (80): Upper dashed line
- Middle Line (50): Center dashed line
- Oversold Level (20): Lower dashed line
### The Information Table
The table provides a comprehensive view of stochastic readings across all timeframes. Here's what each column means:
#### Column Explanations:
1. ** Timeframe **
- Shows the time period for each row
- Example: "5" = 5 minutes, "15" = 15 minutes, etc.
2. ** K Value **
- The fast stochastic line value (0-100)
- Higher values indicate stronger upward momentum
- Lower values indicate stronger downward momentum
3. ** D Value **
- The slow stochastic line value (0-100)
- Helps confirm momentum direction
- Crossovers with K-line can signal potential trades
4. ** Status **
- Shows current momentum with symbols:
- ▲ = Increasing (bullish)
- ▼ = Decreasing (bearish)
- Color matches the trend direction
5. ** Trend **
- Shows the current market condition:
- "Overbought" (above 80)
- "Bullish" (above 50)
- "Bearish" (below 50)
- "Oversold" (below 20)
#### Row Explanations:
1. ** Title Row **
- Shows "🎯 Multi-Timeframe Stochastic"
- Indicates the indicator is active
2. ** Header Row **
- Contains column titles
- Dark blue background for easy reading
3. ** Timeframe Rows **
- Six rows showing different timeframe analyses
- Each row updates independently
- Color-coded for easy trend identification
4. **Message Row**
- Shows rotating motivational messages
- Updates every 5 bars
- Helps maintain trading discipline
### Visual Indicators and Colors
- ** Green Background **: Indicates bullish conditions
- ** Red Background **: Indicates bearish conditions
- ** Color Intensity **: Shows strength of the signal
- ** Background Highlights **: Appear when alert conditions are met
## 3. Core Settings Groups
### Stochastic Settings
These settings control the core calculation of the stochastic oscillator.
1. ** Length (Default: 14) **
- What it does: Determines the lookback period for calculations
- Higher values (e.g., 21): More stable, fewer signals
- Lower values (e.g., 8): More sensitive, more signals
- Recommended:
* Day Trading: 8-14
* Swing Trading: 14-21
* Position Trading: 21-30
2. ** Smooth K (Default: 3) **
- What it does: Smooths the main stochastic line
- Higher values: Smoother line, fewer false signals
- Lower values: More responsive, but more noise
- Recommended:
* Day Trading: 2-3
* Swing Trading: 3-5
* Position Trading: 5-7
3. ** Smooth D (Default: 3) **
- What it does: Smooths the signal line
- Works in conjunction with Smooth K
- Usually kept equal to or slightly higher than Smooth K
- Recommended: Keep same as Smooth K for consistency
4. ** Source (Default: Close) **
- What it does: Determines price data for calculations
- Options: Close, Open, High, Low, HL2, HLC3, OHLC4
- Recommended: Stick with Close for most reliable signals
### Timeframe Settings
Controls the multiple timeframes analyzed by the indicator.
1. ** Main Timeframes (TF1-TF6) **
- TF1 (Default: 10): Shortest timeframe for quick signals
- TF2 (Default: 15): Short-term trend confirmation
- TF3 (Default: 30): Medium-term trend analysis
- TF4 (Default: 30): Additional medium-term confirmation
- TF5 (Default: 60): Longer-term trend analysis
- TF6 (Default: 240): Major trend confirmation
Recommended Combinations:
* Scalping: 1, 3, 5, 15, 30, 60
* Day Trading: 5, 15, 30, 60, 240, D
* Swing Trading: 15, 60, 240, D, W, M
2. ** Wait for Bar Close (Default: true) **
- What it does: Controls when calculations update
- True: More reliable but slightly delayed signals
- False: Faster signals but may change before bar closes
- Recommended: Keep True for more reliable signals
### Alert Settings
#### Main Alert Settings
1. ** Enable Alerts (Default: true) **
- Master switch for all alert notifications
- Toggle this off when you don't want any alerts
- Useful during testing or when you want to focus on visual signals only
2. ** Alert Condition (Options) **
- "Above Middle": Bullish momentum alerts only
- "Below Middle": Bearish momentum alerts only
- "Both": Alerts for both directions
- Recommended:
* Trending Markets: Choose direction matching the trend
* Ranging Markets: Use "Both" to catch reversals
* New Traders: Start with "Both" until you develop a specific strategy
3. ** Alert Frequency **
- "Once Per Bar": Immediate alerts during the bar
- "Once Per Bar Close": Alerts only after bar closes
- Recommended:
* Day Trading: "Once Per Bar" for quick reactions
* Swing Trading: "Once Per Bar Close" for confirmed signals
* Beginners: "Once Per Bar Close" to reduce false signals
#### Timeframe Check Settings
1. ** First Check (TF1) **
- Purpose: Confirms basic trend direction
- Alert Triggers When:
* For Bullish: Stochastic is above middle line (50)
* For Bearish: Stochastic is below middle line (50)
* For Both: Triggers in either direction based on position relative to middle line
- Settings:
* Enable/Disable: Turn first check on/off
* Timeframe: Default 5 minutes
- Best Used For:
* Quick trend confirmation
* Entry timing
* Scalping setups
2. ** Second Check (TF2) **
- Purpose: Confirms both position and momentum
- Alert Triggers When:
* For Bullish: Stochastic is above middle line AND both K&D lines are increasing
* For Bearish: Stochastic is below middle line AND both K&D lines are decreasing
* For Both: Triggers based on position and direction matching current condition
- Settings:
* Enable/Disable: Turn second check on/off
* Timeframe: Default 15 minutes
- Best Used For:
* Trend strength confirmation
* Avoiding false breakouts
* Day trading setups
3. ** Third Check (TF3) **
- Purpose: Confirms overall momentum direction
- Alert Triggers When:
* For Bullish: Both K&D lines are increasing (momentum confirmation)
* For Bearish: Both K&D lines are decreasing (momentum confirmation)
* For Both: Triggers based on matching momentum direction
- Settings:
* Enable/Disable: Turn third check on/off
* Timeframe: Default 30 minutes
- Best Used For:
* Major trend confirmation
* Swing trading setups
* Avoiding trades against the main trend
Note: All three conditions must be met simultaneously for the alert to trigger. This multi-timeframe confirmation helps reduce false signals and provides stronger trade setups.
#### Alert Combinations Examples
1. ** Conservative Setup **
- Enable all three checks
- Use "Once Per Bar Close"
- Timeframe Selection Example:
* First Check: 15 minutes
* Second Check: 1 hour (60 minutes)
* Third Check: 4 hours (240 minutes)
- Wider gaps between timeframes reduce noise and false signals
- Best for: Swing trading, beginners
2. ** Aggressive Setup **
- Enable first two checks only
- Use "Once Per Bar"
- Timeframe Selection Example:
* First Check: 5 minutes
* Second Check: 15 minutes
- Closer timeframes for quicker signals
- Best for: Day trading, experienced traders
3. ** Balanced Setup **
- Enable all checks
- Use "Once Per Bar"
- Timeframe Selection Example:
* First Check: 5 minutes
* Second Check: 15 minutes
* Third Check: 1 hour (60 minutes)
- Balanced spacing between timeframes
- Best for: All-around trading
### Visual Settings
#### Alert Visual Settings
1. ** Show Background Color (Default: true) **
- What it does: Highlights chart background when alerts trigger
- Benefits:
* Makes signals more visible
* Helps spot opportunities quickly
* Provides visual confirmation of alerts
- When to disable:
* If using multiple indicators
* When preferring a cleaner chart
* During manual backtesting
2. ** Background Transparency (Default: 90) **
- Range: 0 (solid) to 100 (invisible)
- Recommended Settings:
* Clean Charts: 90-95
* Multiple Indicators: 85-90
* Single Indicator: 80-85
- Tip: Adjust based on your chart's overall visibility
3. ** Background Colors **
- Bullish Background:
* Default: Green
* Indicates upward momentum
* Customizable to match your theme
- Bearish Background:
* Default: Red
* Indicates downward momentum
* Customizable to match your theme
#### Level Settings
1. ** Oversold Level (Default: 20) **
- Traditional Setting: 20
- Adjustable Range: 0-100
- Usage:
* Lower values (e.g., 10): More conservative
* Higher values (e.g., 30): More aggressive
- Trading Applications:
* Potential bullish reversal zone
* Support level in uptrends
* Entry point for long positions
2. ** Overbought Level (Default: 80) **
- Traditional Setting: 80
- Adjustable Range: 0-100
- Usage:
* Lower values (e.g., 70): More aggressive
* Higher values (e.g., 90): More conservative
- Trading Applications:
* Potential bearish reversal zone
* Resistance level in downtrends
* Exit point for long positions
3. ** Middle Line (Default: 50) **
- Purpose: Trend direction separator
- Applications:
* Above 50: Bullish territory
* Below 50: Bearish territory
* Crossing 50: Potential trend change
- Trading Uses:
* Trend confirmation
* Entry/exit trigger
* Risk management level
#### Color Settings
1. ** Bullish Color (Default: Green) **
- Used for:
* K-Line (Main stochastic line)
* Status symbols when trending up
* Trend labels for bullish conditions
- Customization:
* Choose colors that stand out
* Match your trading platform theme
* Consider color blindness accessibility
2. ** Bearish Color (Default: Red) **
- Used for:
* D-Line (Signal line)
* Status symbols when trending down
* Trend labels for bearish conditions
- Customization:
* Choose contrasting colors
* Ensure visibility on your chart
* Consider monitor settings
3. ** Neutral Color (Default: Gray) **
- Used for:
* Middle line (50 level)
- Customization:
* Should be less prominent
* Easy on the eyes
* Good background contrast
### Theme Settings
1. **Color Theme Options**
- Dark Theme (Default):
* Dark background with white text
* Optimized for dark chart backgrounds
* Reduces eye strain in low light
- Light Theme:
* Light background with black text
* Better visibility in bright conditions
- Custom Theme:
* Use your own color preferences
2. ** Available Theme Colors **
- Table Background
- Table Text
- Table Headers
Note: The theme affects only the table display colors. The stochastic lines and alert backgrounds use their own color settings.
### Table Settings
#### Position and Size
1. ** Table Position **
- Options:
* Top Right (Default)
* Middle Right
* Bottom Right
* Top Left
* Middle Left
* Bottom Left
- Considerations:
* Chart space utilization
* Personal preference
* Multiple monitor setups
2. ** Text Sizes **
- Title Size Options:
* Tiny: Minimal space usage
* Small: Compact but readable
* Normal (Default): Standard visibility
* Large: Enhanced readability
* Huge: Maximum visibility
- Data Size Options:
* Recommended: One size smaller than title
* Adjust based on screen resolution
* Consider viewing distance
3. ** Empowering Messages **
- Purpose:
* Maintain trading discipline
* Provide psychological support
* Remind of best practices
- Rotation:
* Changes every 5 bars
* Categories include:
- Market Wisdom
- Strategy & Discipline
- Mindset & Growth
- Technical Mastery
- Market Philosophy
## 4. Setting Up for Different Trading Styles
### Day Trading Setup
1. **Timeframes**
- Primary: 5, 15, 30 minutes
- Secondary: 1H, 4H
- Alert Settings: "Once Per Bar"
2. ** Stochastic Settings **
- Length: 8-14
- Smooth K/D: 2-3
- Alert Condition: Match market trend
3. ** Visual Settings **
- Background: Enabled
- Transparency: 85-90
- Theme: Based on trading hours
### Swing Trading Setup
1. ** Timeframes **
- Primary: 1H, 4H, Daily
- Secondary: Weekly
- Alert Settings: "Once Per Bar Close"
2. ** Stochastic Settings **
- Length: 14-21
- Smooth K/D: 3-5
- Alert Condition: "Both"
3. ** Visual Settings **
- Background: Optional
- Transparency: 90-95
- Theme: Personal preference
### Position Trading Setup
1. ** Timeframes **
- Primary: Daily, Weekly
- Secondary: Monthly
- Alert Settings: "Once Per Bar Close"
2. ** Stochastic Settings **
- Length: 21-30
- Smooth K/D: 5-7
- Alert Condition: "Both"
3. ** Visual Settings **
- Background: Disabled
- Focus on table data
- Theme: High contrast
## 5. Troubleshooting Guide
### Common Issues and Solutions
1. ** Too Many Alerts **
- Cause: Settings too sensitive
- Solutions:
* Increase timeframe intervals
* Use "Once Per Bar Close"
* Enable fewer timeframe checks
* Adjust stochastic length higher
2. ** Missed Signals **
- Cause: Settings too conservative
- Solutions:
* Decrease timeframe intervals
* Use "Once Per Bar"
* Enable more timeframe checks
* Adjust stochastic length lower
3. ** False Signals **
- Cause: Insufficient confirmation
- Solutions:
* Enable all three timeframe checks
* Use larger timeframe gaps
* Wait for bar close
* Confirm with price action
4. ** Visual Clarity Issues **
- Cause: Poor contrast or overlap
- Solutions:
* Adjust transparency
* Change theme settings
* Reposition table
* Modify color scheme
### Best Practices
1. ** Getting Started **
- Start with default settings
- Use "Both" alert condition
- Enable all timeframe checks
- Wait for bar close
- Monitor for a few days
2. ** Fine-Tuning **
- Adjust one setting at a time
- Document changes and results
- Test in different market conditions
- Find your optimal timeframe combination
- Balance sensitivity with reliability
3. ** Risk Management **
- Don't trade against major trends
- Confirm signals with price action
- Use appropriate position sizing
- Set clear stop losses
- Follow your trading plan
4. ** Regular Maintenance **
- Review settings weekly
- Adjust for market conditions
- Update color scheme for visibility
- Clean up chart regularly
- Maintain trading journal
## 6. Tips for Success
1. ** Entry Strategies **
- Wait for all timeframes to align
- Confirm with price action
- Use proper position sizing
- Consider market conditions
2. ** Exit Strategies **
- Trail stops using indicator levels
- Take partial profits at targets
- Honor your stop losses
- Don't fight the trend
3. ** Psychology **
- Stay disciplined with settings
- Don't override system signals
- Keep emotions in check
- Learn from each trade
4. ** Continuous Improvement **
- Record your trades
- Review performance regularly
- Adjust settings gradually
- Stay educated on markets

JordanSwindenLibraryLibrary "JordanSwindenLibrary"
TODO: add library description here
getDecimals()
Calculates how many decimals are on the quote price of the current market
Returns: The current decimal places on the market quote price
getPipSize(multiplier)
Calculates the pip size of the current market
Parameters:
multiplier (int) : The mintick point multiplier (1 by default, 10 for FX/Crypto/CFD but can be used to override when certain markets require)
Returns: The pip size for the current market
truncate(number, decimalPlaces)
Truncates (cuts) excess decimal places
Parameters:
number (float) : The number to truncate
decimalPlaces (simple float) : (default=2) The number of decimal places to truncate to
Returns: The given number truncated to the given decimalPlaces
toWhole(number)
Converts pips into whole numbers
Parameters:
number (float) : The pip number to convert into a whole number
Returns: The converted number
toPips(number)
Converts whole numbers back into pips
Parameters:
number (float) : The whole number to convert into pips
Returns: The converted number
getPctChange(value1, value2, lookback)
Gets the percentage change between 2 float values over a given lookback period
Parameters:
value1 (float) : The first value to reference
value2 (float) : The second value to reference
lookback (int) : The lookback period to analyze
Returns: The percent change over the two values and lookback period
random(minRange, maxRange)
Wichmann–Hill Pseudo-Random Number Generator
Parameters:
minRange (float) : The smallest possible number (default: 0)
maxRange (float) : The largest possible number (default: 1)
Returns: A random number between minRange and maxRange
bullFib(priceLow, priceHigh, fibRatio)
Calculates a bullish fibonacci value
Parameters:
priceLow (float) : The lowest price point
priceHigh (float) : The highest price point
fibRatio (float) : The fibonacci % ratio to calculate
Returns: The fibonacci value of the given ratio between the two price points
bearFib(priceLow, priceHigh, fibRatio)
Calculates a bearish fibonacci value
Parameters:
priceLow (float) : The lowest price point
priceHigh (float) : The highest price point
fibRatio (float) : The fibonacci % ratio to calculate
Returns: The fibonacci value of the given ratio between the two price points
getMA(length, maType)
Gets a Moving Average based on type (! MUST BE CALLED ON EVERY TICK TO BE ACCURATE, don't place in scopes)
Parameters:
length (simple int) : The MA period
maType (string) : The type of MA
Returns: A moving average with the given parameters
barsAboveMA(lookback, ma)
Counts how many candles are above the MA
Parameters:
lookback (int) : The lookback period to look back over
ma (float) : The moving average to check
Returns: The bar count of how many recent bars are above the MA
barsBelowMA(lookback, ma)
Counts how many candles are below the MA
Parameters:
lookback (int) : The lookback period to look back over
ma (float) : The moving average to reference
Returns: The bar count of how many recent bars are below the EMA
barsCrossedMA(lookback, ma)
Counts how many times the EMA was crossed recently (based on closing prices)
Parameters:
lookback (int) : The lookback period to look back over
ma (float) : The moving average to reference
Returns: The bar count of how many times price recently crossed the EMA (based on closing prices)
getPullbackBarCount(lookback, direction)
Counts how many green & red bars have printed recently (ie. pullback count)
Parameters:
lookback (int) : The lookback period to look back over
direction (int) : The color of the bar to count (1 = Green, -1 = Red)
Returns: The bar count of how many candles have retraced over the given lookback & direction
getBodySize()
Gets the current candle's body size (in POINTS, divide by 10 to get pips)
Returns: The current candle's body size in POINTS
getTopWickSize()
Gets the current candle's top wick size (in POINTS, divide by 10 to get pips)
Returns: The current candle's top wick size in POINTS
getBottomWickSize()
Gets the current candle's bottom wick size (in POINTS, divide by 10 to get pips)
Returns: The current candle's bottom wick size in POINTS
getBodyPercent()
Gets the current candle's body size as a percentage of its entire size including its wicks
Returns: The current candle's body size percentage
isHammer(fib, colorMatch)
Checks if the current bar is a hammer candle based on the given parameters
Parameters:
fib (float) : (default=0.382) The fib to base candle body on
colorMatch (bool) : (default=false) Does the candle need to be green? (true/false)
Returns: A boolean - true if the current bar matches the requirements of a hammer candle
isStar(fib, colorMatch)
Checks if the current bar is a shooting star candle based on the given parameters
Parameters:
fib (float) : (default=0.382) The fib to base candle body on
colorMatch (bool) : (default=false) Does the candle need to be red? (true/false)
Returns: A boolean - true if the current bar matches the requirements of a shooting star candle
isDoji(wickSize, bodySize)
Checks if the current bar is a doji candle based on the given parameters
Parameters:
wickSize (float) : (default=2) The maximum top wick size compared to the bottom (and vice versa)
bodySize (float) : (default=0.05) The maximum body size as a percentage compared to the entire candle size
Returns: A boolean - true if the current bar matches the requirements of a doji candle
isBullishEC(allowance, rejectionWickSize, engulfWick)
Checks if the current bar is a bullish engulfing candle
Parameters:
allowance (float) : (default=0) How many POINTS to allow the open to be off by (useful for markets with micro gaps)
rejectionWickSize (float) : (default=disabled) The maximum rejection wick size compared to the body as a percentage
engulfWick (bool) : (default=false) Does the engulfing candle require the wick to be engulfed as well?
Returns: A boolean - true if the current bar matches the requirements of a bullish engulfing candle
isBearishEC(allowance, rejectionWickSize, engulfWick)
Checks if the current bar is a bearish engulfing candle
Parameters:
allowance (float) : (default=0) How many POINTS to allow the open to be off by (useful for markets with micro gaps)
rejectionWickSize (float) : (default=disabled) The maximum rejection wick size compared to the body as a percentage
engulfWick (bool) : (default=false) Does the engulfing candle require the wick to be engulfed as well?
Returns: A boolean - true if the current bar matches the requirements of a bearish engulfing candle
isInsideBar()
Detects inside bars
Returns: Returns true if the current bar is an inside bar
isOutsideBar()
Detects outside bars
Returns: Returns true if the current bar is an outside bar
barInSession(sess, useFilter)
Determines if the current price bar falls inside the specified session
Parameters:
sess (simple string) : The session to check
useFilter (bool) : (default=true) Whether or not to actually use this filter
Returns: A boolean - true if the current bar falls within the given time session
barOutSession(sess, useFilter)
Determines if the current price bar falls outside the specified session
Parameters:
sess (simple string) : The session to check
useFilter (bool) : (default=true) Whether or not to actually use this filter
Returns: A boolean - true if the current bar falls outside the given time session
dateFilter(startTime, endTime)
Determines if this bar's time falls within date filter range
Parameters:
startTime (int) : The UNIX date timestamp to begin searching from
endTime (int) : the UNIX date timestamp to stop searching from
Returns: A boolean - true if the current bar falls within the given dates
dayFilter(monday, tuesday, wednesday, thursday, friday, saturday, sunday)
Checks if the current bar's day is in the list of given days to analyze
Parameters:
monday (bool) : Should the script analyze this day? (true/false)
tuesday (bool) : Should the script analyze this day? (true/false)
wednesday (bool) : Should the script analyze this day? (true/false)
thursday (bool) : Should the script analyze this day? (true/false)
friday (bool) : Should the script analyze this day? (true/false)
saturday (bool) : Should the script analyze this day? (true/false)
sunday (bool) : Should the script analyze this day? (true/false)
Returns: A boolean - true if the current bar's day is one of the given days
atrFilter(atrValue, maxSize)
Parameters:
atrValue (float)
maxSize (float)
tradeCount()
Calculate total trade count
Returns: Total closed trade count
isLong()
Check if we're currently in a long trade
Returns: True if our position size is positive
isShort()
Check if we're currently in a short trade
Returns: True if our position size is negative
isFlat()
Check if we're currentlyflat
Returns: True if our position size is zero
wonTrade()
Check if this bar falls after a winning trade
Returns: True if we just won a trade
lostTrade()
Check if this bar falls after a losing trade
Returns: True if we just lost a trade
maxDrawdownRealized()
Gets the max drawdown based on closed trades (ie. realized P&L). The strategy tester displays max drawdown as open P&L (unrealized).
Returns: The max drawdown based on closed trades (ie. realized P&L). The strategy tester displays max drawdown as open P&L (unrealized).
totalPipReturn()
Gets the total amount of pips won/lost (as a whole number)
Returns: Total amount of pips won/lost (as a whole number)
longWinCount()
Count how many winning long trades we've had
Returns: Long win count
shortWinCount()
Count how many winning short trades we've had
Returns: Short win count
longLossCount()
Count how many losing long trades we've had
Returns: Long loss count
shortLossCount()
Count how many losing short trades we've had
Returns: Short loss count
breakEvenCount(allowanceTicks)
Count how many break-even trades we've had
Parameters:
allowanceTicks (float) : Optional - how many ticks to allow between entry & exit price (default 0)
Returns: Break-even count
longCount()
Count how many long trades we've taken
Returns: Long trade count
shortCount()
Count how many short trades we've taken
Returns: Short trade count
longWinPercent()
Calculate win rate of long trades
Returns: Long win rate (0-100)
shortWinPercent()
Calculate win rate of short trades
Returns: Short win rate (0-100)
breakEvenPercent(allowanceTicks)
Calculate break even rate of all trades
Parameters:
allowanceTicks (float) : Optional - how many ticks to allow between entry & exit price (default 0)
Returns: Break-even win rate (0-100)
averageRR()
Calculate average risk:reward
Returns: Average winning trade divided by average losing trade
unitsToLots(units)
(Forex) Convert the given unit count to lots (multiples of 100,000)
Parameters:
units (float) : The units to convert into lots
Returns: Units converted to nearest lot size (as float)
getFxPositionSize(balance, risk, stopLossPips, fxRate, lots)
(Forex) Calculate fixed-fractional position size based on given parameters
Parameters:
balance (float) : The account balance
risk (float) : The % risk (whole number)
stopLossPips (float) : Pip distance to base risk on
fxRate (float) : The conversion currency rate (more info below in library documentation)
lots (bool) : Whether or not to return the position size in lots rather than units (true by default)
Returns: Units/lots to enter into "qty=" parameter of strategy entry function
EXAMPLE USAGE:
string conversionCurrencyPair = (strategy.account_currency == syminfo.currency ? syminfo.tickerid : strategy.account_currency + syminfo.currency)
float fx_rate = request.security(conversionCurrencyPair, timeframe.period, close )
if (longCondition)
strategy.entry("Long", strategy.long, qty=zen.getFxPositionSize(strategy.equity, 1, stopLossPipsWholeNumber, fx_rate, true))
skipTradeMonteCarlo(chance, debug)
Checks to see if trade should be skipped to emulate rudimentary Monte Carlo simulation
Parameters:
chance (float) : The chance to skip a trade (0-1 or 0-100, function will normalize to 0-1)
debug (bool) : Whether or not to display a label informing of the trade skip
Returns: True if the trade is skipped, false if it's not skipped (idea being to include this function in entry condition validation checks)
fillCell(tableID, column, row, title, value, bgcolor, txtcolor, tooltip)
This updates the given table's cell with the given values
Parameters:
tableID (table) : The table ID to update
column (int) : The column to update
row (int) : The row to update
title (string) : The title of this cell
value (string) : The value of this cell
bgcolor (color) : The background color of this cell
txtcolor (color) : The text color of this cell
tooltip (string)
Returns: Nothing.

whookLibrary "whook"
This library provides functions for generating trading alerts for `whook`
check this -> github.com
Currently supported exchanges:
Kucoin futures
Bitget futures
Coinex futures
Bingx
OKX futures ( also its demo mode )
Bybit futures ( also Bybit testnet )
Binance futures ( also Binance futures testnet )
Phemex futures ( also Phemex testnet )
Kraken futures ( also Kraken futures testnet )
# --- Test Cases ---
Note: These test cases are for demonstration purposes only and may not cover all scenarios.
// buy(string account, float amount, string unit = "units", float leverage = 1)
buy("MyAccount", 100, "units", 1)
buy("MyAccount", 1000, "USDT", 5)
buy("MyAccount", 50, "percent", 2)
// sell(string account, float amount, string unit = "units", float leverage = 1)
sell("MyAccount", 50, "units", 1)
sell("MyAccount", 500, "USDT", 3)
sell("MyAccount", 25, "percent", 2)
// set_position(string account, float amount, string unit = "units", float leverage = 1)
set_position("MyAccount", 100, "units", 1)
set_position("MyAccount", 1000, "USDT", 5)
set_position("MyAccount", 50, "percent", 2)
// limit_buy(string account, float amount, float price, string unit = "units", float leverage = 1, string id = "")
limit_buy("MyAccount", 100, 10000, "units", 1, "MyBuyOrder")
limit_buy("MyAccount", 1000, 10500, "USDT", 5)
limit_buy("MyAccount", 50, 11000, "percent", 2)
// limit_sell(string account, float amount, float price, string unit = "units", float leverage = 1, string id = "")
limit_sell("MyAccount", 50, 10000, "units", 1, "MySellOrder")
limit_sell("MyAccount", 500, 9500, "USDT", 3)
limit_sell("MyAccount", 25, 9000, "percent", 2)
// close_percent(string account, float pct = 100)
close_percent("MyAccount", 100)
close_percent("MyAccount", 50)
buy(account, amount, unit, leverage)
Sends a trading alert to execute a market buy order.
Parameters:
account (string) : The account ID.
amount (float) : The amount to buy (can be in USD, units, or percentage).
unit (string) : The unit of the amount (optional, defaults to "units").
leverage (float) : The leverage to use (optional, defaults to 1x).
sell(account, amount, unit, leverage)
Sends a trading alert to execute a market sell order.
Parameters:
account (string) : The account ID.
amount (float) : The amount to sell (can be in USD, units, or percentage).
unit (string) : The unit of the amount (optional, defaults to "units").
leverage (float) : The leverage to use (optional, defaults to 1x).
set_position(account, amount, unit, leverage)
Sends a trading alert to set a position.
Parameters:
account (string) : The account ID.
amount (float) : The amount to set the position to (can be in USD, units, or percentage).
unit (string) : The unit of the amount (optional, defaults to "units").
leverage (float) : The leverage to use (optional, defaults to 1x).
limit_buy(account, amount, price, unit, leverage, id)
Sends a trading alert to place a limit buy order.
Parameters:
account (string) : The account ID.
amount (float) : The amount to buy (can be in USD, units, or percentage).
price (float) : The limit price.
unit (string) : The unit of the amount (optional, defaults to "units").
leverage (float) : The leverage to use (optional, defaults to 1x).
id (string) : An optional custom ID for the limit order.
limit_sell(account, amount, price, unit, leverage, id)
Sends a trading alert to place a limit sell order.
Parameters:
account (string) : The account ID.
amount (float) : The amount to sell (can be in USD, units, or percentage).
price (float) : The limit price.
unit (string) : The unit of the amount (optional, defaults to "units").
leverage (float) : The leverage to use (optional, defaults to 1x).
id (string) : An optional custom ID for the limit order.
close_percent(account, pct)
Sends an alert to close a position on Phemex.
Parameters:
account (string) : The account ID.
pct (float) : The percentage of the position to close (optional, defaults to 100%).
nPOC Levels by Tyler### Explanation of the Pine Script
This Pine Script identifies and displays weekly naked Points of Control (nPOCs) on a TradingView chart. An nPOC represents a Point of Control (POC) from a previous week that has not been revisited by price action in subsequent weeks. These nPOCs are extended to the right as horizontal lines, indicating potential support or resistance levels.
#### Script Overview
1. **Indicator Declaration:**
```pinescript
//@version=5
indicator("Weekly nPOCs", overlay=true)
```
- The script is defined as a version 5 Pine Script.
- The `indicator` function sets the script's name ("Weekly nPOCs") and specifies that the indicator should be overlaid on the price chart (`overlay=true`).
2. **Function to Calculate POC:**
```pinescript
f_poc(_hl2, _vol) =>
var float vol_profile = na
if (na(vol_profile))
vol_profile := array.new_float(100, 0.0)
_bin_size = (high - low) / 100
for i = 0 to 99
if _hl2 >= low + i * _bin_size and _hl2 < low + (i + 1) * _bin_size
array.set(vol_profile, i, array.get(vol_profile, i) + _vol)
max_volume = array.max(vol_profile)
poc_index = array.indexof(vol_profile, max_volume)
poc_price = low + poc_index * _bin_size + _bin_size / 2
poc_price
```
- The function `f_poc` calculates the Point of Control (POC) for a given period.
- It takes two parameters: `_hl2` (the average of the high and low prices) and `_vol` (volume).
- A volume profile array (`vol_profile`) is initialized to store volume data across different price bins.
- The price range between the high and low is divided into 100 bins (`_bin_size`).
- The function iterates over each bin, accumulating the volumes for prices within each bin.
- The bin with the maximum volume is identified as the POC (`poc_price`).
3. **Variables to Store Weekly Data:**
```pinescript
var float poc = na
var float prev_poc = na
var line poc_lines = na
if na(poc_lines)
poc_lines := array.new_line(0)
```
- `poc` stores the current week's POC.
- `prev_poc` stores the previous week's POC.
- `poc_lines` is an array to store lines representing nPOCs. The array is initialized if it is `na` (not initialized).
4. **Calculate Weekly POC:**
```pinescript
is_new_week = ta.change(time('W')) != 0
if (is_new_week)
prev_poc := poc
poc := f_poc(hl2, volume)
if not na(prev_poc)
line new_poc_line = line.new(x1=bar_index, y1=prev_poc, x2=bar_index + 100, y2=prev_poc, color=color.red, width=2)
label.new(x=bar_index, y=prev_poc, text="nPOC", style=label.style_label_down, color=color.red, textcolor=color.white)
array.push(poc_lines, new_poc_line)
```
- `is_new_week` checks if the current bar is the start of a new week using the `ta.change(time('W'))` function.
- If it's a new week, the previous week's POC is stored in `prev_poc`, and the current week's POC is calculated using `f_poc`.
- If `prev_poc` is not `na`, a new line (`new_poc_line`) representing the nPOC is created, extending it to the right (for 100 bars).
- A label is created at the `prev_poc` level, marking it as "nPOC".
- The new line is added to the `poc_lines` array.
5. **Remove Old Lines:**
```pinescript
if array.size(poc_lines) > 52
line.delete(array.shift(poc_lines))
```
- This section ensures that only the last 52 weeks of nPOCs are kept to avoid cluttering the chart.
- If the `poc_lines` array contains more than 52 lines, the oldest line is deleted using `array.shift`.
6. **Plot the Current Week's POC as a Reference:**
```pinescript
plot(poc, title="Current Weekly POC", color=color.blue, linewidth=2, style=plot.style_line)
```
- The current week's POC is plotted as a blue line on the chart for reference.
#### Summary
This script calculates and identifies weekly Points of Control (POCs) and marks them as nPOCs if they remain untouched by subsequent price action. These nPOCs are displayed as horizontal lines extending to the right, providing traders with potential support or resistance levels. The script also manages the number of lines plotted to maintain a clear and uncluttered chart.

CCI and MACD Auto Trading Strategy with Risk/RewardOverview:
This strategy combines the Commodity Channel Index (CCI) and the Moving Average Convergence Divergence (MACD) indicators to automate trading decisions. It dynamically sets stop-loss and take-profit levels based on recent lows and highs, ensuring a risk/reward ratio of 1:1.5. This script aims to leverage trend and momentum signals while maintaining effective risk management.
Originality and Usefulness:
This script is not just a simple mashup of CCI and MACD indicators; it incorporates dynamic risk management by setting stop-loss and take-profit levels based on recent price action. This approach helps traders to:
・Identify potential trend reversals using the combination of CCI and MACD signals.
・Manage trades effectively by setting realistic stop-loss and take-profit levels based on recent market data.
・Maintain a balanced risk/reward ratio, which is essential for sustainable trading.
Indicators Used:
・CCI (Commodity Channel Index):
・Measures the deviation of the price from its average over a specified period, typically ranging from -100 to +100.
・Helps identify overbought and oversold conditions.
・MACD (Moving Average Convergence Divergence):
・Utilizes the difference between short-term and long-term moving averages to indicate trend strength and direction.
・Provides momentum signals that can be used for timing entries and exits.
How It Works:
Entry Conditions:
Long Entry:
・The MACD histogram is above zero.
・The CCI crosses above the -100 line.
Short Entry:
・The MACD histogram is below zero.
・The CCI crosses below the +100 line.
Exit Conditions:
Long Positions:
・The stop-loss is set at the recent low.
・The take-profit is set at 1.5 times the distance between the entry price and the stop-loss.
Short Positions:
・The stop-loss is set at the recent high.
・The take-profit is set at 1.5 times the distance between the entry price and the stop-loss.
Risk Management:
・The script dynamically adjusts stop-loss and take-profit levels based on recent market data, ensuring that the risk/reward ratio is maintained at 1:1.5.
・This approach helps in managing the risk effectively while aiming for consistent profits.
Strategy Properties:
・Account Size: Configured for a realistic account size suitable for the average trader.
・Commission and Slippage: Includes settings for realistic commission and slippage to reflect real market conditions.
・Risk per Trade: Designed to risk no more than 5-10% of equity per trade, aligning with sustainable trading practices.
・Backtesting Results: Configured to generate a sufficient sample size (ideally more than 100 trades) for reliable backtesting results.
Revised Backtesting Settings
Ensure that your backtesting settings are realistic:
・Account Size: Set a realistic initial capital suitable for the average trader.
・Commission and Slippage: Include realistic commission fees and slippage.
・Risk Management: Ensure that each trade risks no more than 5-10% of the account equity.
・Sufficient Sample Size: Choose a dataset that will generate more than 100 trades to provide a robust sample size.

[Pandora] Error Function Treasure Trove - ERF/ERFI/Sigmoids+PRAISE:
At this time, I have to graciously thank the wonderful minds behind the new "Pine Profiler Mode" (PPM). Directly prior to this release, it allowed me to ascertain script performance even more. While I usually write mostly in highly optimized Pine code, PPM visually identified a few bottlenecks that would otherwise be hard to identify. Anyone who contributed to PPMs creation and testing before release... BRAVO!!! I commend all of those who assisted in it's state-of-the-art engineering and inception, well done!
BACKSTORY:
This script is specifically being released in defense of another member, an exceptionally unique PhD. It was brought to my attention that a script-mod-event occurred, regarding the publishing of a measly antiquated error function (ERF) calculation within his script. This sadly resulted in the now former member jumping ship after receiving unmannerly responses amidst his curious inquiries as to why his erf() was modded. To forbid rusty and rudimentary formulations because a mod-on-duty is temporally offended by a non-nefarious release of code, is in MY opinion an injustice to principles of perpetuating open-source code intended to benefit thousands to millions of community members. While Pine is the heart and soul of TV, the mathematical concepts contributed from the minds of members is the inspirational fuel of curiosity that powers it's pertinent reason to exist and evolve.
It is an indisputable fact that most members are not greatly skilled Pine Poets. Many members may be incapable of innovating robust function code in Pine, even if they have one or more PhDs. We ALL come from various disciplines of mathematical comprehension and education. Some mathematicians are not greatly skilled at coding, while some coders are not exceptional at math. So... what am I to do to attempt to resolve this circumstantial challenge??? Those who know me best are aware that I will always side with "the right side of history" in order to accomplish my primary self-defined missions I choose to accept. Serving as an algorithmic advocate, I felt compelled to intercede by compiling numerous error functions into elegant code of very high caliber that any and every TV member may choose to employ, so this ERROR never happens again.
After weeks of contemplation into algorithms I knew little about, I prioritized myself to resolve an unanticipated matter by creating advanced formulas of exquisitely crafted error functions refined to the best of my current abilities. My aversion for unresolved problems motivated me to eviscerate error function insufficiencies with many more rigid formulations beyond what is thought to exist. ERF needed a proper algorithmic exorcism anyways. In my furiosity, I contemplated an array of madMAXimum diplomatic demolition methods, choosing the chain saw massacre technique to slaughter dysfunctionalities I encountered on a battered ERF roadway. This resulted in prolific solutions that should assuredly endure the test of time. Poetically, as you will come to see, I am ripping the lid off of Pandora's box of error functions in this case to correct wrongs into a splendid bundle of rights for members.
INTENTION:
Error function (ERF) enthusiasts... PREPARE FOR GLORY!! The specific purpose of this script is to deprecate classic error functions with the creation of a fierce and formidable army of superior formulations, each having varying attributes of computational complexity with differing absolute error ranges in their results for multiple compute scenarios. This is NOT an indicator... It is intended to allow members to embark on endeavors to advance the profound knowledge base of this growing worldwide community of 60+ million inquisitive minds. For those of you who believe computational mathematics and statistics is near completion at its finest; I am here to inform you, this is ridiculous to ponder. We are no where near statistical excellence that can and will exist eventually. At this time, metaphorically speaking, we are merely scratching microns off of the surface of the skin of a statistical apple Isaac Newton once pondered.
THIS RELEASE:
Following weeks of pondering methodical experiments beyond the ordinary, I am liberating these wild notions of my error function explorations to the entire globe as copyleft code, not just Pine. This Pandora's basket of ERFs is being openly disclosed for the sake of the sanctity of mathematics, empirical science (not the garbage we are told by CONTROLocrats to blindly trust), revolutionary cutting edge engineering, cosmology, physics, information technology, artificial intelligence, and EVERY other mathematical branch of human knowledge being discovered over centuries. I do believe James Glaisher would favor my aims concerning ERF aspirations embracing the "Power of Pine".
The included functions are intended for TV members to use in any way they see fit. This is a gift to ALL members to foster future innovative excellence on this platform. Any attempt to moderate this code without notification of "self-evident clear and just cause" will be considered an irrevocable egregious action. The original foundational PURPOSE of establishing script moderation (I clearly remember) was primarily to maintain active vigilance over a growing community against intentional nefarious actions and/or behaviors in blatant disrespect to other author's works AND also thwart rampant copypasting bandit operations, all while accommodating balanced principles of fairness for an educational community cause via open source publishing that should support future algorithmic inventions well beyond my lifespan.
APPLICATIONS:
The related error functions are used in probability theory, statistics, and numerous and engineering scientific disciplines. Its key characteristics and applications are innumerable in computational realms. Its versatility and significance make it a fundamental tool in arenas of quantitative analysis and scientific research...
Probability Theory - Is widely used in probability theory to calculate probabilities and quantiles of the normal distribution.
Statistics - It's related to the Gaussian integral and plays a crucial role in statistics, especially in hypothesis testing and confidence interval calculations.
Physics - In physics, it arises in the study of diffusion equations, quantum mechanics, and heat conduction problems.
Engineering - Applications exist in engineering disciplines such as signal processing, control theory, and telecommunications.
Error Analysis - It's employed in error analysis and uncertainty quantification.
Numeric Approximations - Due to its lack of a closed-form expression, numerical methods are often employed to approximate erf/erfi().
AI, LLMs, & MACHINE LEARNING:
The error function (ERF) is indispensable to various AI applications, particularly due to its relation to Gaussian distributions and error analysis. It is used in Gaussian processes for regression and classification, probabilistic inference for Bayesian networks, soft margin computation in SVMs, neural networks involving Gaussian activation functions or noise, and clustering algorithms like Gaussian Mixture Models. Improved ERF approximations can enhance precision in these applications, reduce computational complexity, handle outliers and noise better, and improve optimization and convergence, possibly leading to more accurate, efficient, and robust AI systems.
BONUS ALGORITHMS:
While ERFs are versatile, its opposite also exists in the form of inverse error functions (ERFIs). I have also included a modified form of the inverse fisher transform along side MY sigmoid (sigmyod). I am uncertain what sigmyod() may be used for, but it's a culmination of my examinations deep into "sigmoid domains", something I am fascinated by. Whatever implications it may possess, I am unveiling it along with it's cousin functions. For curious minds, this quality of composition seen here is ideally what underlies what I would term "Pandora functionality" that empowers my Pandora indication. I go through hordes of formulations, testing, and inspection to find what appears to be the most beneficial logical/mathematical equation to apply...
SCRIPT OPERATION:
To showcase the characteristics and performance of my ERF/ERFI formulations, I devised a multi-modal script. By using bar_index , I generated a broad sequence of numeric values to input into the first ERF/ERFI parameter. These sequences allow you to inspect the contours of the error function's outputs for both ERF and ERFI. When combined with compute-intensive precision functions (CIPFs), the polynomial function output values can be subtracted from my CIPFs to obtain results of absolute error, displaying the accuracy of the many polynomial estimation functions I tuned in testing for Pine's float environment.
A host of numeric input settings are wildly adjustable to inspect values/curvatures across the range of numeric input sequences. Very large numbers, such as Divisor:100,000,100/Offset:200,000,000 for ERF modes or... Divisor:100,000,100/Offset:100,000,000 for ERFI modes, will display miniscule output values calculated from input values in close proximity to 0.0 for the various estimates, similar to a microscope. ERFI approximations very near in proximity to +/-1.0 will always yield large deviations of absolute error. Dragging/zooming your chart or using the Offset input will aid with visually clipping off those ERFI extremes where float precision functions cannot suffice.
NOTICE:
perf() and perfi() are intended for precision computation (as good as it basically gets) in a float environment. However, they are CPU intensive (especially perfi). I wouldn't recommend these being used in ANY Pine script unless it's an "absolute necessity" to do so to accomplish your goal. I only built them to obtain "absolute error curvatures" of the error functions for the polynomial approximations. These are visible in the accuracy modes in the indicator Settings.
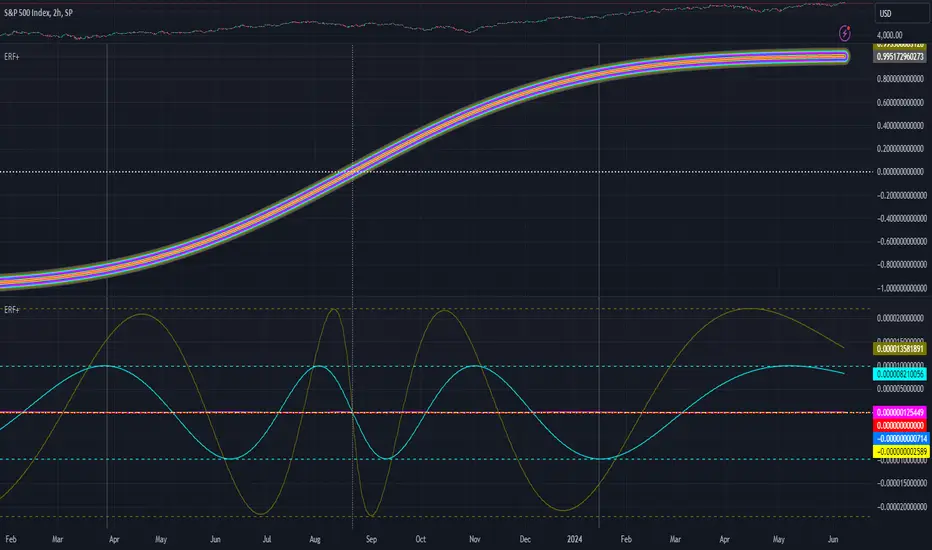
ATE_Common_Functions_LibraryLibrary "ATE_Common_Functions_Library"
- ATE_Common_Functions_Library was created to assist in constructing CCOMET Scanners
RCI(_rciLength, _source, _interval)
You will see me using this a lot. DEFINITELY my favorite oscillator to utilize for SO many different things from
timing entries/exits to determining trends.Calculation of this indicator based on Spearmans Correlation.
Parameters:
_rciLength (int) : (int)
Amount of bars back to use in RCI calculations.
_source (float) : (float)
Source to use in RCI calculations (can use ANY source series. Ie, open,close,high,low,etc).
_interval (int) : (int)
Optional (if parameter not included, it defaults to 3). RCI calculation groups bars by this amount and then will.
rank these groups of bars.
Returns: (float)
Returns a single RCI value that will oscillates between -100 and +100.
RCIAVG(_rciSMAlen, _source, _interval, firstLength, lastLength)
20 RCI's are averaged together to get this RCI Avg (Rank Correlation Index Average). Each RCI (of the 20 total RCI)
has a progressively LARGER Lookback Length. Rather than having ALL of the RCI Lengths be individually adjustable (because of too many inputs),
I have made the FIRST Length used (smallest Length value in the set) and the LAST Length used (largest length value in the set) be adjustable
and all other 18 Lengths are equally spread out between the 'firstLength' and the 'lastLength'.
Parameters:
_rciSMAlen (int) : (int)
Unlike the Single RCI Function, this function smooths out the end result using an SMA with a length value that is this parameter.
_source (float) : (float)
Source to use in RCI calculations (can use ANY source series. Ie, open,close,high,low,etc).
_interval (int) : (int)
Optional (if parameter not included, it defaults to 3). Within the RCI calculation, bars next to each other are grouped together
and then these groups are Ranked against each other. This parameter is the number of adjacent bars that are grouped together.
firstLength (int) : (int)
Optional (if parameter is not included when the function is called on in the script, then it defaults to 200).
This parameter is the Lookback Length for the 1st RCI used (so the SMALLEST Length used) in the RCI Avg.
lastLength (int) : (int)
Optional (if parameter is not included when the function is called on in the script, then it defaults to 2500).
This parameter is the Lookback Length for the 20th(the LAST) RCI used (so the LARGEST Length used) in the RCI Avg.
***** BEWARE ***** The 'lastLength' must be less than (or possibly equal to) 5000 because Tradingview has capped it at 5000, causing an error.
***** BEWARE ***** If the script gives a compiler "time out" error then the 'lastLength' must be lowered until it no longer times out when compiling.
Returns: (float)
Returns a single RCI value that is the Avg of many RCI values that will oscillate between -100 and +100.
PercentChange(_startingValue, _endingValue)
This is a quick function to calculate how much % change has occurred between the '_startingValue' and the '_endingValue'
that you input into the function.
Parameters:
_startingValue (float) : (float)
The source value to START the % change calculation from.
_endingValue (float) : (float)
The source value to END the % change caluclation from.
Returns: Returns a single output being the % value between 0-100 (with trailing numbers behind a decimal). If you want only
a certain amount of numbers behind the decimal, this function needs to be put within a formatting function to do so.
Rescale(_source, _oldMin, _oldMax, _newMin, _newMax)
Rescales series with a known '_oldMin' & '_oldMax'. Use this when the scale of the '_source' to
rescale is known (bounded).
Parameters:
_source (float) : (float)
Source to be normalized.
_oldMin (int) : (float)
The known minimum of the '_source'.
_oldMax (int) : (float)
The known maximum of the '_source'.
_newMin (int) : (float)
What you want the NEW minimum of the '_source' to be.
_newMax (int) : (float)
What you want the NEW maximum of the '_source' to be.
Returns: Outputs your previously bounded '_source', but now the value will only move between the '_newMin' and '_newMax'
values you set in the variables.
Normalize_Historical(_source, _minimumLvl, _maximumLvl)
Normalizes '_source' that has a previously unknown min/max(unbounded) determining the max & min of the '_source'
FROM THE ENTIRE CHARTS HISTORY. ]
Parameters:
_source (float) : (float)
Source to be normalized.
_minimumLvl (int) : (float)
The Lower Boundary Level.
_maximumLvl (int) : (float)
The Upper Boundary Level.
Returns: Returns your same '_source', but now the value will MOSTLY stay between the minimum and maximum values you set in the
'_minimumLvl' and '_maximumLvl' variables (ie. if the source you input is an RSI...the output is the same RSI value but
instead of moving between 0-100 it will move between the maxand min you set).
Normailize_Local(_source, _length, _minimumLvl, _maximumLvl)
Normalizes series with previously unknown min/max(unbounded). Much like the Normalize_Historical function above this one,
but rather than using the Highest/Lowest Values within the ENTIRE charts history, this on looks for the Highest/Lowest
values of '_source' within the last ___ bars (set by user as/in the '_length' parameter. ]
Parameters:
_source (float) : (float)
Source to be normalized.
_length (int) : (float)
The amount of bars to look back to determine the highest/lowest '_source' value.
_minimumLvl (int) : (float)
The Lower Boundary Level.
_maximumLvl (int) : (float)
The Upper Boundary Level.
Returns: Returns a single output variable being the previously unbounded '_source' that is now normalized and bound between
the values used for '_minimumLvl'/'_maximumLvl' of the '_source' within the user defined lookback period.
Donchian Quest Research// =================================
Trend following strategy.
// =================================
Strategy uses two channels. One channel - for opening trades. Second channel - for closing.
Channel is similar to Donchian channel, but uses Close prices (not High/Low). That helps don't react to wicks of volatile candles (“stop hunting”). In most cases openings occur earlier than in Donchian channel. Closings occur only for real breakout.
// =================================
Strategy waits for beginning of trend - when price breakout of channel. Default length of both channels = 50 candles.
Conditions of trading:
- Open Long: If last Close = max Close for 50 closes.
- Close Long: If last Close = min Close for 50 closes.
- Open Short: If last Close = min Close for 50 closes.
- Close Short: If last Close = max Close for 50 closes.
// =================================
Color of lines:
- black - channel for opening trade.
- red - channel for closing trade.
- yellow - entry price.
- fuchsia - stoploss and breakeven.
- vertical green - go Long.
- vertical red - go Short.
- vertical gray - close in end, don't trade anymore.
// =================================
Order size calculated with ATR and volatility.
You can't trade 1 contract in BTC and 1 contract in XRP - for example. They have different price and volatility, so 1 contract BTC not equal 1 contract XRP.
Script uses universal calculation for every market. It is based on:
- Risk - USD sum you ready to loss in one trade. It calculated as percent of Equity.
- ATR indicator - measurement of volatility.
With default setting your stoploss = 0.5 percent of equity:
- If initial capital is 1000 USD and used parameter "Permit stop" - loss will be 5 USD (0.5 % of equity).
- If your Equity rises to 2000 USD and used parameter "Permit stop"- loss will be 10 USD (0.5 % of Equity).
// =================================
This Risk works only if you enable “Permit stop” parameter in Settings.
If this parameter disabled - strategy works as reversal strategy:
⁃ If close Long - channel border works as stoploss and momentarily go Short.
⁃ If close Short - channel border works as stoploss and momentarily go Long.
Channel borders changed dynamically. So sometime your loss will be greater than ‘Risk %’. Sometime - less than ‘Risk %’.
If this parameter enabled - maximum loss always equal to 'Risk %'. This parameter also include breakeven: if profit % = Risk %, then move stoploss to entry price.
// =================================
Like all trend following strategies - it works only in trend conditions. If no trend - slowly bleeding. There is no special additional indicator to filter trend/notrend. You need to trade every signal of strategy.
Strategy gives many losses:
⁃ 30 % of trades will close with profit.
⁃ 70 % of trades will close with loss.
⁃ But profit from 30% will be much greater than loss from 70 %.
Your task - patiently wait for it and don't use risky setting for position sizing.
// =================================
Recommended timeframe - Daily.
// =================================
Trend can vary in lengths. Selecting length of channels determine which trend you will be hunting:
⁃ 20/10 - from several days to several weeks.
⁃ 20/20 or 50/20 - from several weeks to several months.
⁃ 50/50 or 100/50 or 100/100 - from several months to several years.
// =================================
Inputs (Settings):
- Length: length of channel for trade opening/closing. You can choose 20/10, 20/20, 50/20, 50/50, 100/50, 100/100. Default value: 50/50.
- Permit Long / Permit short: Longs are most profitable for this strategy. You can disable Shorts and enable Longs only. Default value: permit all directions.
- Risk % of Equity: for position sizing used Equity percent. Don't use values greater than 5 % - it's risky. Default value: 0.5%.
⁃ ATR multiplier: this multiplier moves stoploss up or down. Big multiplier = small size of order, small profit, stoploss far from entry, low chance of stoploss. Small multiplier = big size of order, big profit, stop near entry, high chance of stoploss. Default value: 2.
- ATR length: number of candles to calculate ATR indicator. It used for order size and stoploss. Default value: 20.
- Close in end - to close active trade in the end (and don't trade anymore) or leave it open. You can see difference in Strategy Tester. Default value: don’t close.
- Permit stop: use stop or go reversal. Default value: without stop, reversal strategy.
// =================================
Properties (Settings):
- Initial capital - 1000 USD.
- Script don't uses 'Order size' - you need to change 'Risk %' in Inputs instead.
- Script don't uses 'Pyramiding'.
- 'Commission' 0.055 % and 'Slippage' 0 - this parameters are for crypto exchanges with perpetual contracts (for example Bybit). If use on other markets - set it accordingly to your exchange parameters.
// =================================
Big dataset used for chart - 'BITCOIN ALL TIME HISTORY INDEX'. It gives enough trades to understand logic of script. It have several good trends.
// =================================
