CVD - Cumulative Volume Delta (Chart)█ OVERVIEW
This indicator displays cumulative volume delta (CVD) as an on-chart oscillator. It uses intrabar analysis to obtain more precise volume delta information compared to methods that only use the chart's timeframe.
The core concepts in this script come from our first CVD indicator , which displays CVD values as plot candles in a separate indicator pane. In this script, CVD values are scaled according to price ranges and represented on the main chart pane.
█ CONCEPTS
Bar polarity
Bar polarity refers to the position of the close price relative to the open price. In other words, bar polarity is the direction of price change.
Intrabars
Intrabars are chart bars at a lower timeframe than the chart's. Each 1H chart bar of a 24x7 market will, for example, usually contain 60 bars at the lower timeframe of 1min, provided there was market activity during each minute of the hour. Mining information from intrabars can be useful in that it offers traders visibility on the activity inside a chart bar.
Lower timeframes (LTFs)
A lower timeframe is a timeframe that is smaller than the chart's timeframe. This script utilizes a LTF to analyze intrabars, or price changes within a chart bar. The lower the LTF, the more intrabars are analyzed, but the less chart bars can display information due to the limited number of intrabars that can be analyzed.
Volume delta
Volume delta is a measure that separates volume into "up" and "down" parts, then takes the difference to estimate the net demand for the asset. This approach gives traders a more detailed insight when analyzing volume and market sentiment. There are several methods for determining whether an asset's volume belongs in the "up" or "down" category. Some indicators, such as On Balance Volume and the Klinger Oscillator , use the change in price between bars to assign volume values to the appropriate category. Others, such as Chaikin Money Flow , make assumptions based on open, high, low, and close prices. The most accurate method involves using tick data to determine whether each transaction occurred at the bid or ask price and assigning the volume value to the appropriate category accordingly. However, this method requires a large amount of data on historical bars, which can limit the historical depth of charts and the number of symbols for which tick data is available.
In the context where historical tick data is not yet available on TradingView, intrabar analysis is the most precise technique to calculate volume delta on historical bars on our charts. This indicator uses intrabar analysis to achieve a compromise between simplicity and accuracy in calculating volume delta on historical bars. Our Volume Profile indicators use it as well. Other volume delta indicators in our Community Scripts , such as the Realtime 5D Profile , use real-time chart updates to achieve more precise volume delta calculations. However, these indicators aren't suitable for analyzing historical bars since they only work for real-time analysis.
This is the logic we use to assign intrabar volume to the "up" or "down" category:
• If the intrabar's open and close values are different, their relative position is used.
• If the intrabar's open and close values are the same, the difference between the intrabar's close and the previous intrabar's close is used.
• As a last resort, when there is no movement during an intrabar and it closes at the same price as the previous intrabar, the last known polarity is used.
Once all intrabars comprising a chart bar are analyzed, we calculate the net difference between "up" and "down" intrabar volume to produce the volume delta for the chart bar.
█ FEATURES
CVD resets
The "cumulative" part of the indicator's name stems from the fact that calculations accumulate during a period of time. By periodically resetting the volume delta accumulation, we can analyze the progression of volume delta across manageable chunks, which is often more useful than looking at volume delta accumulated from the beginning of a chart's history.
You can configure the reset period using the "CVD Resets" input, which offers the following selections:
• None : Calculations do not reset.
• On a fixed higher timeframe : Calculations reset on the higher timeframe you select in the "Fixed higher timeframe" field.
• At a fixed time that you specify.
• At the beginning of the regular session .
• On trend changes : Calculations reset on the direction change of either the Aroon indicator, Parabolic SAR , or Supertrend .
• On a stepped higher timeframe : Calculations reset on a higher timeframe automatically stepped using the chart's timeframe and following these rules:
Chart TF HTF
< 1min 1H
< 3H 1D
<= 12H 1W
< 1W 1M
>= 1W 1Y
Specifying intrabar precision
Ten options are included in the script to control the number of intrabars used per chart bar for calculations. The greater the number of intrabars per chart bar, the fewer chart bars can be analyzed.
The first five options allow users to specify the approximate amount of chart bars to be covered:
• Least Precise (Most chart bars) : Covers all chart bars by dividing the current timeframe by four.
This ensures the highest level of intrabar precision while achieving complete coverage for the dataset.
• Less Precise (Some chart bars) & More Precise (Less chart bars) : These options calculate a stepped LTF in relation to the current chart's timeframe.
• Very precise (2min intrabars) : Uses the second highest quantity of intrabars possible with the 2min LTF.
• Most precise (1min intrabars) : Uses the maximum quantity of intrabars possible with the 1min LTF.
The stepped lower timeframe for "Less Precise" and "More Precise" options is calculated from the current chart's timeframe as follows:
Chart Timeframe Lower Timeframe
Less Precise More Precise
< 1hr 1min 1min
< 1D 15min 1min
< 1W 2hr 30min
> 1W 1D 60min
The last five options allow users to specify an approximate fixed number of intrabars to analyze per chart bar. The available choices are 12, 24, 50, 100, and 250. The script will calculate the LTF which most closely approximates the specified number of intrabars per chart bar. Keep in mind that due to factors such as the length of a ticker's sessions and rounding of the LTF, it is not always possible to produce the exact number specified. However, the script will do its best to get as close to the value as possible.
As there is a limit to the number of intrabars that can be analyzed by a script, a tradeoff occurs between the number of intrabars analyzed per chart bar and the chart bars for which calculations are possible.
Display
This script displays raw or cumulative volume delta values on the chart as either line or histogram oscillator zones scaled according to the price chart, allowing traders to visualize volume activity on each bar or cumulatively over time. The indicator's background shows where CVD resets occur, demarcating the beginning of new zones. The vertical axis of each oscillator zone is scaled relative to the one with the highest price range, and the oscillator values are scaled relative to the highest volume delta. A vertical offset is applied to each oscillator zone so that the highest oscillator value aligns with the lowest price. This method ensures an accurate, intuitive visual comparison of volume activity within zones, as the scale is consistent across the chart, and oscillator values sit below prices. The vertical scale of oscillator zones can be adjusted using the "Zone Height" input in the script settings.
This script displays labels at the highest and lowest oscillator values in each zone, which can be enabled using the "Hi/Lo Labels" input in the "Visuals" section of the script settings. Additionally, the oscillator's value on a chart bar is displayed as a tooltip when a user hovers over the bar, which can be enabled using the "Value Tooltips" input.
Divergences occur when the polarity of volume delta does not match that of the chart bar. The script displays divergences as bar colors and background colors that can be enabled using the "Color bars on divergences" and "Color background on divergences" inputs.
An information box in the lower-left corner of the indicator displays the HTF used for resets, the LTF used for intrabars, the average quantity of intrabars per chart bar, and the number of chart bars for which there is LTF data. This is enabled using the "Show information box" input in the "Visuals" section of the script settings.
FOR Pine Script™ CODERS
• This script utilizes `ltf()` and `ltfStats()` from the lower_tf library.
The `ltf()` function determines the appropriate lower timeframe from the selected calculation mode and chart timeframe, and returns it in a format that can be used with request.security_lower_tf() .
The `ltfStats()` function, on the other hand, is used to compute and display statistical information about the lower timeframe in an information box.
• The script utilizes display.data_window and display.status_line to restrict the display of certain plots.
These new built-ins allow coders to fine-tune where a script’s plot values are displayed.
• The newly added session.isfirstbar_regular built-in allows for resetting the CVD segments at the start of the regular session.
• The VisibleChart library developed by our resident PineCoders team leverages the chart.left_visible_bar_time and chart.right_visible_bar_time variables to optimize the performance of this script.
These variables identify the opening time of the leftmost and rightmost visible bars on the chart, allowing the script to recalculate and draw objects only within the range of visible bars as the user scrolls.
This functionality also enables the scaling of the oscillator zones.
These variables are just a couple of the many new built-ins available in the chart.* namespace.
For more information, check out this blog post or look them up by typing "chart." in the Pine Script™ Reference Manual .
• Our ta library has undergone significant updates recently, including the incorporation of the `aroon()` indicator used as a method for resetting CVD segments within this script.
Revisit the library to see more of the newly added content!
Look first. Then leap.
Wyszukaj w skryptach "跨境通12月4日地天板"

TechnicalRating█ OVERVIEW
This library is a Pine Script™ programmer’s tool for incorporating TradingView's well-known technical ratings within their scripts. The ratings produced by this library are the same as those from the speedometers in the technical analysis summary and the "Rating" indicator in the Screener , which use the aggregate biases of 26 technical indicators to calculate their results.
█ CONCEPTS
Ensemble analysis
Ensemble analysis uses multiple weaker models to produce a potentially stronger one. A common form of ensemble analysis in technical analysis is the usage of aggregate indicators together in hopes of gaining further market insight and reinforcing trading decisions.
Technical ratings
Technical ratings provide a simplified way to analyze financial markets by combining signals from an ensemble of indicators into a singular value, allowing traders to assess market sentiment more quickly and conveniently than analyzing each constituent separately. By consolidating the signals from multiple indicators into a single rating, traders can more intuitively and easily interpret the "technical health" of the market.
Calculating the rating value
Using a variety of built-in TA functions and functions from our ta library, this script calculates technical ratings for moving averages, oscillators, and their overall result within the `calcRatingAll()` function.
The function uses the script's `calcRatingMA()` function to calculate the moving average technical rating from an ensemble of 15 moving averages and filters:
• Six Simple Moving Averages and six Exponential Moving Averages with periods of 10, 20, 30, 50, 100, and 200
• A Hull Moving Average with a period of 9
• A Volume-Weighted Moving Average with a period of 20
• An Ichimoku Cloud with a conversion line length of 9, base length of 26, and leading span B length of 52
The function uses the script's `calcRating()` function to calculate the oscillator technical rating from an ensemble of 11 oscillators:
• RSI with a period of 14
• Stochastic with a %K period of 14, a smoothing period of 3, and a %D period of 3
• CCI with a period of 20
• ADX with a DI length of 14 and an ADX smoothing period of 14
• Awesome Oscillator
• Momentum with a period of 10
• MACD with fast, slow, and signal periods of 12, 26, and 9
• Stochastic RSI with an RSI period of 14, a %K period of 14, a smoothing period of 3, and a %D period of 3
• Williams %R with a period of 14
• Bull Bear Power with a period of 50
• Ultimate Oscillator with fast, middle, and slow lengths of 7, 14, and 28
Each indicator is assigned a value of +1, 0, or -1, representing a bullish, neutral, or bearish rating. The moving average rating is the mean of all ratings that use the `calcRatingMA()` function, and the oscillator rating is the mean of all ratings that use the `calcRating()` function. The overall rating is the mean of the moving average and oscillator ratings, which ranges between +1 and -1. This overall rating, along with the separate MA and oscillator ratings, can be used to gain insight into the technical strength of the market. For a more detailed breakdown of the signals and conditions used to calculate the indicators' ratings, consult our Help Center explanation.
Determining rating status
The `ratingStatus()` function produces a string representing the status of a series of ratings. The `strongBound` and `weakBound` parameters, with respective default values of 0.5 and 0.1, define the bounds for "strong" and "weak" ratings.
The rating status is determined as follows:
Rating Value Rating Status
< -strongBound Strong Sell
< -weakBound Sell
-weakBound to weakBound Neutral
> weakBound Buy
> strongBound Strong Buy
By customizing the `strongBound` and `weakBound` values, traders can tailor the `ratingStatus()` function to fit their trading style or strategy, leading to a more personalized approach to evaluating ratings.
Look first. Then leap.
█ FUNCTIONS
This library contains the following functions:
calcRatingAll()
Calculates 3 ratings (ratings total, MA ratings, indicator ratings) using the aggregate biases of 26 different technical indicators.
Returns: A 3-element tuple: ( [(float) ratingTotal, (float) ratingOther, (float) ratingMA ].
countRising(plot)
Calculates the number of times the values in the given series increase in value up to a maximum count of 5.
Parameters:
plot : (series float) The series of values to check for rising values.
Returns: (int) The number of times the values in the series increased in value.
ratingStatus(ratingValue, strongBound, weakBound)
Determines the rating status of a given series based on its values and defined bounds.
Parameters:
ratingValue : (series float) The series of values to determine the rating status for.
strongBound : (series float) The upper bound for a "strong" rating.
weakBound : (series float) The upper bound for a "weak" rating.
Returns: (string) The rating status of the given series ("Strong Buy", "Buy", "Neutral", "Sell", or "Strong Sell").

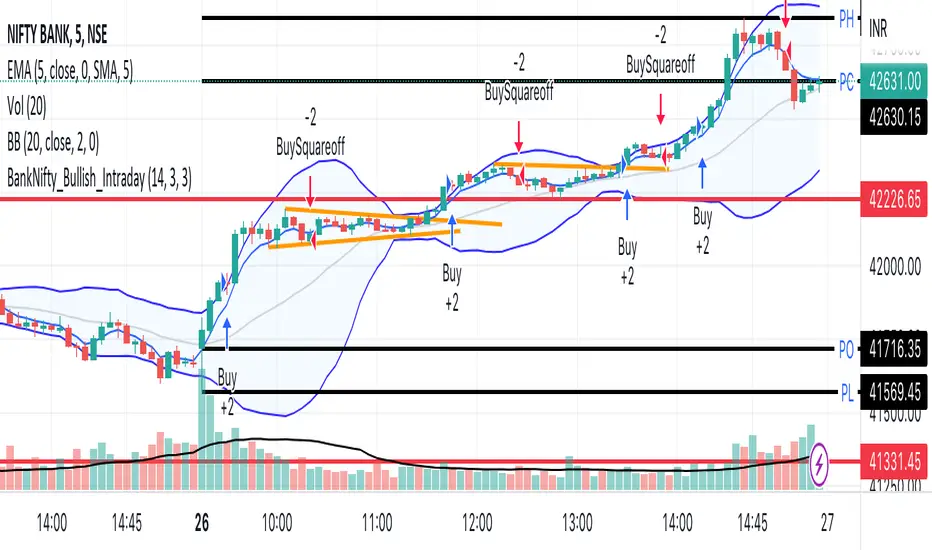
BankNifty_Bullish_Intraday
The script uses following mechanism to give a signal of BUY if multiple parameters evaluated are all passed.
ENTRY-
1. 5 min MACD should be more than its previous tick
2. 15 min MACD should be more than its previous tick
3. 60 min MACD should be more than its previous tick
4. ADX should be more than 12
5. RSI should be more than 60
6. Stochastic %k should have cross over with %d
7. Bollinger band upper band value should be more than previous tick
EXIT
If the 5 min bar price closes below 5 min EMA , it gives an exit signal.
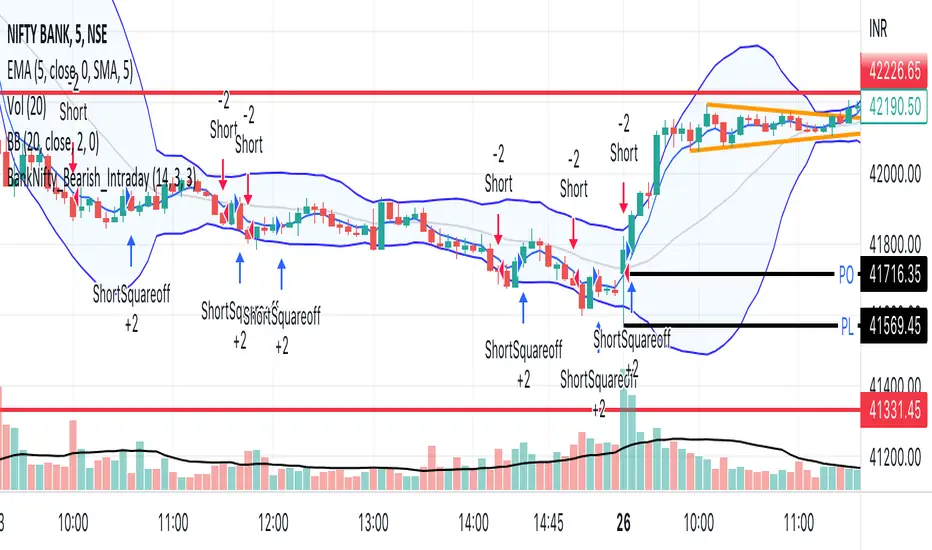
BankNifty_Bearish_Intraday
The script uses following mechanism to give a signal of SELL if multiple parameters evaluated are all passed.
ENTRY-
1. 5 min MACD should be less than its previous tick
2. 15 min MACD should be less than its previous tick
3. 60 min MACD should be less than its previous tick
4. ADX should be more than 12
5. RSI should be less than 40
6. Stochastic %k should have negative cross over with %d
7. Bollinger band lower band value should be less than previous tick
EXIT
If the 5 min bar price closes above 5 min EMA , it gives an exit signal.
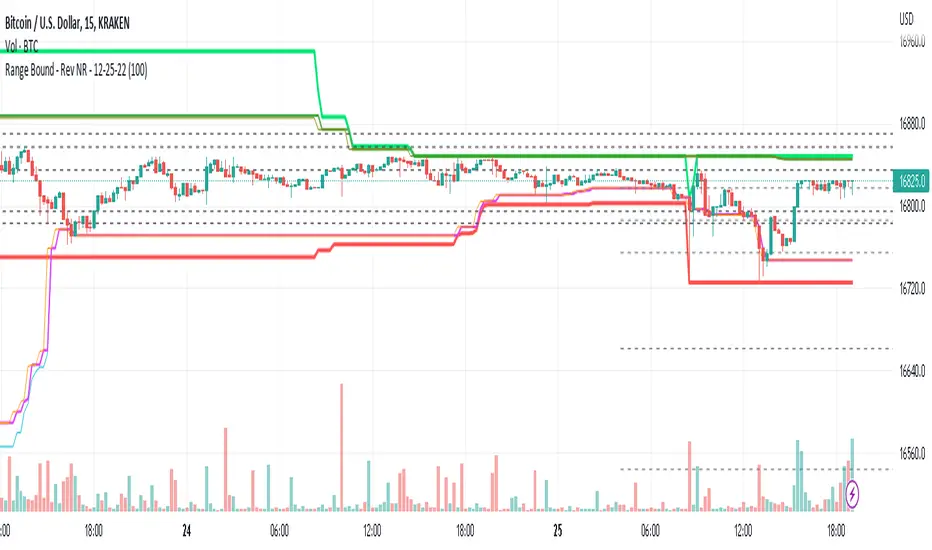
Range Bound - Rev NR - 12-25-22RangeBound - Code tracks price action within a user specified range (lookback), and tracks/charts overall high/lows, open high/lows, and close high/lows. Code resets certain parameters based on break of range to assist with determine price action - Can be useful to determine resistances to movement regardless of S&R levels. Code also uses the previous 5X Close High/Lows ranges as will chart as support and resistance to assist with determine resistance to price action
Note if using "redraw" shorter lookback periods will take additional time to compile due to multiple "redraws/deletes of previous lines" Uncheck redraw to reduce compile time
//The first code I have decided to publish :)
Musashi_Fractal_Dimension === Musashi-Fractal-Dimension ===
This tool is part of my research on the fractal nature of the markets and understanding the relation between fractal dimension and chaos theory.
To take full advantage of this indicator, you need to incorporate some principles and concepts:
- Traditional Technical Analysis is linear and Euclidean, which makes very difficult its modeling.
- Linear techniques cannot quantify non-linear behavior
- Is it possible to measure accurately a wave or the surface of a mountain with a simple ruler?
- Fractals quantify what Euclidean Geometry can’t, they measure chaos, as they identify order in apparent randomness.
- Remember: Chaos is order disguised as randomness.
- Chaos is the study of unstable aperiodic behavior in deterministic non-linear dynamic systems
- Order and randomness can coexist, allowing predictability.
- There is a reason why Fractal Dimension was invented, we had no way of measuring fractal-based structures.
- Benoit Mandelbrot used to explain it by asking: How do we measure the coast of Great Britain?
- An easy way of getting the need of a dimension in between is looking at the Koch snowflake.
- Market prices tend to seek natural levels of ranges of balance. These levels can be described as attractors and are determinant.
Fractal Dimension Index ('FDI')
Determines the persistence or anti-persistence of a market.
- A persistent market follows a market trend. An anti-persistent market results in substantial volatility around the trend (with a low r2), and is more vulnerable to price reversals
- An easy way to see this is to think that fractal dimension measures what is in between mainstream dimensions. These are:
- One dimension: a line
- Two dimensions: a square
- Three dimensions: a cube.
--> This will hint you that at certain moment, if the market has a Fractal Dimension of 1.25 (which is low), the market is behaving more “line-like”, while if the market has a high Fractal Dimension, it could be interpreted as “square-like”.
- 'FDI' is trend agnostic, which means that doesn't consider trend. This makes it super useful as gives you clean information about the market without trying to include trend stuff.
Question: If we have a game where you must choose between two options.
1. a horizontal line
2. a vertical line.
Each iteration a Horizontal Line or a Square will appear as continuation of a figure. If it that iteration shows a square and you bet vertical you win, same as if it is horizontal and it is a line.
- Wouldn’t be useful to know that Fractal dimension is 1.8? This will hint square. In the markets you can use 'FD' to filter mean-reversal signals like Bollinger bands, stochastics, Regular RSI divergences, etc.
- Wouldn’t be useful to know that Fractal dimension is 1.2? This will hint Line. In the markets you can use 'FD' to confirm trend following strategies like Moving averages, MACD, Hidden RSI divergences.
Calculation method:
Fractal dimension is obtained from the ‘hurst exponent’.
'FDI' = 2 - 'Hurst Exponent'
Musashi version of the Classic 'OG' Fractal Dimension Index ('FDI')
- By default, you get 3 fast 'FDI's (11,12,13) + 1 Slow 'FDI' (21), their interaction gives useful information.
- Fast 'FDI' cross will give you gray or red dots while Slow 'FDI' cross with the slowest of the fast 'FDI's will give white and orange dots. This are great to early spot trend beginnings or trend ends.
- A baseline (purple) is also provided, this is calculated using a 21 period Bollinger bands with 1.618 'SD', once calculated, you just take midpoint, this is the 'TDI's (Traders Dynamic Index) way. The indicator will print purple dots when Slow 'FDI' and baseline crosses, I see them as Short-Term cycle changes.
- Negative slope 'FDI' means trending asset.
- Positive most of the times hints correction, but if it got overextended it might hint a rocket-shot.
TDI Ranges:
- 'FDI' between 1.0≤ 'FDI' ≤1.4 will confirm trend following continuation signals.
- 'FDI' between 1.6≥ 'FDI' ≥2.0 will confirm reversal signals.
- 'FDI' == 1.5 hints a random unpredictable market.
Fractal Attractors
- As you must know, fractals tend orbit certain spots, this are named Attractors, this happens with any fractal behavior. The market of course also shows them, in form of Support & Resistance, Supply Demand, etc. It’s obvious they are there, but now we understand that they’re not linear, as the market is fractal, so simple trendline might not be the best tool to model this.
- I’ve noticed that when the Musashi version of the 'FDI' indicator start making a cluster of multicolor dots, this end up being an attractor, I tend to draw a rectangle as that area as price tend to come back (I still researching here).
Extra useful stuff
- Momentum / speed: Included by checking RSI Study in the indicator properties. This will add two RSI’s (9 and a 7 periods) plus a baseline calculated same way as explained for 'FDI'. This gives accurate short-term trends. It also includes RSI divergences (regular and hidden), deactivate with a simple check in the RSI section of the properties.
- BBWP (Bollinger Bands with Percentile): Efficient way of visualizing volatility as the percentile of Bollinger bands expansion. This line varies color from Iced blue when low volatility and magma red when high. By default, comes with the High vols deactivated for better view of 'FDI' and RSI while all studies are included. DDWP is trend agnostic, just like 'FDI', which make it very clean at providing information.
- Ultra Slow 'FDI': I noticed that while using BBWP and RSI, the indicator gets overcrowded, so there is the possibility of adding only one 'FDI' + its baseline.
Final Note: I’ve shown you few ways of using this indicator, please backtest before using in real trading. As you know trading is more about risk and trade management than the strategy used. This still a work in progress, I really hope you find value out of it. I use it combination with a tool named “Musashi_Katana” (also found in TradingView).
Best!
Musashi

M0PB (Momentum Pullback)Long/short strategy that identifies extreme readings on the rsi as a *momentum signal*, unlike most RSI strategies the script will look to buy or sell the first pullback in the direction of the extreme RSI reading.
Enters positions on the first pullback to the 5ema(low)/ 5ema(high) and exits at rolling 12 bar high/ low. The rolling high/ low feature means that if the price enters into a prolonged consolidation the profit target will begin to reduce with each new bar. The best trades tend to work within 2-6 bars.
Built for use on 5 min intervals on FX, Indexes, and Crypto. Lower than 5 minute time frames tend to be noisier and mean more commissions and a higher risk of slippage so the suggested timeframe is 5 mins.
Hard stop is X ATR (users can experiment with this) from the position entry price. This can be adjusted in user inputs.
There is a lot of slack left in entries and exits but the overall strategy is fairly robust across timeframes and markets and has between 60%-70% win rate with larger winners.
Signals that occur from economic news volatility are best avoided.

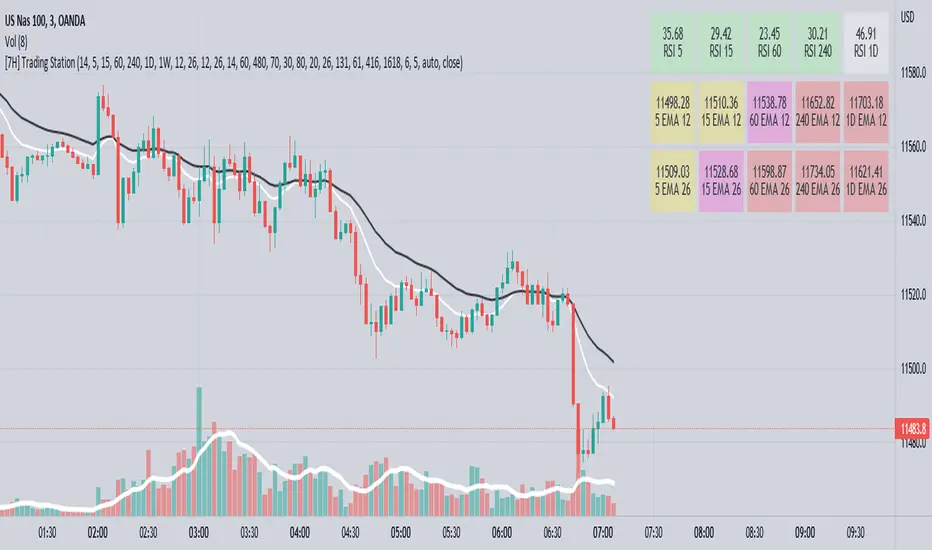
[7H] Trading HUD - MTF EMAs and RSIThis is a MTF HUD built around Chartguy Dan's trading style of 12/26 EMAs and RSI levels from multiple time frames. The HUD is configurable, allowing you to change the time frame of RSI levels and EMAs. The EMAs can be displayed at their current price or a percentage distance away. The HUD values will change color.
Fast EMA above Slow EMA with MACD (by Coinrule)An exponential moving average ( EMA ) is a type of moving average (MA) that places a greater weight and significance on the most recent data points. The exponential moving average is also referred to as the exponentially weighted moving average . An exponentially weighted moving average reacts more significantly to recent price changes than a simple moving average simple moving average ( SMA ), which applies an equal weight to all observations in the period.
Moving average convergence divergence ( MACD ) is a trend-following momentum indicator that shows the relationship between two moving averages of a security’s price. The MACD is calculated by subtracting the 26-period exponential moving average ( EMA ) from the 12-period EMA .
The result of that calculation is the MACD line. A nine-day EMA of the MACD called the "signal line," is then plotted on top of the MACD line, which can function as a trigger for buy and sell signals. Traders may buy the coin when the MACD crosses above its signal line and sell—or short—the security when the MACD crosses below the signal line. Moving average convergence divergence ( MACD ) indicators can be interpreted in several ways, but the more common methods are crossovers, divergences, and rapid rises/falls.
The Strategy enters and closes the trade when the following conditions are met:
LONG
The MACD histogram turns bullish
EMA8 is greater than EMA26
EXIT
Price increases 3% trailing
Price decreases 1% trailing
This strategy is back-tested from 1 January 2022 to simulate how the strategy would work in a bear market and provides good returns.
Pairs that produce very strong results include AXSUSDT on the 5-minute timeframe. This short timeframe means that this strategy opens and closes trades regularly.
Additionally, the trailing stop loss and take profit conditions can also be changed to match your needs.
The strategy assumes each order is using 30% of the available coins to make the results more realistic and to simulate you only ran this strategy on 30% of your holdings. A trading fee of 0.1% is also taken into account and is aligned to the base fee applied on Binance.

Ichimoku Cloud with MACD and Trailing Stop Loss (by Coinrule)The Ichimoku Cloud is a collection of technical indicators that show support and resistance levels, as well as momentum and trend direction. It does this by taking multiple averages and plotting them on a chart. It also uses these figures to compute a “cloud” that attempts to forecast where the price may find support or resistance in the future.
The Ichimoku Cloud was developed by Goichi Hosoda, a Japanese journalist, and published in the late 1960s. It provides more data points than the standard candlestick chart. While it seems complicated at first glance, those familiar with how to read the charts often find it easy to understand with well-defined trading signals.
The Ichimoku Cloud is composed of five lines or calculations, two of which comprise a cloud where the difference between the two lines is shaded in.
The lines include a nine-period average, a 26-period average, an average of those two averages, a 52-period average, and a lagging closing price line.
The cloud is a key part of the indicator. When the price is below the cloud, the trend is down. When the price is above the cloud, the trend is up.
The above trend signals are strengthened if the cloud is moving in the same direction as the price. For example, during an uptrend, the top of the cloud is moving up, or during a downtrend, the bottom of the cloud is moving down.
The MACD is a trend following momentum indicator and provides identification of short-term trend direction. In this variation it utilises the 12-period as the fast and 26-period as the slow length EMAs, with signal smoothing set at 9.
This strategy combines the Ichimoku Cloud with the MACD indicator to better enter trades.
Long/Exit orders are placed when three basic signals are triggered.
Long Position:
Tenkan-Sen is above the Kijun-Sen
Chikou-Span is above the close of 26 bars ago
Close is above the Kumo Cloud
MACD line crosses over the signal line
Exit Position:
Price increases 3% trailing
Price decreases 3% trailing
The script is backtested from 1 June 2022 and provides good returns.
The strategy assumes each order is using 30% of the available coins to make the results more realistic and to simulate you only ran this strategy on 30% of your holdings. A trading fee of 0.1% is also taken into account and is aligned to the base fee applied on Binance.

Rule Of 20 - Fair Value Estimation by Inflation & Earnings (TG)The Rule Of 20 is a heuristic calculation to find the fair value of an asset or market given its earnings and current inflation.
Its calculation is straightforward: the fair multiple of the price or price-to-earnings ratio of a stock should be 20 minus the rate of inflation.
In math terms: fair_price-to-earnings_ratio = (20 - inflation) ; fair_value = current_price * fair_price-to-earnings_ratio / real_price-to-earnings_ratio
For example, if a stock or index was trading on 11 times earnings and inflation was 2%, then the theory would be that the fair price-to-earnings ratio would be 20-2 = 18, which is much higher than the real price-to-earnings ratio of 11, and hence the asset would be undervalued.
Conversely, a market or company that was trading on 18 times price-to-earnings ration when inflation was 8% was seen as overvalued, because of the fair price-to-earnings ratio being 20-8=12, hence much lower than the real price-to-earnings ratio of 18.
We can then project the delta between the fair PE and real PE onto the asset's value to obtain the projected fair value, which may be a target of future value the asset may reach or hover around.
For example, as of 1st November 2022, SPX stood at 3871.97, with a PE ratio of 20.14 and an inflation in the US of 7.70. Using the Rule Of 20, we find that the fair PE ratio is 20-7.7=12.3, which is much lower than the current PE ratio of 20.14 by 39%! This may indicate a future possibility of a further downside risk by 39% from current valuation levels.
The origins of this rule are unknown, although the legendary US fund manager Peter Lynch is said to have been an active proponent when he was directing the Fidelity’s Magellan fund from 1977 to 1990.
For more infos about the Rule Of 20, reading this article is recommended: www.sharesmagazine.co.uk
This indicator implements the Rule Of 20 on any asset where the Financials are availble to TradingView, and also for the entire SP:SPX index as a way to assess the wider US stock market. Technically, the calculation is a bit different for the latter, as we cannot access earnings of SPX through Financials on TradingView, so we access it using the QUANDL:MULTPL/SP500_PE_RATIO_MONTH ticker instead.
By default are displayed:
current asset value in red
fair asset value according to the Rule Of 20 in white for SPX, or different shades of purple/maroon for other assets. Note that for SPX there is only one calculation, whereas for other assets there are multiple different ways to calculate earnings, so different fair values can be computed.
fair price-to-earnings ratio (PE ratio) in light grey.
real price-to-earnings ratio in darker grey.
This indicator can be used on SP:SPX ticker, and on most NASDAQ:* tickers, since they have Financials integrated in TradingView. Stocks tickers from other exchanges may not provide Financials data, so this indicator won't work then. If this happens, try to find the same ticker on NASDAQ instead.
Note that by default, only the US stock market is considered. If you want to consider stocks or assets in other regions of the world, please change the inflation ticker to a ticker that reflect the target region's inflation.
Also adding a table to ease interpretation was considered, but then the Timeframe MTF parameter would not work, and since the big advantage of this indicator is to allow for historical comparisons, the table was dropped.
Enjoy, and keep in mind that all models are wrong, but some are useful.
Trade safely!
TG

TheMas7er scalp (US equity) 5min [promuckaj]This indicator was created according to TheMas7er's trading setup, that he reveal after 18 years of working in the industry. Claims is that this setup should give you good probability to predict the price movement for US equity.
This trading setup is only for New York equity trading session from 09:30 until 4pm. The market in which you should use it are the S&P 500 , Dow Jones, and Nasdaq. Perhaps it will work on some other but for those are good according to tests. It should not used on days with high-impact news, like CPI , FOMC, NFP and so on. The model can still work there but the probability on these days is way lower.
What is the base of this indicator, it marks what is called "The Defining Range"("DR"). This defining range is from 09:30am until 10:30am New York local time, it takes those 12 candles in the 5min chart. Indicator will mark the high and low of this range, including wicks. This will help you to already know at 10:30am, with possible good probability the high or low of the day.
There is also the "Implied Defining Range"("iDR") lines inside the "DR" range, which mark the highest body and the lowest body in the "DR" range.
*The rules (it is very simple to follow):
Chart must be set in 5min timeframe.
At 10:30am you still don't know which one will be the real high or low of the day, but only one will be true.
If price is closing on 5min chart above the "DR" it should give you good probability that the low of the "DR" is the low of the day, and vice versa - if price is closing below the "DR" it should give you good probability that the high of the "DR" is the high of the day.
"iDR" gives you an early indication about what high or low of the day should be. If price is closing above "iDR" you will have an early indication that the low of the "DR" should be the low of the day, and vice versa.
Note that about closing means really closing above or below, not just wicks.
Now, after this you can realize the magnitude of possibility.
You can use any entry model you prefer to trade, it doesn't matter if you use ICT concepts, smart money concepts, volume profile , eliot waves, braking the structure concept or whatever. There are so many possibilities for trading within this rule.
Enjoy!

Index OverlayNote: use this indicator only with New York Timezone + you need to understand ICT concepts already, this indicator simplifies the chart work.
Also, in this script I added some open-source scripts from creators here on tradingview, but I forgot to annotate their names...
If you recognize your script, please text me and I'll add your credits.
features
- displays Midnight and Sunday open lines
- day separation (from midnight)
- FVGs
- VWAP (calculated from midnight open)
- daily labels
- TDH & TDL (liquidity)
- trading time window (from 9:30 to 12:00 ny time)
HOW TO USE
Combined with daily bias, the idea is to wait for 9:30 to open, and then wait for a liquidation of TDH (plotted in blue) or TDL (in red).
Once it happens, you can look for ICT buy / sell model, ideally in the 5m TF.

Economic Calendar (Import from Spreadsheet)This script draws vertical lines to mark Economic Calendar Events.
Datetime of events is defined by user in Settings via a standardized line of text.
Motivation for coding this script:
All traders should be aware of economic calendar events. At times, when you really need to pay attention to an upcoming major event, you might even decide to use the vertical-line drawing tool to mark it. However, this takes manual effort.
This script provides a solution to performing mundane tasks such as drawing vertical lines and dragging them ever so slightly, just to have them approximately aligned with exact time.
Parameters:
(1) Source data - String representation of collection of datetime referencing to Economic Calendar Events
(2) Line color, & (3) Width of line - For displaying vertical lines drawn by script.
Standardized format for Source Data :
Example:
If 'GMT;2022,6,1,14,0,0;2022,6,2,12,15,0;' is provided to PineScript, then two vertical lines will be drawn on June 6, 2022 according to the exact time in 'YYYY,MM,DD,hh,mm,ss' format at the specified timezone (GMT in this case).
Template for Source Data :
Included here, link below, is a shared Google Sheet that systematically processes Economic Calendar data provided in the 'Raw Data' tab.
drive.google.com
Users are advised to use their preferred methods* to format the string (for source data param.), and apply their own criteria to sort down the Events. (ie. only include Events of High Impact, etc.)
* Preferred methods (as mentioned above) does not mean being limited to using the template as provided in this post.

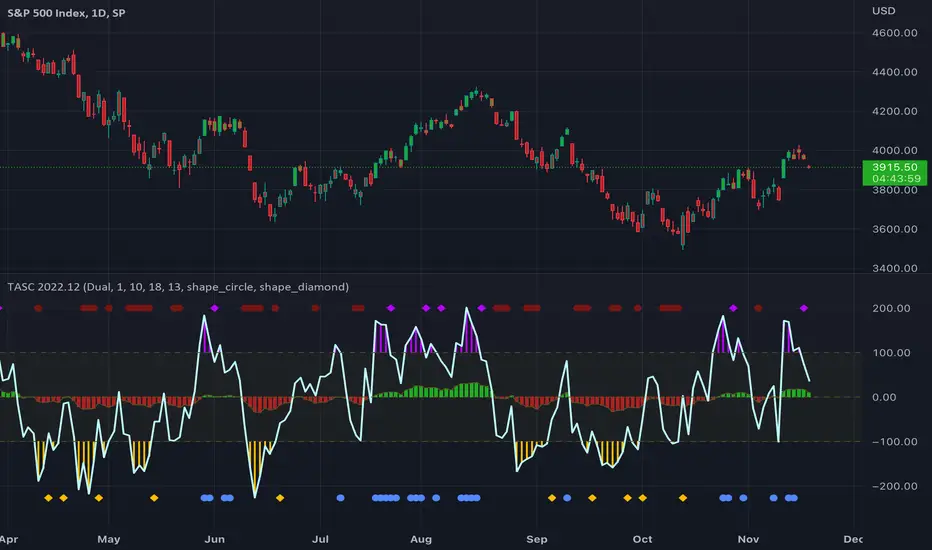
TASC 2022.12 Short-Term Continuation And Reversal Signals█ OVERVIEW
TASC's December 2022 edition Traders' Tips includes an article by Barbara Star titled "Short-Term Continuation And Reversal Signals". This is the code that implements the concepts presented in this publication.
█ CONCEPTS
The article takes two classic indicators, the Commodity Channel Index (CCI) and the Directional Movement Indicator (DMI), makes changes to the traditional ways of visualizing their readings, and uses them together to generate potential signals. The author first discusses the benefits of converting the DMI indicator to an oscillator format by subtracting the −DI from the +DI, which is then displayed as a histogram. Next, the author shows how the use of an on-chart visual framework (i.e., choosing the line style and color, coloring price bars, etc.) can help traders interpret the signals produced the considered pair of indicators.
█ CALCULATIONS
The article offers the following signals based on the readings of the DMI and CCI pair, suitable for several types of trades:
• Short-term trend change signals:
A DMI oscillator above zero indicates that prices are in an uptrend. A DMI oscillator below the zero line and falling means that selling pressure is dominating and price is trending down. The sign of the DMI oscillator is indicated by the color of the price bars (which correlates with the color of the DMI histogram). Namely, green, red and grey price bars correspond to the DMI oscillator above, below and equal to zero . Colored price bars and the DMI oscillator make it easy for trend traders to recognize changes in short-term trends.
• Trend continuation signals:
Blue circles appear near the bottom of the oscillator chart border when the DMI is above the zero line and the price is above its simple moving average in an uptrend . Dark red circles appear near the top of the chart in a downtrend when the DMI oscillator is below its zero line and below the 18-period moving average. Trend continuation signals are useful for those looking to add to existing positions, as well as for traders waiting for a pullback after a trend has started.
• Reversal signals:
The CCI signals a reversal to the downside when it breaks out of its +100 and then returns at some point, crossing below the +100 level. This is indicated by a magenta-colored diamond shape near the top the chart. The CCI signals a reversal to the upside when it moves below its −100 level and then at some point comes back to cross above the −100 level. This is indicated by a yellow diamond near the bottom of the chart. Reversal signals offer short-term rallies for countertrend traders as well as for swing traders looking for longer-term moves using the interplay between continuation and reversal signals.
Turtle Money ManagementThe Turtle Trading approach* is a trend following system that uses volatility for position size. *(Richard Dennis & William Eckhardt )
Turtle traders use the N unit system for risk management, which has its own advantages. This indicator offers beginners a simple interface that uses the same logic. Using ATR (Average True Range) to measure volatility.
The indicator shows the suggested position size and stop-loss price. You need to activate position line to see how it behaved in the past. Information about the Turtle system shows that it works in a daily candle. Intraday candles can be misleading (for ATR) because of this indicator use daily ATR by default. I leave the choice to you.
Limits recommended by Turtle Traders
-
Single Trade % 2 Maximum risk
Single Market % 4 Maximum risk
Closely Correlated Markets % 6 Maximum risk
Loosely Correlated Markets % 10 Maximum risk
Single Direction – Long or Short % 12 Maximum risk

Intrabar Efficiency Ratio█ OVERVIEW
This indicator displays a directional variant of Perry Kaufman's Efficiency Ratio, designed to gauge the "efficiency" of intrabar price movement by comparing the sum of movements of the lower timeframe bars composing a chart bar with the respective bar's movement on an average basis.
█ CONCEPTS
Efficiency Ratio (ER)
Efficiency Ratio was first introduced by Perry Kaufman in his 1995 book, titled "Smarter Trading". It is the ratio of absolute price change to the sum of absolute changes on each bar over a period. This tells us how strong the period's trend is relative to the underlying noise. Simply put, it's a measure of price movement efficiency. This ratio is the modulator utilized in Kaufman's Adaptive Moving Average (KAMA), which is essentially an Exponential Moving Average (EMA) that adapts its responsiveness to movement efficiency.
ER's output is bounded between 0 and 1. A value of 0 indicates that the starting price equals the ending price for the period, which suggests that price movement was maximally inefficient. A value of 1 indicates that price had travelled no more than the distance between the starting price and the ending price for the period, which suggests that price movement was maximally efficient. A value between 0 and 1 indicates that price had travelled a distance greater than the distance between the starting price and the ending price for the period. In other words, some degree of noise was present which resulted in reduced efficiency over the period.
As an example, let's say that the price of an asset had moved from $15 to $14 by the end of a period, but the sum of absolute changes for each bar of data was $4. ER would be calculated like so:
ER = abs(14 - 15)/4 = 0.25
This suggests that the trend was only 25% efficient over the period, as the total distanced travelled by price was four times what was required to achieve the change over the period.
Intrabars
Intrabars are chart bars at a lower timeframe than the chart's. Each 1H chart bar of a 24x7 market will, for example, usually contain 60 intrabars at the LTF of 1min, provided there was market activity during each minute of the hour. Mining information from intrabars can be useful in that it offers traders visibility on the activity inside a chart bar.
Lower timeframes (LTFs)
A lower timeframe is a timeframe that is smaller than the chart's timeframe. This script determines which LTF to use by examining the chart's timeframe. The LTF determines how many intrabars are examined for each chart bar; the lower the timeframe, the more intrabars are analyzed, but fewer chart bars can display indicator information because there is a limit to the total number of intrabars that can be analyzed.
Intrabar precision
The precision of calculations increases with the number of intrabars analyzed for each chart bar. As there is a 100K limit to the number of intrabars that can be analyzed by a script, a trade-off occurs between the number of intrabars analyzed per chart bar and the chart bars for which calculations are possible.
Intrabar Efficiency Ratio (IER)
Intrabar Efficiency Ratio applies the concept of ER on an intrabar level. Rather than comparing the overall change to the sum of bar changes for the current chart's timeframe over a period, IER compares single bar changes for the current chart's timeframe to the sum of absolute intrabar changes, then applies smoothing to the result. This gives an indication of how efficient changes are on the current chart's timeframe for each bar of data relative to LTF bar changes on an average basis. Unlike the standard ER calculation, we've opted to preserve directional information by not taking the absolute value of overall change, thus allowing it to be utilized as a momentum oscillator. However, by taking the absolute value of this oscillator, it could potentially serve as a replacement for ER in the design of adaptive moving averages.
Since this indicator preserves directional information, IER can be regarded as similar to the Chande Momentum Oscillator (CMO) , which was presented in 1994 by Tushar Chande in "The New Technical Trader". Both CMO and ER essentially measure the same relationship between trend and noise. CMO simply differs in scale, and considers the direction of overall changes.
█ FEATURES
Display
Three different display types are included within the script:
• Line : Displays the middle length MA of the IER as a line .
Color for this display can be customized via the "Line" portion of the "Visuals" section in the script settings.
• Candles : Displays the non-smooth IER and two moving averages of different lengths as candles .
The `open` and `close` of the candle are the longest and shortest length MAs of the IER respectively.
The `high` and `low` of the candle are the max and min of the IER, longest length MA of the IER, and shortest length MA of the IER respectively.
Colors for this display can be customized via the "Candles" portion of the "Visuals" section in the script settings.
• Circles : Displays three MAs of the IER as circles .
The color of each plot depends on the percent rank of the respective MA over the previous 100 bars.
Different colors are triggered when ranks are below 10%, between 10% and 50%, between 50% and 90%, and above 90%.
Colors for this display can be customized via the "Circles" portion of the "Visuals" section in the script settings.
With either display type, an optional information box can be displayed. This box shows the LTF that the script is using, the average number of lower timeframe bars per chart bar, and the number of chart bars that contain LTF data.
Specifying intrabar precision
Ten options are included in the script to control the number of intrabars used per chart bar for calculations. The greater the number of intrabars per chart bar, the fewer chart bars can be analyzed.
The first five options allow users to specify the approximate amount of chart bars to be covered:
• Least Precise (Most chart bars) : Covers all chart bars by dividing the current timeframe by four.
This ensures the highest level of intrabar precision while achieving complete coverage for the dataset.
• Less Precise (Some chart bars) & More Precise (Less chart bars) : These options calculate a stepped LTF in relation to the current chart's timeframe.
• Very precise (2min intrabars) : Uses the second highest quantity of intrabars possible with the 2min LTF.
• Most precise (1min intrabars) : Uses the maximum quantity of intrabars possible with the 1min LTF.
The stepped lower timeframe for "Less Precise" and "More Precise" options is calculated from the current chart's timeframe as follows:
Chart Timeframe Lower Timeframe
Less Precise More Precise
< 1hr 1min 1min
< 1D 15min 1min
< 1W 2hr 30min
> 1W 1D 60min
The last five options allow users to specify an approximate fixed number of intrabars to analyze per chart bar. The available choices are 12, 24, 50, 100, and 250. The script will calculate the LTF which most closely approximates the specified number of intrabars per chart bar. Keep in mind that due to factors such as the length of a ticker's sessions and rounding of the LTF, it is not always possible to produce the exact number specified. However, the script will do its best to get as close to the value as possible.
Specifying MA type
Seven MA types are included in the script for different averaging effects:
• Simple
• Exponential
• Wilder (RMA)
• Weighted
• Volume-Weighted
• Arnaud Legoux with `offset` and `sigma` set to 0.85 and 6 respectively.
• Hull
Weighting
This script includes the option to weight IER values based on the percent rank of absolute price changes on the current chart's timeframe over a specified period, which can be enabled by checking the "Weigh using relative close changes" option in the script settings. This places reduced emphasis on IER values from smaller changes, which may help to reduce noise in the output.
█ FOR Pine Script™ CODERS
• This script imports the recently published lower_ltf library for calculating intrabar statistics and the optimal lower timeframe in relation to the current chart's timeframe.
• This script uses the recently released request.security_lower_tf() Pine Script™ function discussed in this blog post .
It works differently from the usual request.security() in that it can only be used on LTFs, and it returns an array containing one value per intrabar.
This makes it much easier for programmers to access intrabar information.
• This script implements a new recommended best practice for tables which works faster and reduces memory consumption.
Using this new method, tables are declared only once with var , as usual. Then, on the first bar only, we use table.cell() to populate the table.
Finally, table.set_*() functions are used to update attributes of table cells on the last bar of the dataset.
This greatly reduces the resources required to render tables.
Look first. Then leap.

Portfolio Tracker For Stocks & CryptoThis is a portfolio tracker that will track individual, overall and daily profit/loss for up to 12 assets. You can set the size of your buys and price of your buys for accurate, up to date profit and loss data right on your chart. It works on all markets and timeframes.
HOW TO USE
Go into the indicator settings and you will see all of the available settings. The first is the ability to turn the tracker info table on or off from the chart, so it saves your portfolio info but let’s you remove it from the chart while trading. Second is the option to move the position of the info table to suit your preference.
Next we get into setting up your portfolio tickers, order size and price. Each ticker lets you set which stock/crypto you bought, then set how much you purchased and then what price you purchased them at.
Go through and set up all of your assets and then turn off any tickers that you don’t need. Once that is all done, your portfolio will be shown on the chart with all the data.
FEATURES
Top Section
The portfolio tracker has 2 sections. The top section shows each ticker in your portfolio individually with the following data:
- Ticker Name
- Weight of that asset compared to your total portfolio in %
- Current value of that position in $
- Profit or loss value from purchase price in %
- Todays change in value from yesterday’s close in %
The $ Value, PnL % and Today % will all change colors from green to red depending if they are in profit or not.
Bottom Section
The bottom section of the tracker will give you info for your portfolio as a whole. It has the following data:
- Total cost of your entire portfolio in $
- Current value of your entire portfolio in $
- Current profit or loss of your entire portfolio in $
- Current profit or loss of your entire portfolio in %
- Todays change of your entire portfolio value compared to yesterday’s close in %
The $ Value, PnL $, PnL % and Today % will all change colors from green to red depending if they are in profit or not.

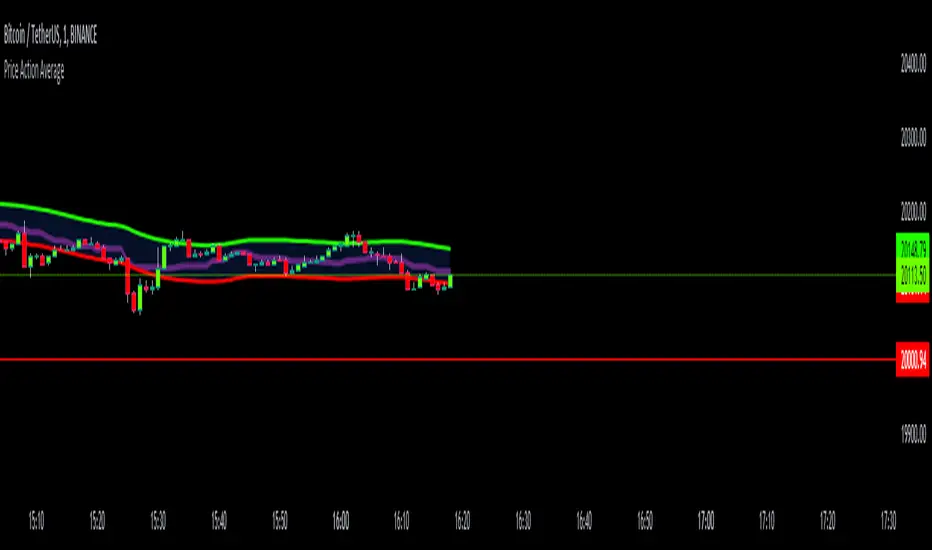
Price Action AverageThis indicator is perfect for scalping in 1 minute, it consists of a channel and a line that is made up of the average of the highs and lows of the price in 12 and 64 cycles.
The channel has as its center a 7 cycles SMA, when the average line (Called Signal, the purple one) crosses the upper band it is time to make a Long.
If it crosses the lower band it is time to make a short, if the line returns to the channel a signal appears to close the operation.
The indicator works with all timeframes, I use it on the 1 hour chart and I do the trades in 1 minute.
Public Sentiment Oscillator This is a combination of 9 common use indicators turned into on single oscillator. These indicators are: 200 day moving average cross, 9/12 ema cross, 13/48 sma cross, rsi, stochastic, mfi, cci, macd, and open close trend. I have weighted the scores to be pretty even so that its balances each indicator in the sum. Because of the odd number of indicators, I have decided to normalized the score to 10. I think this has the effect of making it easier to read.
The score definition: oc_trend > 0 ? 1 : 0, fast_e > slow_e ? 1 : 0, fast_s > slow_s ? 1 : 0, rsi < 30 ? 0 : rsi > 30 and rsi < 70 ? 0.5 : rsi > 70 ? 1 : 0, macd1 > macd2 ? 0.5 : macd1 < macd2 ? 0 : 0, (hist >=0 ? (hist < hist ? 0.5 : 0.25) : (hist < hist ? 0.25 : 0)), stoch < 20 ? 0 : stoch > 20 and stoch < 80 ? 0.5 : stoch > 80 ? 1 : 0, source > ma200 ? 1 : ex <= ma200 ? 0 : 0, mfi < 20 ? 0 : mfi > 20 and mfi < 80 ? 0.5 : mfi > 80 ? 1 : 0, cci < -100 ? 0 : cci > -100 and cci < 100 ? 0.5 : cci > 100 ? 1 : 0
I hope you find this useful in your trades. Enjoy!

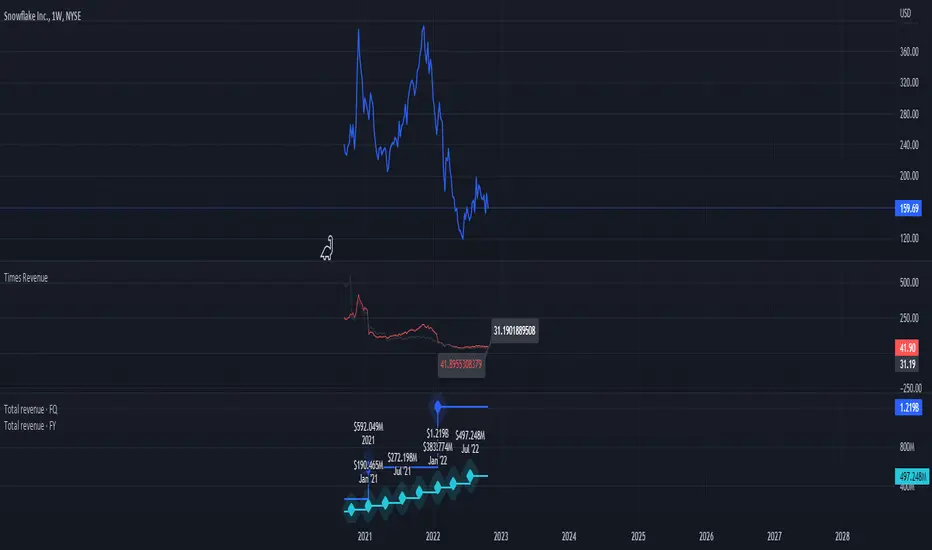
Times-Revenue (Fundamental Metric)Times-revenue is calculated by dividing the selling price of a company by the prior 12 months revenue of the company. The result indicates how many times of annual income a buyer was willing to pay for a company.
In color Red: it shows the last annual metric calculated
In color Gray: it shows the last 4 quarters annualized results
Yield Curve (1-10yr)Yield curve of the 1-10 year US Treasury Bonds, with over 60 years of history.
The Yield Curve is the interest rate on the 10 year bond minus the 1 year bond.
When it inverts (crosses under 0) a recession usually follows 6-12 months later.
It's a great leading indicator to identify risk in the macroeconomic environment.
Yield curves can be constructed on varying durations. Using a 1-year as the short-term bond provides a slightly faster response than the 2-year bond; and the 1-year has more historical data on TradingView.

Stochastic Vix Fix SVIX (Tartigradia)The Stochastic Vix or Stochastic VixFix (SVIX), just like the Williams VixFix, is a realized volatility indicator, and can help in finding market bottoms as well as tops without requiring bollinger bands or any other construct, as the SVIX is bounded between 0-100 which allows for an objective thresholding regardless of the past.
Mathematically, SVIX is the complement of the original Stochastic Oscillator, with such a simple transform reproducing Williams' VixFix and the VIX index signals of high volatility and hence of market bottoms quite accurately but within a bounded 0-100 range. Having a predefined range allows to find markets bottoms without needing to compare to past prices using a bollinger band (Chris Moody on TradingView) nor a moving average (Hesta 2015), as a simple threshold condition (by default above 80) is sufficient to reliably signal interesting entry points at bottoming prices.
Having a predefined range allows to find markets bottoms without needing to compare to past prices using a bollinger band (Chris Moody on TradingView) nor a moving average (Hesta 2015), as a simple threshold condition (by default above 80) is sufficient to reliably signal interesting entry points at bottoming prices.
Indeed, as Williams describes in his paper, markets tend to find the lowest prices during times of highest volatility, which usually accompany times of highest fear.
Although the VixFix originally only indicates market bottoms, the Stochastic VixFix can also indicate good times to exit, when SVIX is at a low value (default: below 20), but just like the original VixFix and VIX index, exit signals are as usual much less reliable than long entries signals, because: 1) mature markets such as SP500 tend to increase over the long term, 2) when market fall, retail traders panic and hence volatility skyrockets and bottom is more reliably signalled, but at market tops, no one is panicking, price action only loses momentum because of liquidity drying up.
Compared to Hesta 2015 strategy of using a moving average over Williams' VixFix to generate entry signals, SVIX generates much fewer false positives during ranging markets, which drastically reduce Hesta 2015 strategy profitability as this incurs quite a lot of losses.
This indicator goes further than the original SVIX, by restoring the smoothed D and second-level smoothed D2 oscillators from the original Stochastic Oscillator, and use a 14-period ZLMA instead of the original 20-period SMA, to generate smoother yet responsive signals compared to using just the raw SVIX (by default, this is disabled, as the original raw SVIX is used to produce more entry signals).
Usage:
Set the timescale to daily or weekly preferably, to reduce false positives.
When the background is highlighted in green or when the highlight disappears, it is usually a good time to enter a long position.
Red background highlighting can be enabled to signal good exit zones, but these generate a lot of false positives.
To further reduce false positives, the SVIX_MA can be used to generate signals instead of the raw SVIX.
For more information on Williams' Vix Fix, which is a strategy published under public domain:
The VIX Fix, Larry Williams, Active Trader magazine, December 2007, web.archive.org
Fixing the VIX: An Indicator to Beat Fear, Amber Hestla-Barnhart, Journal of Technical Analysis, March 13, 2015, ssrn.com
For more information on the Stochastic Vix Fix (SVIX), published under Creative Commons:
Replicating the CBOE VIX using a synthetic volatility index trading algorithm, Dayne Cary and Gary van Vuuren, Cogent Economics & Finance, Volume 7, 2019, Issue 1, doi.org
Note: strangely, in the paper, the authors failed to mention that the SVIX is the complement of the original Stochastic Oscillator, instead reproducing just the original equation. The correct equation for the SVIX was retroengineered by comparing charts they published in the paper with charts generated by this pinescript indicator.
For a more complete indicator, see:
