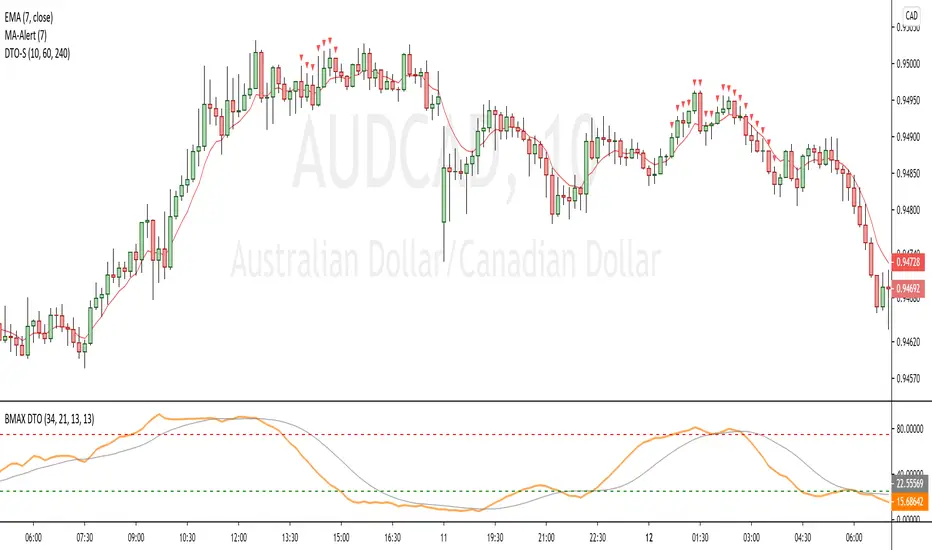
[BMAX] DTO Signal(ENGLISH)
This indicator is a variation of the original DT Oscillator that uses Stochastic and RSI calculations to find momentum opportunities. The purpose of it is to facilitate traking of multiple timeframes for overbought or oversold conditions.
As you can see on the example, we use the DT Oscillator in the selected timeframe, but in order to decide if we take a trade opportunity, we may want to see multiple timeframes in order to check a fractal scenario. DTO Signal indicates when 3 timeframes you select on the configurations are in the same condition, so overbought (above 75) or oversold (bellow 25).
(PORTUGUÊS)
Este indicador é uma variação do indicador DT Oscillator original que utiliza Estocástico e cálculos do RSI para encontrar oportunidades em "momentum". A proposta é facilitar o monitoramento de múltiplos tempos gráficos para condições de sobrecompra ou sobrevenda. Como você pode ver no example, com o uso do DT Oscillator no tempo gráfico escolhido, para que decidamos se tomamos uma posição no mercado, gostaríamos de verificar em múltiplos tempos gráficos uma condição fractal que construa um cenário provavel. DTO Signal indica quando 3 tempos gráficos escolhidos na configuração estão em uma mesma condição, de sobrecompra (acima de 75) ou de sobrevenda (abaixo de 25).
Wyszukaj w skryptach "美联储9月降息25个基点"
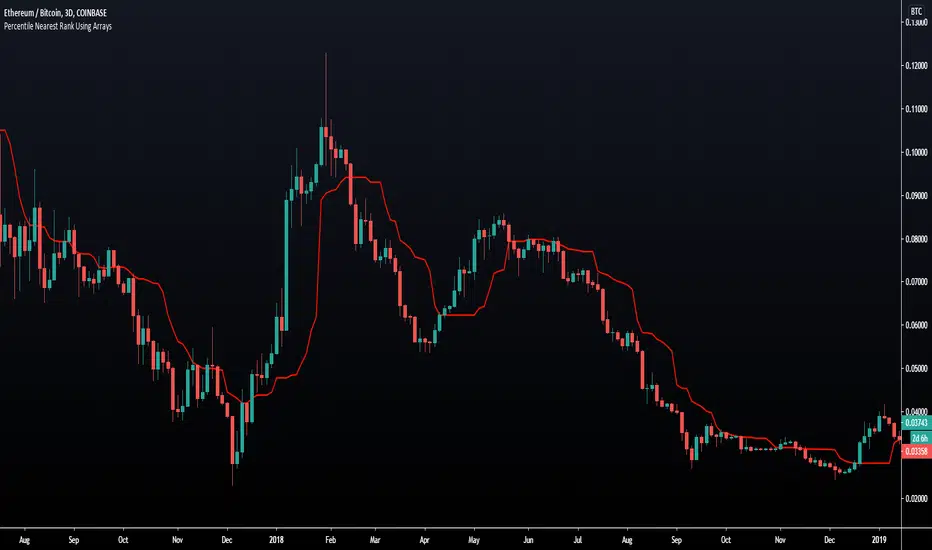
Percentile Nearest Rank Using Arrays [LuxAlgo]The new array feature is extremely powerful, as it will allow pinescript users to do more complex things, or compute existing calculations more efficiently, it will also be possible to shine some light to some already existing functions, one of them being percentile_nearest_rank .
We have been working on this new feature with our pal alexgrover, and made this script which computes a rolling percentile using the nearest rank method.
Settings
Length: Window of the rolling percentile, determine the number of past data to be used.
Percentage: Return the current value if Percentage % of the data fall below that value, the setting is in a range (0,100).
Src: Input source of the indicator.
Usage
A rolling percentile can have many usages when it comes to technical analysis, this is due to its ability to return the value of three common rolling statistics, the rolling median, which can be obtained using a percentage equal to 50, the rolling maximum, obtained with a percentage equal to 100, and the rolling minimum, obtained with a percentage equal to 0.
When we use our rolling percentile as a rolling median, we can obtain a robust estimation of the underlying trend in the price, while using it as a rolling maximum/minimum can allow us to determine if the market is trending, and at which direction. The rolling maximum/minimum is a rolling statistic used to calculate the well known stochastic oscillator and Donchian channel indicator.
We can also compute rolling quartiles, which can be obtained using a percentage of 25 or 75, with one of 25 returning the lower quartile and 75 the upper quartile.
In blue the upper rolling quartile (%75), in orange the lower rolling quartile (%25), both using a window size of 100.
Details
In order to compute a rolling percentile nearest rank, we must first take the most recent length closing prices, then order them in ascending order, we then return the value of the ordered observations at index (percentage/100*length) - 1 (we use - 1 because our array index starts at 0).
NIFTY Adv/Dec Live Count1) NIFTY Index Advance-Decline count
2) Each session, it reads the number of stock are +Ve or -Ve
3) Whichever the side +Ve or -Ve side moving stock is more than count will be plotted
4) at +/- 25 drawn a dotted line if Count is > = +/-25 Nifty is moving in a strong army
Eg:-
in the current session, 30 Stock is moving in +Ve direction & 10 are in -Ve direction
30 count will be plotted in the chart

[A618] Trend Tracker using Chandelier StopTrend Tacker
Works on ATR concepts and uses "Chandelier Stop by pipCharlie" as its main engine
How it is calculated
> 2 ATR stop plots are plotted
> #one ATR stop is of current time frame
> other one is the 5 times multiple of the current timeframe
> Their crossovers are analysed with the close of Current Timeframe
> This sort of methodology can help one with generating consistent entry signals over a particular timeframe
> My timeframe of choice is : 5 mins
> I have used resolution of 25, for 5 mins (see 5*5 =25)
Credits:
Chandelier Stop by pipCharlie
Hope this helps!!!

MARKET DYNAMICS HH LL BREAKOUTThis strategy is designed for Bank nifty and Nifty Indices on 5 min chart.This positional strategy ,go long when the long signal came and exit your buy position when sell signal generated by the strategy and again go short for next trade e g . when long signal came buy bank nifty 25 quantity ,book your profit or loss in next sell signal and again made SELL position with 25 quantity.
it is a non repainting strategy. this is just a breakout strategy and its accuracy is good. Slippages are not considered in the return.

mForex - Keltner channel + EMA Scalping systemTransaction setup parameters
Time frame: M5, M15
Currency pair: EUR / USD , GPB / USD
Transaction: London, USA
Number of orders / day: 10 - 15 orders
Trading strategies
=== BUY ===
Candles close on the upper Keltner
EMA10 crosses the upper Keltner range from below
Stop loss in the middle band or up to 12 pips
Profit target: 15-25 pips
=== SELL ===
Candles close below Keltner below
EMA10 crosses the Keltner range below from above
Stop loss in the middle band or up to 12 pips
Profit target: 15-25 pips

Vertical Horizontal Moving Average [AneoPsy & alexgrover] Moving average adapting to the strength of the trend, this is made possible by using the square of the vertical-horizontal filter as a smoothing factor. Alerts are included with two different types of conditions available to the user.
Settings
Length : Period of the moving average
Src : Input data for the indicator
Alerts : Types of conditions to be used in the alerts, when set to "VHMA Direction Change" alerts are triggered once the VHMA is either rising or declining, else the alerts are based on the crosses between Src and the VHMA
Usage
The VHMA can be used as a fast or slow-moving average in a moving average crossover system, or as input for other indicators.
VHMA of with length = 25 and sma with length = 200.
VHMA with length = 25 used as input for the RSI with length = 14.
Details
The vertical-horizontal filter is a measure of the strength of the trend and lay in a (0,1) range, to calculate it you just need to divide the rolling range over with the rolling sum of the absolute price changes, squaring the result allow to get lower results with higher values of length .
Squared vertical horizontal filter with length = 50, the value is low when the market is ranging and high when trending.
To set the alerts go in the alert panel, click on create alert, and select VHMA in "condition", choose between the buy or sell alert. If Src = closing price or another indicator dependant on the closing price select in options "once per bar close", if the indicator using the opening or lagged closing prices values as input select "One per bar" instead.
Thanks
Thanks to AneoPsy for adding the color change, the idea to use two kinds of conditions for the alert, and for its feedback, you can follow him
www.tradingview.com
and finally thanks to you for reading and for your support, only one last script left for the month, then we'll start July with some pretty interesting indicators, I hope you'll like them ^^/

Sto RSI and kijun-sen line to determine and follow the trend This script uses 25-75 treshold of stochastic RSI with the help of kijun-sen as confirmation, to find entry points to any trend either newly developed or an established one. I just realized it on the 1 hour SPX chart. Sure it can be used on other symbols. Crossing above/below 25/75 line of sto RSI is considered as buy/sell signal. Signals are evaluated whether price be above/below kijun-sen line. If a sell signal below kijun-sen is generated it is a continuation signal for downtrend, otherwise it is a countertrend signal (maybe a signal for a new downtrend). A countertrend signal must be evaluated carefully and only accepted in the right side of kijun-sen. e.g entering a sell signal generated above kijun-sen should be accepted only below the kijun-sen, vice-versa.

Terminal : USD Based Stock Markets Change (%)Hello.
This script is a simple USD Based Stock Markets Change (%) Data Terminal.
You can also set the period to look back manually in the menu.
In this way, an idea can be obtained about Countries' Stock Markets.
And you can observe the stock exchanges of relatively positive and negative countries from others.
Features
Value changes on a percentage basis (%)
Stock exchange values are calculated in dollar terms.
Due to the advantage of movement, future data were chosen instead of spot values on the required instruments.
Stock Markets
Usa : S&P 500 Futures
Japan: Nikkei 225 Futures
England: United Kingdom ( FTSE ) 100
Australia: Australia 200
Canada: S&P / TSX Composite
Switzerland: Swiss Market Index
New Zealand: NZX 50 Index
China: SSE Composite (000001)
Denmark: OMX Copenhagen 25 Index
Hong-Kong: Hang Seng Index Futures
India: Nifty 50
Norway: Oslo Bors All Share Index
Russia: MOEX Russia Index
Sweden: OMX Stockholm Index
Singapore: Singapore 30
Turkey: BIST 100
South Africa: South Africa Top 40 Index
Spain: IBEX 35
France: CAC 40
Italy: FTSE MIB Index
Netherlands: Netherlands 25
Germany : DAX
Regards.

Bull Club BiasThe script intends to eliminate noise from the chart. It uses a combination of multiple indicators into 1.
For long bias:
Close is greater than the ADX
15 Period EMA on close is greater than SMA on high
13 period RSI is greater than 25 periods RSI
MACD is greater than 0
For short bias:
Close is lower than the ADX
15 Period EMA on close is lower than SMA on high
13 period RSI is lower than 25 periods RSI
MACD is lower than 0
For every other combination, it is a range-bound bias. NSE:BANKNIFTY
A green background indicates long bias
A Red background indicates short bias
An Orange background indicates range-bound bias

Easy Directional Movement IndexNothing more than a graphical tweak for the integrated Directional movement index (DMI). The purpose is to make the reading of the DMI easier and more immediate.
The area between DI+ and DI- is filled, and the indicator's range in divided into 4 sections, each of them representing a different price tendency:
- When ADX line is inside the red colored area (0-25), the market is in a ranging phase.
- When inside the aqua colored area (25-50), there is a trend.
- When inside the blue colored area (50-75), there is a strong trend
- When inside the navy colored area (75-100), there is an extremely strong trend.
However keep in mind that these are default levels that may be not always significant. You can change them from the script settings as you prefer, to better tweak your analysis.
Please support my work and follow me if you like my scripts. Many more of them are coming in the future.
@Bezzus

Ichimoku with Correct DisplacementThe default Ichimoku Cloud by TradingView is strange. The kumo is only displaced 25 periods forward, and the chikou is displaced 25 periods back. This is because TradingView had the correct value for displacement (26), but they decided to subtract this displacement by 1 when actually drawing the kumo and add 1 when drawing the chikou. This script fixes this and allows for easier customization of each line in the Ichimoku.

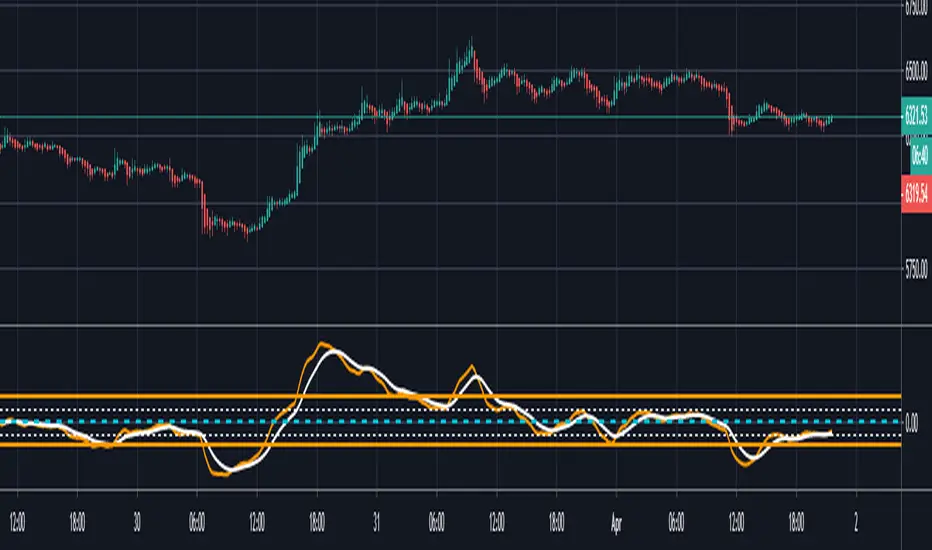
MACD At Scales with AlertsI use the horizontal scale lines on the MACD indicator as part of my scalping strategy along with other indicators like RSI/EMA and Market Cipher B when trading BTC
I am looking for a cross above or below the 12.5 and 25 horizontal scale lines, along with lining up other indicators
I set my alerts on the 5 min TF and look to the 15 and 30 min TF's for further confirmation.
I have find the scale lines to be very useful for visual reference of the crosses, above/below 25 lines is mostly a safer trade, crosses above/below 12.5 lines can have more risk, crosses between 0 baseline and 12.5 can have a higher return but have much more risk.
Don't ever use just this indicator by itself, you must always have at least 2 indicators running
This is an example of the TF's not lining up, so a entry here would be high risk
This is an example of the TF's lining up, so a entry here would be less risk
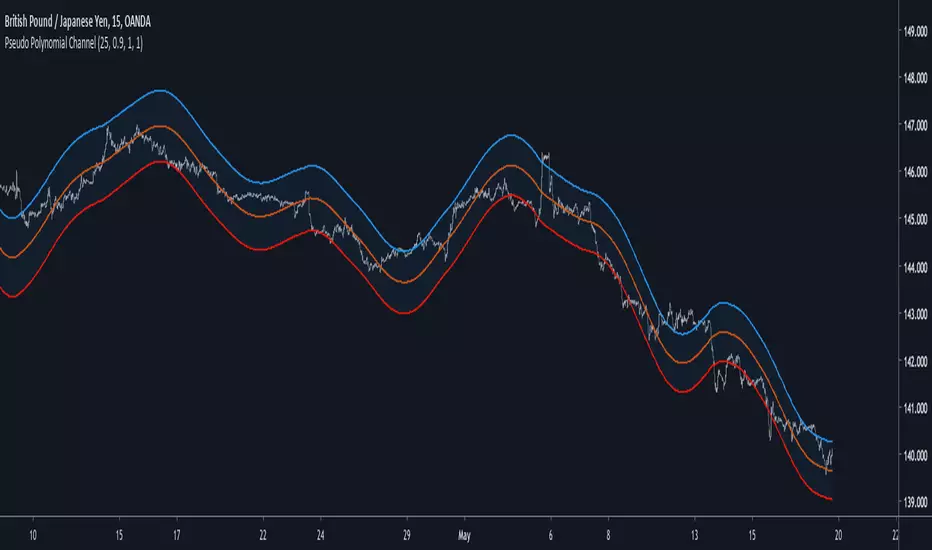
Pseudo Polynomial ChannelIntroduction
Back when i started using pine i made a script called periodic channel who aimed to rescale an average correlated sine wave to the price...don't worked very well. So i tried to fix problems induced by the indicator without much success, i had to redo it from scratch while abandoning the idea of rescaling correlated smooth functions to the price, at that time i also received requests regarding polynomial channel, some plateformes included this indicator, this led me to the idea to estimate it in order to both respond to the periodic channel problems and the requests i received, i have tried many many things and recently i tweaked a linear extrapolation to have an approximation.
Linear Extrapolation To Pseudo Polynomial Regression
I could be wrong but a polynomial regression must use constant parameters in order to provide a really smooth output, at least constant for a set of time. The moving averages forms (Savitzky-Golay moving average) who smooth polynomials across a window to the data don't have such smoothness, so how to estimate a polynomial regression while having a parameter providing control over the smoothness, a response to this is by using a recursive linear extrapolation. I posted a linear extrapolation indicator long ago, i used the same formula while adding a function to morph the output and the input in the form of :
morph * output + (1-morph) * input
How can this provide an estimate of a polynomial regression ? Well i'm not even sure myself but if you use the output as input (morph = 1) for the linear extrapolation function you should get a rough estimate of a line, this is what i thought at first and it proved to be right
Based on this observation i thought that it would be possible to get polynomial results by lowering morph, and as expected it worked well but showed a periodic pattern, this is why i smooth k in line 10.
0.9 for morph work well, higher values create sometimes smoother results but damage heavily the estimation.
Parameters
Morph have been introduced earlier, it control the amount of output and input the linear extrapolation should process, lower values create rougher but more stables results, if you see that the estimation is going nuts lower morph or change length, also lower length if you increase morph .
High overshoot, morph to 0.8 can help have a better estimation at the cost of less smoothness.
Length control the indicator smoothing, this parameter differ heavily from other filters, therefore low values can create mid/long term smoothing, it can also depend on which market instrument you are applying it, so there are no fixed optimal length.
Mult control how spread the bands are, to do so mult multiply the cumulative mean error, you can change this error measurement by anything you want like standard deviation/atr/range but take into account that you may create a separate parameter to control the error instead of length . Mult can be a float and like length can have different optimal values depending on the market the indicator is applied to.
Flatten do exactly what is name imply, it flatten the overall output to have a better estimation, can be a float. The result is less smooth.
Flatten = 2
More Exemples
BTCUSD length = 25 and mult = 4
XPDUSD length = 25 and mult = 1
ALPHABET length = 6 and morph = 0.99
Conclusion
I tried to estimate a polynomial channel by using recursion in the linear extrapolation function. This build is way more stable than the periodic channel but its still a bit inaccurate in my opinion. I hope this code can still help someone build something really nice, if so share your results :)
I apologize for those expecting a legit polynomial channel build but i really don't know how to do that, as i said parameters for the regression must be constants, i hope it still fine :)
Thanks for reading !
Modified Gann HiLo ActivatorIntroduction
The gann hilo activator is a trend indicator developed by Robert Krausz published into W. D. Gann Treasure Discovered: Simple Trading Plans for Stocks & Commodities . This indicator crate a trailing stop aiming to show the direction of the trend.
This indicator is fairly easy to compute and dont require lot of skills to understand. First we calculate the simple moving average of both price high and price low, when the close price is higher than the moving average of the price high the indicator return the moving average of the price low, else the indicator return the moving average of the price high if the close price is lower than the moving average of the price low.
My indicator add a different calculation method in order to avoid whipsaw trades as well as adding significance to the moving average length. A Median method has been added to provide more robustness.
The Indicator
The indicator is a simple trailing stop aiming to show the direction of the trend. The indicator use a different source instead of the price high/low for its calculation. The first method is the "SMA" method which like the classic hilo indicator use a simple moving average for the calculation of the indicator.
Sma Method with length = 25
The "Median" use a moving median instead of a simple moving average, this provide more robustness.
Median Method with length = 25
The shape is less curved and the indicator can sometimes avoid whipsaw with high's length periods.
Mult Parameter
The mult parameter is a parameter set to be lower or equal to 1 and greater or equal to 0. High values allow the indicator to be far from the price thus avoiding whipsaw trades, lower ones lower the distance from the price. A mult parameter of 0.1 approximate the original hilo indicator.
In blue the indicator with mult = 0.1 and in radical red the original hilo activator.
Conclusion
The modifications allow more control over the indicator as well as adding more robustness while the original one is destined to fail when market price is more complex.
Thanks for reading :)
For any questions/suggestions feel free to pm me

Average Candle LengthThis script is designed to show you the average candle size in pips (wick to wick) for however many bars you choose (20 is default).
The idea is that if the average candle size for the last 20 bars is, let's say 25, you would probably not want to set your stop loss less than 25 because it is more likely to get hit.
if you find this script helpful, tips and donations are always appreciated (venmo @rick-munoz) :)

Future Least Squares Moving Average//+------------------------------------------------------------------+
// | Future Least Squares Moving Average |
// | 未来予測LSMA |
// | Ver.1.0 |
// | Copyright Sakura |
//+------------------------------------------------------------------+
//LSMAは一時回帰直線の現在地の点の集合であるということは、未来の点を使えば未来を描けるはずというアホなことを無理やり考えました。
//結論はうまくいかなかったですので、パラメーターをいじって誤魔化しという結果に。
//それでも、先に書いてますので急激な価格変動に対処できる訳もなくといった感じになっています。
//displacementは一目に合わせたいので26固定の方向でとしたいところですが厳しいですね。
//
//設定例
//SMA(25)≒FLSMA(25,7,13)
//SMA(50)≒FLSMA(50,13,26)
//SMA(75)≒FLSMA(75,20,26)

How to automate this strategy for free using a chrome extension.Hey everyone,
Recently we developed a chrome extension for automating TradingView strategies using the alerts they provide. Initially we were charging a monthly fee for the extension, but we have now decided to make it FREE for everyone. So to display the power of automating strategies via TradingView, we figured we would also provide a profitable strategy along with the custom alert script and commands for the alerts so you can easily cut and paste to begin trading for profit while you sleep.
Step 1:
You are going to need to download the Chrome Extension called AutoView. You can get the extension for free by following this link: bit.ly ( I had to shorten the link as it contains Google and TV automatically converts it to a symbol)
Step 2: Go to your chrome extension page, and under the new extension you'll see a "settings" button. In the setting you will have to connect and give permission to the exchange 1broker allowing the extension to place your orders automatically when triggered by an alert.
Step 3: Setup the strategy and custom script for the alerts in TradingView. The attached script is the strategy, you can play with the settings yourself to try and get better numbers/performance if you please.
This following script is for the custom alerts:
//@version=2
study("4All-Alert", shorttitle="Alerts")
src = close
len = input(4, minval=1, title="Length")
up = rma(max(change(src), 0), len)
down = rma(-min(change(src), 0), len)
rsi = down == 0 ? 100 : up == 0 ? 0 : 100 - (100 / (1 + up / down))
rsin = input(5)
sn = 100 - rsin
ln = 0 + rsin
short = crossover(rsi, sn) ? 1 : 0
long = crossunder(rsi, ln) ? 1 : 0
plot(long, "Long", color=green)
plot(short, "Short", color=red)
Now that you have the extension installed, the custom strategy and alert scripts in place, you simply need to create the alerts.
To get the alerts to communicate with the extension properly, there is a specific syntax that you will need to put in the message of the alert. You can find more details about the syntax here : gist.github.com
For this specific strategy, I use the Alerts script, long/short greater than 0.9 on close.
In the message for a long place this as your message:
Long
c=order b=short
c=position b=short l=200 t=market
b=long q=0.01 l=200 t=market tp=13 sl=25
and for the short...
Short
c=order b=long
c=position b=long l=200 t=market
b=short q=0.01 l=200 t=market tp=13 sl=25
If you'll notice in my above messages, compared to the strategy my tp and sl (take profit and stop loss) vary by a few pips. This is to cover the market opens and spread on 1broker. You can change the tp and sl in the strategy to the above and see that the overall profit will not vary much at all.
I hope this all makes sense and it is enough to not only make some people money, but to show the power of coming up with your own strategy and automating it using TradingView alerts and the free Chrome Extension AutoView.
ps. I highly recommend upgrading your TradingView account so you have access to back testing and multiple alerts.
There is really no reason you won't cover the cost and then some on a monthly basis using the tools provided.
Best of luck and happy trading.
Note: The extension currently allows for automation on 2 exchanges; 1broker and Okcoin. If you do not have accounts there, we'd appreciate you signing up using our referral links.
www.okcoin.com
1broker.com

EMA Low + Supertrend (Alerts)this strategy uses the EMA LOW(25 89 110 355 and 480) and the Supertrend. the supertrend gives you the BUY/SELL When the market flip

Kalman Ema Crosses - [JTCAPITAL]Kalman EMA Crosses - is a modified way to use Kalman Filters applied on Exponential Moving Averages (EMA Crosses) for Trend-Following.
Credits for the kalman function itself goes to @BackQuant
The Kalman filter is a recursive smoothing algorithm that reduces noise from raw price or indicator data, and in this script it is applied both directly to price and on top of EMA calculations. The goal is to create cleaner, more reliable crossover signals between two EMAs that are less prone to false triggers caused by volatility or market noise.
The indicator works by calculating in the following steps:
Source Selection
The script starts by selecting the price input (default is Close, but can be adjusted). This chosen source is the foundation for all further smoothing and EMA calculations.
Kalman Filtering on Price
Depending on user settings, the selected source is passed through one of two independent Kalman filters. The filter takes into account process noise (representing expected market randomness) and measurement noise (representing uncertainty in the price data). The Kalman filter outputs a smoothed version of price that minimizes noise and preserves underlying trend structure.
EMA Calculation
Two exponential moving averages (EMA 1 and EMA 2) are then computed on the Kalman-smoothed price. The lengths of these EMAs are fully customizable (default 15 and 25).
Kalman Filtering on EMA Values
Instead of directly using raw EMA curves, the script applies a second layer of Kalman filtering to the EMA values themselves. This step significantly reduces whipsaw behavior, creating smoother crossovers that emphasize real momentum shifts rather than temporary volatility spikes.
Trend Detection via EMA Crossovers
-A bullish trend is detected when EMA 1 (fast) crosses above EMA 2 (slow).
-A bearish trend is detected when EMA 1 crosses below EMA 2.
The detected trend state is stored and used to dynamically color the plots.
Visual Representation
Both EMAs are plotted on the chart. Their colors shift to blue during bullish phases and purple during bearish phases. The area between the two EMAs is filled with a shaded region to clearly highlight trending conditions.
Buy and Sell Conditions:
-Buy Condition: When the Kalman-smoothed EMA 1 crosses above the Kalman-smoothed EMA 2, a bullish crossover is confirmed.
-Sell Condition: When EMA 1 crosses below EMA 2, a bearish crossover is confirmed.
Users may enhance the robustness of these signals by adjusting process noise, measurement noise, or EMA lengths. Lower measurement noise values make the filter react faster (but potentially noisier), while higher values make it smoother (but slower).
Features and Parameters:
-Source: Selectable price input (Close, Open, High, Low, etc.).
-EMA 1 Length: Defines the fast EMA period.
-EMA 2 Length: Defines the slow EMA period.
-Process Noise: Controls how much randomness the Kalman filter assumes in price dynamics.
-Measurement Noise: Controls how much uncertainty is assumed in raw input data.
-Kalman Usage: Option to apply Kalman filtering either before EMA calculation (on price) or after (on EMA values).
Specifications:
Kalman Filter
The Kalman filter is an optimal recursive algorithm that estimates the state of a system from noisy measurements. In trading, it is used to smooth prices or indicator values. By balancing process noise (expected volatility) with measurement noise (data uncertainty), it generates a smoothed signal that reacts adaptively to market conditions.
Exponential Moving Average (EMA)
An EMA is a weighted moving average that emphasizes recent data more heavily than older data. This makes it more responsive than a simple moving average (SMA). EMAs are widely used to identify trends and momentum shifts.
EMA Crossovers
The crossing of a fast EMA above a slow EMA suggests bullish momentum, while the opposite suggests bearish momentum. This is a cornerstone technique in trend-following systems.
Dual Kalman Filtering
Applying Kalman both to raw price and to the EMAs themselves reduces whipsaws further. It creates crossover signals that are not only smoothed but also validated across two levels of noise reduction. This significantly enhances signal reliability compared to traditional EMA crossovers.
Process Noise
Represents the filter’s assumption about how much the underlying market can randomly change between steps. Higher values make the filter adapt faster to sudden changes, while lower values make it more stable.
Measurement Noise
Represents uncertainty in price data. A higher measurement noise value means the filter trusts the model more than the observed data, leading to smoother results. A lower value makes the filter more reactive to observed price fluctuations.
Trend Coloring & Fill
The use of dynamic colors and filled regions provides immediate visual recognition of trend states, helping traders act faster and with greater clarity.
Enjoy!

YM Ultimate SNIPER v7# YM Ultimate SNIPER v7 - Documentation & Trading Guide
## 🎯 INTRABAR EDITION | Order Blocks + Liquidity Sweeps + IFVG + INTRABAR ANALYSIS
**TARGET: 3-7 High-Confluence Trades per Day**
**Philosophy: "Zones That Matter" + "See Inside The Candle"**
---
## ⚡ WHAT'S NEW IN v7
### Major Additions: INTRABAR ANALYSIS ENGINE
| Feature | Description | Edge It Provides |
|---------|-------------|------------------|
| **Intrabar Delta** | REAL buy/sell pressure from lower TF | Far more accurate than estimated delta |
| **Intrabar Momentum** | Direction consistency within bar | See if candle formed through conviction |
| **Absorption Detection** | High vol + low price movement | Spot institutional accumulation/distribution |
| **Internal Sweeps** | Stop hunts INSIDE candles | Catch hidden liquidity grabs |
| **Volume Distribution** | Where volume clustered in bar | TOP/MID/BOT volume clustering |
### The Intrabar Advantage
**Problem with Standard Analysis:**
- You only see the final OHLC of each candle
- Delta estimation is educated guesswork
- Internal price action is invisible
- Stop hunts inside bars go undetected
**Solution with Intrabar Analysis:**
- `request.security_lower_tf()` gives us the INSIDE view
- See actual lower timeframe candles within each bar
- Calculate TRUE delta from actual price direction
- Detect sweeps and reversals hidden from current timeframe
---
## 🔬 INTRABAR ANALYSIS DEEP DIVE
### How It Works
When you're on a 5-minute chart, intrabar analysis requests 1-minute data within each 5-minute bar. This gives us 5 sub-candles to analyze within each parent candle.
```
5-MIN CANDLE (What you normally see):
┌────────────────────────────────┐
│ │
│ OPEN ──────── CLOSE │
│ │
└────────────────────────────────┘
INTRABAR VIEW (What v7 sees):
┌────────────────────────────────┐
│ 🕐1 🕐2 🕐3 🕐4 🕐5 │
│ ▲ ▼ ▲ ▲ ▲ │
│ │ │ │ │ │ │
│ Each 1-min candle analyzed │
└────────────────────────────────┘
```
### Intrabar Delta (IB Delta)
**What It Is:**
Real buy/sell pressure calculated from actual lower timeframe candle directions.
**Why It's Better:**
- Standard delta: Estimated from close position within bar
- Intrabar delta: Calculated from 5+ actual candles with known direction
**Calculation:**
```
For each intrabar candle:
├── If bullish (close > open): More weight to buy volume
├── If bearish (close < open): More weight to sell volume
├── Volume distributed by close position within each micro-candle
└── Summed across all intrabar candles = TRUE DELTA
```
**Grades:**
| IB Delta % | Grade | Meaning |
|------------|-------|---------|
| 78%+ | 🔥 EXTREME | One side has overwhelming control |
| 70-77% | ✓✓ STRONG | Clear directional bias |
| 62-69% | ✓ DOMINANT | Healthy dominance |
| <62% | — NEUTRAL | Mixed/uncertain |
---
### Intrabar Momentum (IB Momentum)
**What It Is:**
The percentage of intrabar candles moving in the same direction.
**Why It Matters:**
A bullish candle could form through:
1. **High momentum:** 4 of 5 sub-candles bullish = Strong conviction
2. **Low momentum:** 2 bullish, 2 bearish, 1 bullish = Choppy formation
**Calculation:**
```
IB Momentum = max(bullish_count, bearish_count) / total_intrabar_candles
Example (5-min bar with 1-min intrabar):
├── 1st minute: Bullish ✓
├── 2nd minute: Bullish ✓
├── 3rd minute: Bearish ✗
├── 4th minute: Bullish ✓
├── 5th minute: Bullish ✓
└── IB Momentum = 4/5 = 80% BULLISH
```
**Thresholds:**
| IB Momentum % | Classification | Signal Quality |
|---------------|----------------|----------------|
| 75%+ | 🔥 STRONG | Very high conviction |
| 60-74% | ✓ CONFIRMED | Good directional bias |
| <60% | MIXED | Choppy, low conviction |
---
### Absorption Detection
**What It Is:**
Institutional accumulation/distribution signature - high volume with little price movement.
**The Theory:**
When institutions accumulate (buy), they absorb selling without moving price much:
- Retail sells → Institution buys at limit prices
- Volume spikes but price stays flat
- Once accumulation complete → price explodes up
**Detection Logic:**
```
ABSORPTION = High Volume + Low Price Movement + Volume Clustering
Conditions:
├── Volume per point > 1.5x average
├── Price movement < 60% of average range
├── Volume clusters in one zone (TOP/MID/BOT)
└── Cluster percentage >= 65% threshold
```
**Direction:**
- **BULL ABS:** Volume clustered at BOT + net buy delta = Buying at lows
- **BEAR ABS:** Volume clustered at TOP + net sell delta = Selling at highs
**Visual:** ✕ marker below (bull) or above (bear) the candle
---
### Internal Sweeps (Hidden Liquidity Grabs)
**What It Is:**
Stop hunts that happen INSIDE a candle - invisible on current timeframe.
**The Setup:**
```
INTERNAL BULLISH SWEEP:
┌─────────────────────────────────┐
│ │
│ First Half: Second Half: │
│ ▲▼▲▼ ▲▲▲ │
│ Forms lows Reverses UP │
│ ↓ ↑ │
│ SWEEP REJECTION │
└─────────────────────────────────┘
= Hidden liquidity grab at lows, bullish
```
**Detection:**
```
Internal Bull Sweep:
├── Early intrabar candles form a low
├── Later intrabar candles sweep below that low
├── Final intrabar candles close back above
├── Parent candle closes green
└── = Hidden sweep, bullish reversal
Internal Bear Sweep:
├── Early intrabar candles form a high
├── Later intrabar candles sweep above that high
├── Final intrabar candles close back below
├── Parent candle closes red
└── = Hidden sweep, bearish reversal
```
**Visual:** "iS" marker (intrabar Sweep) on the candle
---
### Volume Distribution
**What It Is:**
Where volume clustered within the parent candle - TOP, MID, or BOT third.
**Why It Matters:**
- **BOT clustering + bullish delta:** Institutions buying at lows (bullish)
- **TOP clustering + bearish delta:** Institutions selling at highs (bearish)
- **MID clustering:** Balanced/uncertain
**Calculation:**
```
Divide parent candle into 3 zones:
├── TOP third: high - (range/3)
├── MID third: middle zone
└── BOT third: low + (range/3)
For each intrabar candle:
├── Calculate midpoint
├── Assign volume to TOP/MID/BOT based on midpoint
└── Sum volumes by zone
```
---
## 📊 ENHANCED CONFLUENCE SCORING v7
### Score Components (Max ~14, normalized to 10)
| Factor | Points | Condition |
|--------|--------|-----------|
| **Tier** | 1-3 | B=1, A=2, S=3 |
| **FVG Zone** | +1.5 | Price in quality FVG |
| **Order Block** | +1.5 | Price in OB |
| **IFVG** | +1.0 | Price in Inverse FVG |
| **Strong Volume** | +1.0 | Volume ≥ 2x average |
| **Extreme Volume** | +0.5 | Volume ≥ 2.5x average |
| **Strong Delta** | +1.0 | Delta ≥ 70% |
| **Extreme Delta** | +0.5 | Delta ≥ 78% |
| **CVD Momentum** | +0.5-1.0 | CVD trending with signal |
| **Liquidity Sweep** | +1.5 | Recent sweep confirms direction |
| **IB Delta Confirm** | +0.9-1.5 | Intrabar delta matches direction |
| **IB Momentum** | +0.5-1.0 | Consistent intrabar direction |
| **IB Absorption** | +1.0 | Absorption detected matching direction |
| **IB Internal Sweep** | +1.0 | Hidden sweep confirms direction |
| **Volume Cluster** | +0.5 | Volume at favorable zone (BOT for bull) |
### Intrabar Confluence Breakdown
```
INTRABAR CONFLUENCE ADDITIONS:
IB Delta Confirmation:
├── Strong (70%+) + matching direction = +1.5 pts
├── Dominant (62%+) + matching direction = +0.9 pts
└── Not matching = +0 pts
IB Momentum:
├── Strong (75%+) + matching direction = +1.0 pts
├── Confirmed (60%+) + matching direction = +0.5 pts
└── Mixed/not matching = +0 pts
IB Absorption:
├── Bull absorption for LONG = +1.0 pts
├── Bear absorption for SHORT = +1.0 pts
└── No absorption or wrong direction = +0 pts
IB Internal Sweep:
├── Bull internal sweep for LONG = +1.0 pts
├── Bear internal sweep for SHORT = +1.0 pts
└── No internal sweep = +0 pts
Volume Cluster:
├── BOT cluster for LONG = +0.5 pts
├── TOP cluster for SHORT = +0.5 pts
└── MID cluster or wrong zone = +0 pts
```
---
## 🎯 IDEAL SETUPS v7 (HIGHEST WIN RATE)
### Setup 1: Absorption + Zone + Tier (NEW!)
```
Conditions:
├── Absorption detected (✕ marker)
├── Price at Order Block or FVG
├── Tier signal fires (S/A/B)
├── IB Delta confirms direction
├── Score: 8+ EXCELLENT
└── Win Rate: ~80-88%
WHY IT WORKS:
Absorption = institutions filling orders
Zone = known institutional level
Tier = significant move
= Triple institutional confirmation
```
### Setup 2: Internal Sweep + Zone
```
Conditions:
├── Internal sweep detected (iS marker)
├── At or near OB/FVG zone
├── IB momentum confirms (75%+)
├── Score: 7+ EXCELLENT
└── Win Rate: ~75-85%
WHY IT WORKS:
Hidden sweep = invisible stop hunt
Zone = where institutions defend
= Retail trapped, you enter with smart money
```
### Setup 3: Full Intrabar Alignment
```
Conditions:
├── IB Delta: Strong/Extreme (✓✓ or 🔥)
├── IB Momentum: Strong (🔥)
├── Volume Cluster: Favorable zone
├── Standard delta confirms
├── Score: 7+ EXCELLENT
└── Win Rate: ~75-82%
WHY IT WORKS:
All intrabar metrics align
= Maximum conviction in candle formation
= High probability continuation
```
### Setup 4: Standard v6 Setup (Still Valid)
```
Conditions:
├── Liquidity Sweep (LS↑ or LS↓)
├── Price at Order Block or FVG
├── Tier signal fires
├── Score: 7+ EXCELLENT
└── Win Rate: ~75-85%
```
---
## 📊 ENHANCED TABLE REFERENCE v7
The v7 table adds the **INTRABAR** section:
### CANDLE Section
| Row | What It Shows |
|-----|---------------|
| Points | Candle range in points + Tier (S/A/B/X) |
| Volume | Volume ratio + grade |
### ORDERFLOW Section
| Row | What It Shows |
|-----|---------------|
| Delta | Buy/Sell % + grade (now uses IB delta if available) |
| CVD | Direction + strength |
### INTRABAR Section (NEW!)
| Row | What It Shows |
|-----|---------------|
| IB Delta | TRUE intrabar buy/sell % + grade |
| IB Momentum | Direction consistency % + grade |
| Absorption | BULL ABS / BEAR ABS / — + 🎯 indicator |
### STRUCTURE Section
| Row | What It Shows |
|-----|---------------|
| FVG Zone | Current zone + quality score |
| Order Block | OB status |
| Liq Sweep | External LS↑/↓ or internal iS↑/↓ + indicator |
### SIGNAL Section
| Row | What It Shows |
|-----|---------------|
| Session | Current session + active indicator |
| SCORE | Numeric score /10 + classification |
---
## 🔧 INTRABAR SETTINGS GUIDE
### Intrabar Timeframe Selection
| Chart TF | Recommended Intrabar TF | Sub-candles |
|----------|------------------------|-------------|
| 1 min | 1 (same) | Limited data |
| 3 min | 1 | 3 candles |
| 5 min | 1 | 5 candles |
| 15 min | 1 or 5 | 15 or 3 candles |
| 30 min | 5 | 6 candles |
| 1 hour | 5 or 15 | 12 or 4 candles |
**Rule of Thumb:** Lower intrabar TF = more data = more accurate
### Parameter Tuning
**Absorption Threshold (Default: 65%)**
```
Lower (50-60%): More absorption signals, some false positives
Standard (65%): Balanced detection
Higher (70-80%): Fewer signals, higher quality
```
**Intrabar Momentum Min (Default: 60%)**
```
Lower (50-55%): Accepts mixed candles as directional
Standard (60%): Requires clear majority
Higher (70-80%): Requires strong conviction
```
**Intrabar Delta Weight (Default: 1.5)**
```
Lower (0.5-1.0): Intrabar delta contributes less to score
Standard (1.5): Full contribution
Higher (2.0-3.0): Intrabar delta heavily weighted
```
---
## ✅ ENTRY CHECKLIST v7
### Basic Requirements
- Signal present (S🎯/A🎯/B🎯 or Z)
- Score ≥ 4.5 (MEDIUM or better)
- Session active (🟢)
### Orderflow Confirmation
- Delta colored (not gray)
- CVD arrow matches direction
- Volume shows ✓ or better
### Intrabar Confirmation (NEW!)
- IB Delta matches direction (✓ or better)
- IB Momentum shows direction or strong (🔥)
- No conflicting absorption signal
### Structure Bonus
- In FVG Zone
- In Order Block
- Recent Liquidity Sweep
- Internal Sweep (iS)
- Absorption detected
- IFVG present
---
## 🚨 NEW ALERTS v7
### Intrabar-Specific Alerts
| Alert | What It Means | Priority |
|-------|---------------|----------|
| ⚡ INTRABAR BULL SWEEP | Hidden sweep lows inside candle | 🟠 HIGH |
| ⚡ INTRABAR BEAR SWEEP | Hidden sweep highs inside candle | 🟠 HIGH |
| 🎯 BULL ABSORPTION | Institutions accumulating | 🟠 HIGH |
| 🎯 BEAR ABSORPTION | Institutions distributing | 🟠 HIGH |
### Alert Priority Guide
| Alert | Priority | Action |
|-------|----------|--------|
| ⭐ EXCELLENT + ABSORPTION | 🔴 CRITICAL | Top-tier, enter immediately |
| ⭐ EXCELLENT LONG/SHORT | 🔴 CRITICAL | Check NOW |
| 🎯 ABSORPTION | 🟠 HIGH | Check for zone confluence |
| ⚡ INTRABAR SWEEP | 🟠 HIGH | Hidden opportunity |
| 🎯 S-TIER | 🟠 HIGH | Evaluate quickly |
---
## ⛔ DO NOT TRADE v7
All previous rules PLUS:
- IB Delta strongly conflicts with signal direction
- IB Momentum shows opposite direction at 75%+
- Absorption detected in OPPOSITE direction
- Score inflated only by intrabar (no structure)
- Intrabar data unavailable (empty array)
---
## 📝 TECHNICAL NOTES v7
### Compatibility
- **Pine Script v6** (required for `request.security_lower_tf()`)
- **Works on**: YM, MYM, NQ, MNQ, ES, MES, GC, MGC, BTC
- **Chart Type**: Standard candlestick (not Renko/Heikin Ashi)
- **Timeframes**: 1-minute to 4-hour recommended
- **Tick Charts**: Use 1-minute intrabar TF
### Performance Notes
- Intrabar analysis adds computational overhead
- If chart loads slowly, try higher intrabar TF
- `request.security_lower_tf()` returns array of data
- Empty arrays indicate no lower TF data available
### Timeframe Limitations
```
request.security_lower_tf() works when:
├── Intrabar TF < Chart TF (e.g., 1 min intrabar on 5 min chart)
└── Chart receives enough data from lower TF
Does NOT work when:
├── Intrabar TF >= Chart TF
├── Tick charts with minute intrabar (use seconds or same)
└── Very old historical data
```
---
## 📈 TRADE JOURNAL v7
```
DATE: ___________
SESSION: ☐ LDN ☐ NY ☐ PWR
SETUP TYPE:
☐ Absorption + Zone ☐ Internal Sweep ☐ Full IB Align
☐ Sweep + Zone ☐ IFVG ☐ OB+FVG ☐ Zone Entry
TRADE:
├── Time: _______
├── Signal: S🎯 / A🎯 / B🎯 / Z / LS / iS
├── Direction: LONG / SHORT
├── Score: ___/10 (EXCELLENT / MEDIUM)
├── Entry: _______
├── Stop: _______
├── Target: _______
│
├── In FVG Zone: ☐ Yes ☐ No
├── In Order Block: ☐ Yes ☐ No
├── Liquidity Sweep: ☐ Yes ☐ No
├── Internal Sweep: ☐ Yes ☐ No
├── Absorption: ☐ Yes ☐ No
├── IFVG Present: ☐ Yes ☐ No
│
├── IB Delta: _____% (BULL / BEAR)
├── IB Momentum: _____% (BULL / BEAR / MIXED)
├── Volume Cluster: TOP / MID / BOT
│
├── Result: +/- ___ pts ($_____)
└── Notes: _______________________
DAILY SUMMARY:
├── Trades: ___
├── EXCELLENT setups: ___
├── With Absorption: ___
├── With Internal Sweep: ___
├── Wins: ___ | Losses: ___
├── Net P/L: $_____
└── Best setup type: _______________________
```
---
## 🏆 GOLDEN RULES v7
> **"Intrabar shows the truth the candle hides."**
> **"Absorption = They're loading. Get ready."**
> **"Internal sweep = Hidden trap. Enter after."**
> **"IB Delta + IB Momentum aligned = Maximum conviction."**
> **"When intrabar conflicts with signal, trust intrabar."**
> **"Volume at lows + buying = Institutions accumulating."**
> **"Confluence beats conviction. Stack the factors."**
> **"Leave every trade with money. The next setup is coming."**
---
## 🔧 TROUBLESHOOTING v7
| Issue | Solution |
|-------|----------|
| No intrabar data | Lower your chart TF or raise intrabar TF |
| IB Delta always neutral | Check intrabar TF is lower than chart TF |
| Too many absorption signals | Raise absorption threshold to 70%+ |
| Missing internal sweeps | More common on volatile markets |
| Slow chart loading | Use higher intrabar TF (5 instead of 1) |
| IB section not in table | Enable "Show Intrabar Metrics" |
| Conflicting signals | Trust intrabar data over standard delta |
---
## 📚 QUICK REFERENCE CARD
```
┌─────────────────────────────────────────────────────────────────────────┐
│ YM ULTIMATE SNIPER v7 │
├─────────────────────────────────────────────────────────────────────────┤
│ │
│ SIGNALS: │
│ S🎯 = S-Tier (50+ pts) → HOLD position │
│ A🎯 = A-Tier (25-49 pts) → SWING trade │
│ B🎯 = B-Tier (12-24 pts) → SCALP quick │
│ Z = Zone entry │
│ LS↑/↓ = External Liquidity Sweep │
│ iS↑/↓ = Internal (intrabar) Sweep │
│ ✕ = Absorption detected │
│ │
│ INTRABAR METRICS: │
│ IB Delta = TRUE buy/sell from lower TF │
│ IB Momentum = Direction consistency within bar │
│ Absorption = High vol + low move = accumulation │
│ Vol Cluster = TOP/MID/BOT volume distribution │
│ │
│ INTRABAR GRADES: │
│ 🔥 = Extreme (78%+ delta or 75%+ momentum) │
│ ✓✓ = Strong (70%+ delta) │
│ ✓ = Confirmed (62%+ delta or 60%+ momentum) │
│ — = Neutral / Mixed │
│ │
│ HIGH PROBABILITY SETUPS: │
│ 1. Absorption + Zone + Tier (~80-88%) │
│ 2. Internal Sweep + Zone (~75-85%) │
│ 3. Full Intrabar Alignment (~75-82%) │
│ 4. Standard Sweep + Zone (~75-85%) │
│ │
│ SCORE CLASSIFICATION: │
│ EXCELLENT (7.0+) = Full size, high confidence │
│ MEDIUM (4.5-6.9) = Standard size, good setup │
│ WEAK (<4.5) = No signal shown │
│ │
└─────────────────────────────────────────────────────────────────────────┘
```
---
*© Alexandro Disla - YM Ultimate SNIPER v7*
*Intrabar Edition | See Inside The Candle*

VWAP with StdDev + 0,25 channelsThis indicator displays the Volume Weighted Average Price (VWAP) together with standard deviation bands and additional ±0.25 offset bands. VWAP serves as the central reference line, while the deviation bands show how far price typically moves away from VWAP.
1 standard deviation (±1σ) covers roughly 68% of all price movements around VWAP.
2 standard deviations (±2σ) cover about 95% of price movements.
3 standard deviations (±3σ) cover approximately 99.7% of price movements.
Around VWAP and the first deviation level, extra ±0.25 offset bands are added to highlight tighter ranges. These shaded zones help traders identify areas of expected price concentration, potential support and resistance, and volatility boundaries.
Purpose: The tool provides a statistical framework for intraday trading. VWAP shows the average traded price weighted by volume, while the deviation bands indicate probability zones where price is most likely to remain.

VWAP mit StdDev + 0,25 Bändern (dezent)This indicator displays the Volume Weighted Average Price (VWAP) together with standard deviation bands and additional ±0.25 offset bands. VWAP serves as the central reference line, while the deviation bands show how far price typically moves away from VWAP.
1 standard deviation (±1σ) covers roughly 68% of all price movements around VWAP.
2 standard deviations (±2σ) cover about 95% of price movements.
3 standard deviations (±3σ) cover approximately 99.7% of price movements.
Around VWAP and the first deviation level, extra ±0.25 offset bands are added to highlight tighter ranges. These shaded zones help traders identify areas of expected price concentration, potential support and resistance, and volatility boundaries.
Purpose: The tool provides a statistical framework for intraday trading. VWAP shows the average traded price weighted by volume, while the deviation bands indicate probability zones where price is most likely to remain.
