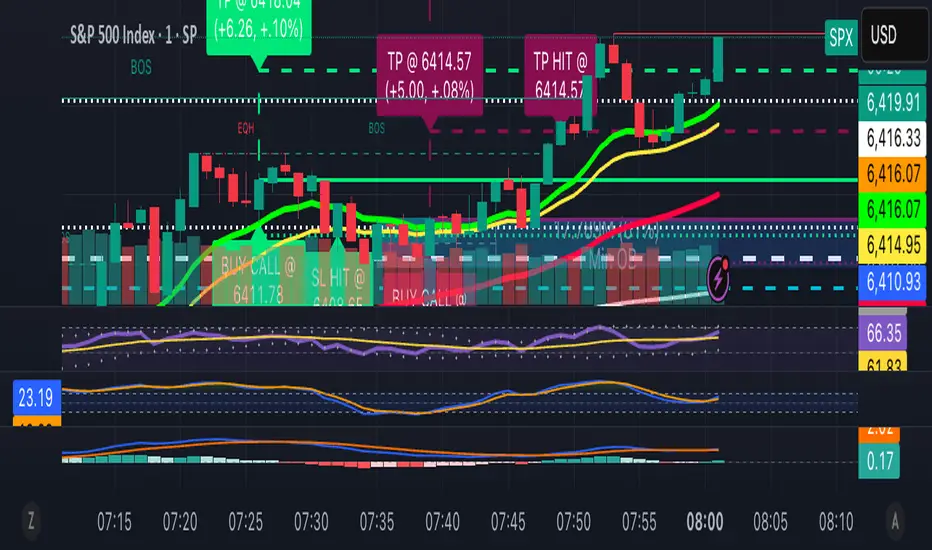
13/48 EMA Trading Scalper (ATR TP/SL)13/48 EMA Trading Scalper (ATR TP/SL)
What it does:
This tool looks for price “touches” of the 13-EMA, only takes CALL entries when the 13 is above the 48 (uptrend) and PUT entries when the 13 is below the 48 (downtrend), and confirms with a simple candle pattern (green > red with expansion for calls, inverse for puts). Touch sensitivity is ATR-scaled, so signals adapt to volatility. Each trade gets auto-drawn entry, TP, and SL lines, colored labels with $ / % distance from entry, plus optional TP/SL hit alerts. A rotating color palette and per-bar label staggering help keep the chart readable. Old objects are auto-pruned via maxTracked.
How it works
Trend filter: 13-EMA vs 48-EMA.
Entry: ATR-scaled touch of the 13-EMA + candle confirmation.
Risk: TP/SL = ATR multiples you control.
Visuals: Entry/TP/SL lines (extend right), vertical entry marker (optional), multi-line labels.
Hygiene: maxTracked keeps only the last N trades’ objects; labels are staggered to reduce overlap.
Alerts: Buy Call, Buy Put, Take Profit Reached, Stop Loss Hit.
Key Inputs
Fast EMA (13), Trend EMA (48), ATR Length (14)
Touch Threshold (x ATR) – how close price must come to the EMA
Take Profit (x ATR), Stop Loss (x ATR)
maxTracked – number of recent trades to keep on chart
Tips
Start with Touch = 0.10–0.20 × ATR; TP=2×ATR, SL=1×ATR, then tune per symbol/timeframe.
Works on intraday and higher TFs; fewer, cleaner signals on higher TFs.
This is an indicator, not a broker—always backtest and manage risk.
Wyszukaj w skryptach "细算江西救护车家长倒赚了四万三+-医疗花费13万(家长视频)++医保报"
parademi 5-8-13EMA 5-8-13 Trend & Crossover Indicator
This indicator helps you identify market trends and potential reversal points in a single tool. It uses three Exponential Moving Averages (EMA 5, EMA 8, and EMA 13) to determine trend direction and highlight important crossover signals.
Features:
Trend Detection:
When the price is above all three EMAs (5, 8, and 13), candles are colored green, indicating a strong uptrend.
When the price crosses EMA 8, candles turn orange, signaling a possible short-term change in momentum.
Crossover Signals:
When EMA 5 crosses above EMA 8, a green arrow appears below the candle, suggesting a potential buy signal.
When EMA 5 crosses below EMA 8, a red arrow appears above the candle, suggesting a potential sell signal.
Optional EMA 8 and EMA 13 crossover signals can also be displayed using the same logic.
Purpose:
This indicator visually clarifies trend direction and marks potential entry/exit points. It can be used on its own or combined with other technical tools such as volume, support/resistance levels, or momentum indicators for higher accuracy.

Multiple Ema 8/13/21/55 by melihgulerIn one graph, 4 different periods include EMA (8/13/21/55). It is not recommended for short-term investments. You can get efficient results using at least 4 hours chart.
It is not an investment recommendation. Your use is at your own risk.

Multiple Ema 8/13/21/55 by melihgulerIn one graph, 4 different periods include EMA (8/13/21/55). It is not recommended for short-term investments. You can get efficient results using at least 4 hours chart.
It is not an investment recommendation. Your use is at your own risk.

Strategy Myth-Busting #13 - MultiEMA+BXTrender - [SP/MYN]#13 on the Myth-Busting bench, we are automating the "I Found The Highest Win Rate 15 Minute Scalping Trading Strategy Ever" strategy from "TradeIQ" who claims to have backtested this manually and achieved 410% profit over 100 trades within 6 months on Natural Gas with 79 Wins / 21 Losses with an astounding 3.96% Max Drawdown.
It was quite challenging emulating the same subjective EMA pullback logic along with the dependent sequencing of events necessary to enter a trade and we might improve on this to make it better in the future. Super kudos to @spdoinkal who helped with this strategy. If you have ideas on how this could be improved on, would love to hear about them.
As is, we were unable to substantiate similar results to what was manually backtested by TradeIQ, we do however see potential here. Given some optimizations and improvements to the the entry logic accommodating for a wider more variable margin after pullbacks reestablish above/below the fast EMA we think the performance of this strategy could certainly be improved upon. So not sure if we have totally myth busted this completely at this point in time.
This strategy uses a combination of 2 open-source public indicators:
3 EMA's (Trading View Internal)
B-Xtrender by Puppytherapy
Three separate (21), (89) and (200) EMA's are used as a means to confirm and keep entry out of ranged markets. When the 3 EMA's are all clumped up together with no distance it's indicative of a flat or ranged market. This is then used in conjunction with B-XTrender as a means to detect the trend direction. B-XTrender which is a trend following indicator originally published in the IFTA Journal by Bharat Jhunjhunwala. It uses both a short and long term lengths along with a compound EMA used as a means to smooth and sample trend direction.
Trading Rules
15 min candles but other lower time-frames
Stop Loss on previous swing high/low
No Take Profit, Exit on new red/green circles from BX-Trender
Long
EMA Green (21) on top, White (89)in middle and red (200) on bottom and there is distance between EMA's need to be spaced, otherwise in a ranged market
Price action must pull back into 89 EMA (White line) either close or touching it.
Once pullback occurs wait for BX Trender to issue a new green circle and BX Trend line must be green and above 0
Price action must also pull up back above the (Green Line) EMA 21
Short
EMA Red (200) on top, White (89) in middle and Green (21) on bottom and there is distance between EMA's need to be spaced, otherwise in a ranged market
Price action must pull back into 89 EMA (White line) either close or touching it.
Once pullback occurs wait for BX Trender to issue a new red circle and BX Trend line must be red and below 0
Price action must also pull up back below the (green Line) EMA 21
If you know of or have a strategy you want to see myth-busted or just have an idea for one, please feel free to message me.

13/21 EMA + Ichimoku Kinko Hyo StrategyThis trading strategy uses combination of the Ichimoku Kinko Hyo system with Fibonacci numbers based 13/21 exponential moving average ( EMA ) crossover, giving excellent results in trending assets !

Setup 9/13 Lite — Exhaustion & Reference LevelsWhat it is
A clean, lightweight tool that implements the classic 1–9 setup progression, to-13 exhaustion signal, and bar-#1 reference levels. Built for clarity with minimal chart clutter.
How it works
Setup (1–9):
• Buy side counts bars where Close < Close .
• Sell side counts bars where Close > Close .
• Counter resets on an opposite condition.
• On completion, a triangle marker appears (Buy 9 below bar, Sell 9 above bar).
Reference levels (from bar #1 of a completed setup):
• After a completed Buy setup, draw a horizontal line from the Low of bar #1.
• After a completed Sell setup, draw a horizontal line from the High of bar #1.
• Lines extend to the right and update on new completed setups.
Exhaustion (…to 13):
• Starts on the bar after a completed 9.
• Buy side: increments when Close ≤ Low (or < if “Strict” is on).
• Sell side: increments when Close ≥ High (or > if “Strict” is on).
• Stops when 13 is reached (single circle marker) or when a new opposite 9 appears.
Strict comparisons:
Toggle between strict (<, >) and non-strict (≤, ≥) rules for both parts.
Header panel:
A compact top-right table shows live Setup and Exhaustion counts.
Inputs
Show Setup (1–9)
Show Exhaustion (to 13)
Show reference levels (from bar #1)
Strict comparisons (< /> instead of ≤ / ≥)
Paint bars during Setup
Paint bars during Exhaustion
(Exhaustion tint overrides Setup tint when both are enabled.)
Visual guide
Green triangle below bar = Buy Setup 9
Red triangle above bar = Sell Setup 9
Green circle below bar = Buy Exhaustion 13
Red circle above bar = Sell Exhaustion 13
Green/Red horizontal line = Reference level from bar #1 of the last completed setup
Alerts
Buy Setup 9 completed
Sell Setup 9 completed
Buy Exhaustion reached 13
Sell Exhaustion reached 13
Tip: for fewer false pings, set alerts to “Once per bar close.”
Notes
Works on any symbol/timeframe; higher liquidity improves readings. These signals indicate potential exhaustion/context, not a standalone trading system—combine with trend filters, S/R, and risk management.
Disclaimer
Educational use only. Not financial advice.

TEMA Ribbon 9/13/15/21 – Smooth trend shifts, less lag, clearer“TEMA Ribbon 9/13/15/21 – Smooth trend shifts, less lag, clearer bias.”
Plots four Triple Exponential Moving Averages (9, 13, 15, 21) with shaded zones for quick trend visualization. Helps identify short- vs. medium-term momentum shifts with reduced lag compared to standard EMAs.
Recommended Usage:
Best applied on 5M–1H intraday charts for momentum and trend confirmation.
Use the 9 & 13 TEMA for short-term momentum shifts.
Use the 15 & 21 TEMA for medium-term bias.
Look for crossovers and alignment (all fast TEMAs above/below slow ones) to confirm bullish or bearish conditions.
Shaded zones help visualize when the short- and medium-term trends converge or diverge, signaling potential entry or exit points.
Combine the TEMA Ribbon with VWAP or session-based trading (e.g., London/New York Killzones) to filter signals.
Trade only in the direction of VWAP bias (price above VWAP → favor longs, below → favor shorts).
Within Killzones, use TEMA alignment (9/13 above 15/21 = bullish trend, or opposite for bearish) as confirmation before entries.
This reduces false signals and locks entries to periods of high liquidity and volatility, where TEMA shines.
//@version=5
indicator("TEMA 9/13/15/21", overlay=true)
// Quelle
src = close
// Funktion: TEMA
tema(src, length) =>
e1 = ta.ema(src, length)
e2 = ta.ema(e1, length)
e3 = ta.ema(e2, length)
3.0 * e1 - 3.0 * e2 + e3
// TEMA-Berechnung
t9 = tema(src, 9)
t13 = tema(src, 13)
t15 = tema(src, 15)
t21 = tema(src, 21)
// Plots
p9 = plot(t9, "TEMA 9", color=color.teal, linewidth=2)
p13 = plot(t13, "TEMA 13", color=color.aqua, linewidth=2)
p15 = plot(t15, "TEMA 15", color=color.orange, linewidth=2)
p21 = plot(t21, "TEMA 21", color=color.fuchsia, linewidth=2)
// Einfaches Fill (zwischen schnellstem und langsamstem)
fill(p9, p21, color=color.new(color.gray, 85))
fill(p13, p15, color=color.new(color.gray, 92))

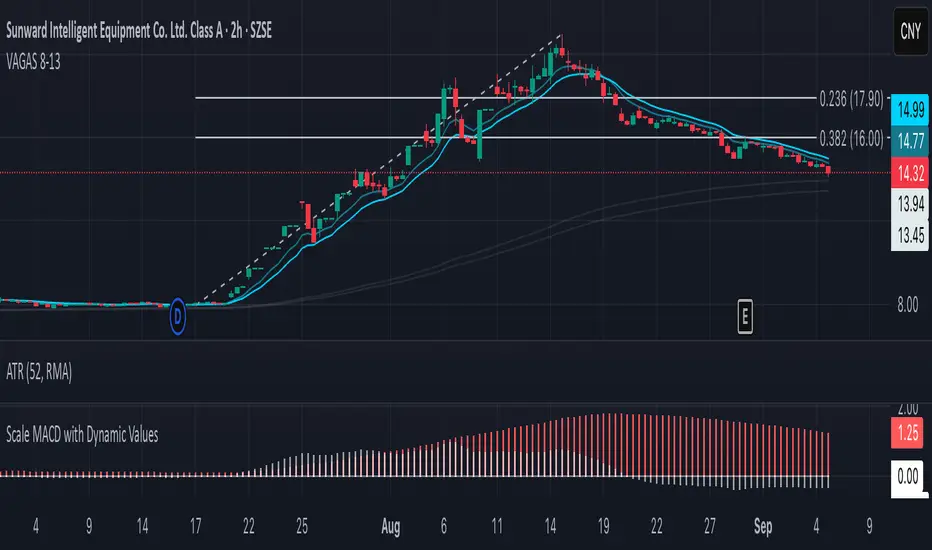
Vagas-dctang(8~13)Overview
The Vegas Tunnel EMA 8-13 is a refined technical analysis indicator that utilizes two key exponential moving averages (8-period and 13-period EMAs) to create a dynamic tunnel system for identifying trend direction and potential support/resistance zones. This indicator is specifically designed to help traders visualize price action within the context of short-term trend dynamics.
Key Features
✅ Dual EMA Tunnel System: Creates a visual tunnel between 8 EMA (fast) and 13 EMA (slow) to identify trend channels ✅ Dynamic Support Detection: The tunnel acts as dynamic support during uptrends and resistance during downtrends ✅ Trend Confirmation: Price position relative to the tunnel helps confirm the current market trend ✅ Entry/Exit Signals: Tunnel crossovers and price interactions provide clear trading signals ✅ Multi-Timeframe Compatible: Works effectively across various timeframes from scalping to swing trading
How It Works
The Vegas Tunnel EMA 8-13 operates on the principle that shorter-period EMAs react more quickly to price changes, creating a responsive tunnel system:
Bullish Tunnel: When 8 EMA > 13 EMA, the tunnel indicates an upward trend with potential support zones
Bearish Tunnel: When 8 EMA < 13 EMA, the tunnel indicates a downward trend with potential resistance zones
Tunnel Width: The distance between EMAs indicates trend strength and volatility
Price Interaction: Bounces off the tunnel boundaries suggest trend continuation, while breaks may signal reversals
Trading Applications
Trend Following: Use tunnel direction to align trades with the prevailing trend
Support/Resistance Trading: Enter long positions when price bounces off tunnel support, short when rejected at resistance
Breakout Strategy: Trade tunnel breaks as potential trend continuation or reversal signals
Risk Management: Use tunnel boundaries as dynamic stop-loss levels
Advantages Over Traditional Moving Averages
Reduced Noise: The tunnel system filters out minor price fluctuations
Visual Clarity: Easy identification of trend channels and key levels
Faster Response: 8-13 period combination provides quicker signals than longer-term systems
Versatile Application: Suitable for various trading styles and market conditions
Best Practices
Combine with volume analysis for stronger signal confirmation
Consider higher timeframe tunnel direction for context
Use proper risk management with position sizing
Backtest on your preferred instruments and timeframes
This indicator is ideal for traders seeking a clean, effective tool for trend analysis and dynamic support/resistance identification in fast-moving markets.
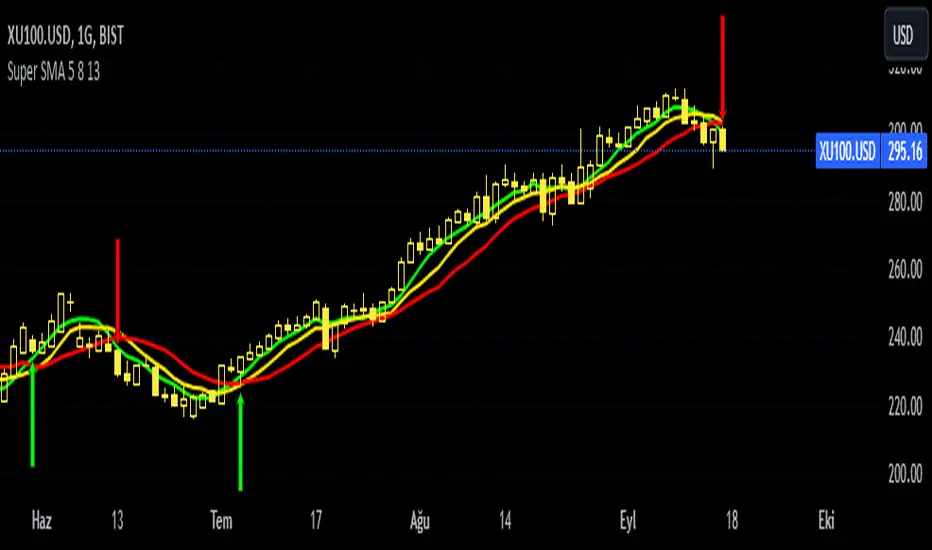
Super SMA 5 8 13This indicator is based on the 5 8 13 simple moving average strategy of strategist Selçuk Gönençler. The indicator shows buy and sell signals when favorable conditions occur.
══ H O W T O U S E ══
Above 5-8-13 - Confirmed hold/buy
5 below (8-13 above) - Be careful, lose weight but don't run away.
Below 5-8 (above 13) - Risk has begun. Don't be stubborn. 13 is your last castle.
5-8-13 below. Don't fight! Wait until it rises above 5-8 again.
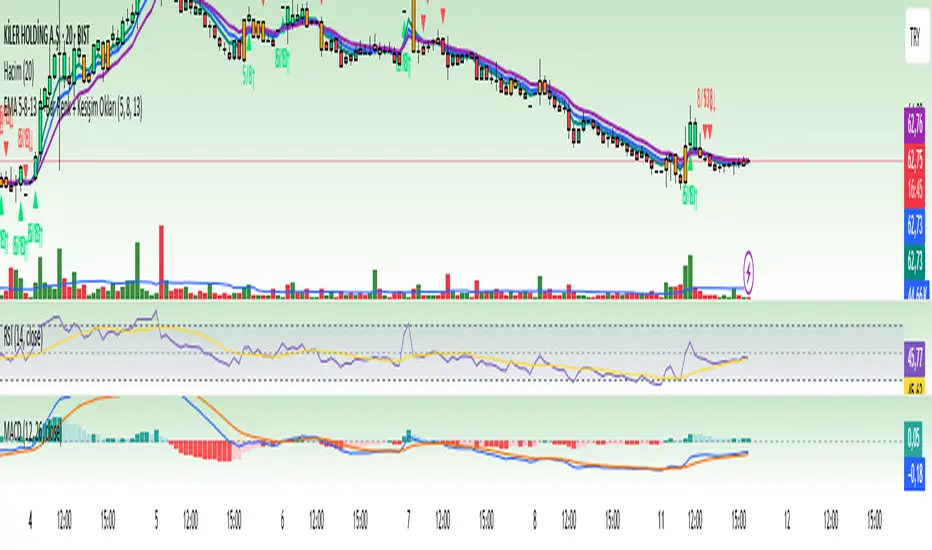
[SM-042] EMA 5-8-13 with ADX FilterWhat is the strategy?
The strategy combines three exponential moving averages (EMAs) — 5, 8, and 13 periods — with an optional ADX (Average Directional Index) filter. It is designed to enter long or short positions based on EMA crossovers and to exit positions when the price crosses a specific EMA. The ADX filter, if enabled, adds a condition that only allows trades when the ADX value is above a certain threshold, indicating trend strength.
Who is it for?
This strategy is for traders leveraging EMAs and trend strength indicators to make trade decisions. It can be used by anyone looking for a simple trend-following strategy, with the flexibility to adjust for trend strength using the ADX filter.
When is it used?
- **Long trades**: When the 5-period EMA crosses above the 8-period EMA, with an optional ADX condition (if enabled) that requires the ADX value to be above a specified threshold.
- **Short trades**: When the 5-period EMA crosses below the 8-period EMA, with the ADX filter again optional.
- **Exits**: The strategy exits a long position when the price falls below the 13-period EMA and exits a short position when the price rises above the 13-period EMA.
Where is it applied?
This strategy is applied on a chart with any asset on TradingView, with the EMAs and ADX plotted for visual reference. The strategy uses `strategy.entry` to open positions and `strategy.close` to close them based on the set conditions.
Why is it useful?
This strategy helps traders identify trending conditions and filter out potential false signals by using both EMAs (to capture short-term price movements) and the ADX (to confirm the strength of the trend). The ADX filter can be turned off if not desired, making the strategy flexible for both trending and range-bound markets.
How does it work?
- **EMA Crossover**: The strategy enters a long position when the 5-period EMA crosses above the 8-period EMA, and enters a short position when the 5-period EMA crosses below the 8-period EMA.
- **ADX Filter**: If enabled, the strategy checks whether the ADX value is above a set threshold (default is 20) before allowing a trade.
- **Exit Conditions**: Long positions are closed when the price falls below the 13-period EMA, and short positions are closed when the price rises above the 13-period EMA.
- **Plotting**: The strategy plots the three EMAs and the ADX value on the chart for visualization. It also displays a horizontal line at the ADX threshold.
This setup allows for clear decision-making based on the interaction between different time-frame EMAs and trend strength as indicated by ADX.

Supertrend, MA 44|6, EMA FIBS 13|21|34I have this indicator based on my strategy. This indicator is based on existing functions available in the system. I haven't added anything new. This indicator uses Supertrend, MA44|6, EMA fibs 13|21|34 combining to find a profitable trade.
- Supertrend : Indicator uses supertrend strategy with default ATR period of 10 and Factor value 3. These values can be customized based on your preferences. Uptrend is denoted by green color and downtrend by red color. You can change the colors based on your preferences.
- MA 44|6: Indicator plots moving averages of 44 and 6. These values can be customized based on your preferences. Although it is highly recommended to keep 44 as is. Value 6 can be adjusted based on your preference. Default color for uptrend is green and for downtrend is red. You can change the colors based on your preferences.
- FIBS EMA 13|21|34: Indicator plots EMA of fibbonacci numbers 13, 21,34 to identify consolidation and breakout. The periods can be adjusted but it is highly recommended not to do so. Default colors for 13,21 and 34 is Aqua, Blue and Navy respectively. You can change the colors based on your preferences.
When to take trade?
To take a trade all conditions needs to be fulfilled.
Supertrend : Always take a trade in the direction of Supertrend. It is always advisable to take trade if the trend is changing or price is taking support of resistance.
MA 44|6: Moving average 44 indicates average price of 44 last candles and 6 for last 6 candles. Price crossing MA 44 indicates change in trend. It is advisable to take trade at crossing the line above or below. If many candles closing near MA 44 then it indicates consolidation. The more far the candle closes from MA44 the better. MA 6 is used to identify when to enter or exit the trade. If candle closes away from MA 6 then you can wait for candle to start near the MA 6 line. If candle closes above/below MA 6 you can exit your trade.
Fibonacci 13|21|34: When all lines are closed it indicates consolidation. When price breakouts to either direction you can take a trade in that direction with following conditions.
Bullish Trade:
When to enter?
If candle closed above MA 44, Supertrend is uptrend and EMA Fibs are moving away and are above MA 44. The price is near to MA 6 line then you can enter into bullish trade. If price is away from MA 6 then you should wait until the price/line comes near to avoid loss.
When to exit?
Price moving in opposite direction:
You should set a stop loss when you enter the trade. The stop loss can be set below the low of the previous candle or any other strategy you have. But it is really important to set the stop loss. If price moves in opposite direction then your stop loss will hit and you will be out of the trade.
Price moving in same direction:
Once you enter the trade you can exit based on two conditions whichever suits you.
1. Exit the trade if candle closes below MA6. The drawback is you may exit too early. You can also adjust the period based on your preferences.
2. Exit the trade if candle closed below low of previous candle. The drawback is you may book less profit but you can capture the movement very well.
Bearish Trade:
When to enter?
If candle closed below MA 44, Supertrend is downtrend and EMA Fibs are moving away and are below MA 44. The price is near to MA 6 line then you can enter into bearish trade. If price is away from MA 6 then you should wait until the price/line comes near to avoid loss.
When to exit?
Price moving in opposite direction:
You should set a stop loss when you enter the trade. The stop loss can be set below the low of the previous candle or any other strategy you have. But it is really important to set the stop loss. If price moves in opposite direction then your stop loss will hit and you will be out of the trade.
Price moving in same direction:
Once you enter the trade you can exit based on two conditions whichever suits you.
1. Exit the trade if candle closes below MA6. The drawback is you may exit too early. You can also adjust the period based on your preferences.
2. Exit the trade if candle closed below low of previous candle. The drawback is you may book less profit but you can capture the movement very well.
When not to take trade?
1. If MA 44 is completely horizontal and EMA Fibs are very close to each other. This indicates that the market is consolidated and if you enter the trade you may hit stop loss very often.
Note: Please note that I am not expert and I don't take any responsibility of your profits or losses. I have created this indicator based on my knowledge and it is for study purpose. Use of this indicator is totally your responsibility. Use all your knowledge and expertise and don't totally depend on the indicator. Don't forget to use stop loss and do money management.
Happy Trading!

Naresh CE with 13 62 crossThank you to Lauris, for sharing knowledge and logic for the EMA cross-over (13/62).
The provided Pine Script is a custom script, which is designed to display Chandelier Exit levels on the price chart and generate buy and sell labels based on specific conditions.
Here's a breakdown of the key components and logic of the Pine Script:
Exponential Moving Averages (EMAs):
ema1: The 13-period Exponential Moving Average (EMA) of the closing price.
ema2: The 62-period Exponential Moving Average (EMA) of the closing price.
EMA Plotting:
The script plots the ema1 (13 EMA) and ema2 (62 EMA) lines on the price chart using the plot() function.
Chandelier Exit Calculation:
The Chandelier Exit values are calculated using the Average True Range (ATR).
The script calculates the atr (Average True Range) using the atr() function with the given length.
longStop is calculated as the highest price of the specified length minus the ATR, and shortStop is calculated as the lowest price plus the ATR.
Directional Indicator (dir):
The dir variable is used to determine the direction of the Chandelier Exit based on the comparison of the current close price with the previous long and short stops.
Buy and Sell Signals:
The script generates buy signals when the Chandelier Exit direction changes from short to long (buySignal).
Similarly, sell signals are generated when the Chandelier Exit direction changes from long to short (sellSignal).
The conditions for buy and sell signals are based on the value of dir and its previous value.
Buy and Sell Labels:
Buy and sell labels are plotted on the chart using plotshape() based on the generated buy and sell signals.
The showLabels input parameter controls whether to display the buy and sell labels.
Highlighting States:
The script fills the chart area with color (green for long, red for short) based on the direction of the Chandelier Exit values.
The highlightState input parameter controls whether to apply this highlighting.
Alerts:
The script includes alert conditions based on the direction change (changeCond), buy signal (buySignal), and sell signal (sellSignal) using the alertcondition() function.
The script aims to help traders identify potential buy and sell signals based on the Chandelier Exit levels derived from the 13 EMA and 62 EMA crossovers. The Chandelier Exit values can serve as dynamic stop-loss levels for long and short positions.

[blackcat] L3 Magic-9/13 with Reversal Points ConfirmationOVERVIEW
The L3 Magic-9/13 with Reversal Points Confirmation indicator is designed to help traders identify potential reversal points in the market using a sequential approach. This indicator adopts the "buy when fearful, sell when greedy" philosophy, focusing on capturing key reversal moments 📉↗️. It plots labels on the chart to indicate these reversal points and uses custom functions to filter occurrences based on specific conditions.
FEATURES
Identifies consecutive price movements to detect potential reversals.
Plots labels for various sequential patterns:
High Sequentials: 5, 6, 7, 8, 9, 12, 13
Low Sequentials: 5, 6, 7, 8, 9, 12, 13
Uses custom functions to count consecutive occurrences and filter conditions.
Provides visual confirmation of reversal points with colored labels 🏷️.
Allows customization of sequence lengths and lookback periods ⚙️.
HOW TO USE
Add the indicator to your TradingView chart by selecting it from the indicators list.
Observe the plotted labels indicating potential reversal zones:
Green labels for buy signals ('B').
Red labels for sell signals ('S').
Customize the sequence lengths and lookback periods as needed in the settings panel.
Combine this indicator with other tools for confirmation before making trading decisions.
LIMITATIONS
The indicator relies heavily on sequential patterns, which might not capture all market nuances.
False signals can occur in ranging or sideways markets 🌪️.
Users should always confirm signals with other forms of analysis.
NOTES
Ensure that you have sufficient historical data available for accurate calculations.
Test the indicator thoroughly on demo accounts before applying it to live trading 🔍.
Understand the concept of buying at bottoms and selling at tops before using this indicator.

MPF EMA Cross Strategy (8~13~21) by Market Pip FactoryThis script is for a complete strategy to win maximum profit on trades whilst keeping losses at a minimum, using sound risk management at no greater than 1.5%
The 3x EMA Strategy uses the following parameters for trade activation and closure.
1/ Daily Time Frame for trend confirmation
2/ 4 Hourly Time Frame for trend confirmation
3/ 1 Hourly Time Frame for trend confirmation AND trade execution
4/ 3x EMAs (Exponential Moving Averages)
* EMA#1 = 8 EMA (Red Color)
* EMA#2 = 13 EMA (Blue Color)
* EMA#3 = 21 EMA (Orange Color)
5/ Fanning of all 3x EMAs and CrossOver/CrossUnder for Trend Confirmation
6/ Price Action touching an 8 EMA for trade activation
7/ Price Action touching a 21 EMA for trade cancellation BEFORE activation
* For LONG trades: 8 EMA would be ABOVE 21 EMA
* For SHORT trades: 8 EMA would be BELOW 21 EMA
* For trade Cancellation, price action would touch the 21 EMA before trade is activated
* For trade Entry, price action would touch 8 EMA
Once trigger parameter is identified, entry is found by:
a) Price action touches 8 EMA (Candle must Close for confirmed Trade preparation)
b) Trade preparation can be cancelled before trade is activated if price action touches 21 EMA
c) Trailing Stop Loss can be used (optional) by counting back 5 candles from current candle
CLOSURE of a Trade is identified by:
e) 8 EMA crossing the 21 EMA, then close trade, no matter LONG or SHORT
f) Trail Stop Loss
IMPORTANT:
g) No more than ONE activated trade per EMA crossover
h) No more than ONE active trade per pair
NOTE: This strategy is to be used in conjunction with Cipher Twister (my other indicator) to reduce trades on
sideways price action and market trends for super high win ratio.
NOTE: Enabling of LONGs and SHORTs Via Cipher Twister is done by using the previous
green or red dot made. Additionally, when the trend changes, so do the dot's validity based
on being above or below the 0 centerline.
----------------------------
Strategy and Bot Logic
----------------------------
.....::: FOR SHORT TRADES ONLY :::.....
The Robot must use the following logic to enable and activate the SHORT trades:
Parameters:
$(crossunder)=8EMA,21EMA=Bearish $(crossover)=8EMA,21EMA=Bullish $entry=SELL STOP ORDER (Short)
$EMA#1 = 8 EMA (Red Color) $EMA#2 = 13 EMA (Blue Color) $EMA#3 = 21 EMA (Orange Color)
Strategy Logic:
1/ Check Daily Time Frame for trend confirmation if:
(look back up to 50 candles - find last cross of EMAs)
$(chart)=daily and trend=$(crossunder) then goto 2/ *Means: crossunder = ema21 > ema8
$(chart)=daily and trend=$(crossover) then stop (No trades) *Means: crossover = ema8 > ema21
NOTE: This function is switchable. 0=off and 1=on(active). Default = 1 (on)
2/ Check 4 Hourly Time Frame for trend confirmation if:
(look back up to 50 candles - find last cross of EMAs)
$(chart)=4H and trend=$(crossunder) then goto 3/ *Means: crossunder = ema21 > ema8
$(chart)=4H and trend=$(crossover) then stop (No trades) *Means: crossover = ema8 > ema21
NOTE: This function is switchable. 0=off and 1=on(active). Default = 1 (on)
3/ 1 Hourly Time Frame for trend confirmation AND trade execution if:
(look back up to 50 candles - find last cross of EMAs)
$(chart)=1H and trend=$(crossunder) then goto 4/ *Means: crossunder = ema21 > ema8
$(chart)=1H and trend=$(crossover) then stop (No trades) *Means: crossover = ema8 > ema21
4/ Trade preparation:
* if Next (subsequent) candle touches 8EMA, then set STOP LOSS and ENTRY
* $stoploss=3 pips ABOVE current candle HIGH
* $entry=3 pips BELOW current candle LOW
5/ Trade waiting (ONLY BEFORE entry is hit and trade activated):
* if price action touches 21 EMA then cancel trade and goto 1/
Note: Once trade is active this function does not apply !
6/ Trade Activation:
* if price activates/hits ENTRY price, then bot activates trade SHORTs market
7/ Optional Trailing stop:
* if active, then trailing stop 3 pips ABOVE previous HIGH of previous 5th candle
or * Move Stop Loss to Break Even after $X number of pips
NOTE: This means count back and apply accordingly to the 5th previous candle from current candle.
NOTE: This function is switchable. 0=off and 1=on(active). Default = 0 (off)
8/ Trade Close ~ Take Profit:
* Only TP when
$(chart)=1H and trend=$(crossover) then close trade ~ Or obviously if Stop Loss is hit if 7/ is activated.
----------END FOR SHORT TRADES LOGIC----------
.....::: FOR LONG TRADES ONLY :::.....
The Robot must use the following logic to enable and activate the LONG trades:
Parameters:
$(crossunder)=8EMA,21EMA=Bearish $(crossover)=8EMA,21EMA=Bullish $entry=BUY STOP ORDER (Long)
$EMA#1 = 8 EMA (Red Color) $EMA#2 = 13 EMA (Blue Color) $EMA#3 = 21 EMA (Orange Color)
Strategy Logic:
1/ Check Daily Time Frame for trend confirmation if:
(look back up to 50 candles - find last cross of EMAs)
$(chart)=daily and trend=$(crossover) then goto 2/ *Means: crossover = ema8 > ema21
$(chart)=daily and trend=$(crossunder) then stop (No trades) *Means: crossunder = ema21 > ema8
NOTE: This function is switchable. 0=off and 1=on(active). Default = 1 (on)
2/ Check 4 Hourly Time Frame for trend confirmation if:
(look back up to 50 candles - find last cross of EMAs)
$(chart)=4H and trend=$(crossover) then goto 3/ *Means: crossover = ema8 > ema21
$(chart)=4H and trend=$(crossunder) then stop (No trades) *Means: crossunder = ema21 > ema8
NOTE: This function is switchable. 0=off and 1=on(active). Default = 1 (on)
3/ 1 Hourly Time Frame for trend confirmation AND trade execution if:
(look back up to 50 candles - find last cross of EMAs)
$(chart)=1H and trend=$(crossover) then goto 4/ *Means: crossover = ema8 > ema21
$(chart)=1H and trend=$(crossunder) then stop (No trades) *Means: crossunder = ema21 > ema8
4/ Trade preparation:
* if Next (subsequent) candle touches 8EMA, then set STOP LOSS and ENTRY
* $stoploss=3 pips BELOW current candle LOW
* $entry=3 pips ABOVE current candle HIGH
5/ Trade waiting (ONLY BEFORE entry is hit and trade activated):
* if price action touches 21 EMA then cancel trade and goto 1/
Note: Once trade is active this function does not apply !
6/ Trade Activation:
* if price activates/hits ENTRY price, then bot activates trade LONGs market
7/ Optional Trailing stop:
* if active, then trailing stop 3 pips BELOW previous LOW of previous 5th candle
or * Move Stop Loss to Break Even after $X number of pips
NOTE: This means count back and apply accordingly to the 5th previous candle from current candle.
NOTE: This function is switchable. 0=off and 1=on(active). Default = 0 (off)
8/ Trade Close ~ Take Profit:
* Only TP when
$(chart)=1H and trend=$(crossunder) then close trade ~ Or obviously if Stop Loss is hit if 7/ is activated.
----------END FOR LONG TRADES LOGIC----------
IMPORTANT:
* If an existing trade is already open for that same pair, & price action touches 8EMA, do NOT open a new trade..
* bot must continuously check if a trade is currently open on the pair that triggers
* New trades are to be only opened if there is no active trade opened on current pair.
* Only 1 trade per pair rule !
* 5 simultaneous open trades (not same pairs) default = 5 but value can be changed accordingly.
* Maximum risk management must not exceed 1.5% on lot size
*** Some features are not yet available autoated, they will be added in due course in subsequent version updates ***

MultipSMMA 5-9-13-21-35-50-100 @trueenight //@version=4
study("MultipSMMA 5-9-13-21-35-50-100", overlay = true)
getSma(src, len) =>
float smma = 0.0000000
// len = input(7, minval=1, title="Length")
// src = input(close, title="Source")
smma := na(smma ) ? sma(src, len) : (smma * (len - 1) + src) / len
//plot(smma, color=color.red)
smma
plot(getSma(close, input(5, "Sma 5 ")),"sma5", color=#ff0000)
plot(getSma(close, input(9, "Sma 9 ")),"sma9", color=#ff4d00)
plot(getSma(close, input(13, "Sma 13 ")),"sma13", color=#ff9800)
// plot(sma18,"sma18", color=color.green)
plot(getSma(close, input(21, "Sma 21 ")),"sma21", color=#c27ba0, linewidth=3)
plot(getSma(close, input(35, "Sma 35 ")),"sma35", color=#00ffff)
plot(getSma(close, input(50, "Sma 50 ")),"sma50", color=#ff00ff, linewidth=3)
plot(getSma(close, input(100, "Sma 100 ")),"sma100", color=color.yellow, linewidth=3)
SMMA 5-13 crossCrossing the Smoothed Moving Averages with settings 5 & 13 give you confident signal for selling or buying.
IMPORTANT: Signal is always late.
SELL : Short SMMA (5) cross the Long SMMA (13) from top
BUY : Short SMMA (5) cross the Long SMMA (13) from down

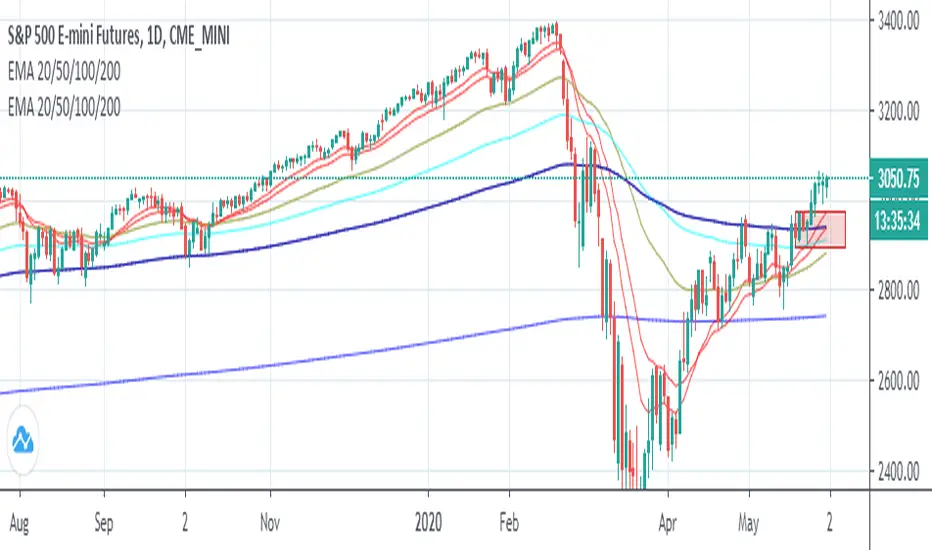
Exponential Moving Average (Set of 3) [Krypt] + 13/34 EMAsI took Krypt's script and essentially added on to it.
the 20/50/100/200 EMAs should be used together as support and resistance as normal.
Wait for price to break 200 EMA
Wait for 50 EMA to cross 200 EMA
Wait for pullback to 50 EMA to open position
20 and 100 EMAs are for extra information about moving support and resistance
and 13/34 EMAs should be used in conjunction
When 13 EMA crosses 34 EMA, open position
When price gets far from 13/34, close position (because price will attempt to revert back to mean)
This is better for scalping and swing trades than the 20/50/100/200 setup.
Twitter: @AzorAhai06

Locked 5m 13 EMA & 15m 20 EMA with Mid EMA & SignalsThis indicator overlays the 5-minute 13 EMA and the 15-minute 20 EMA on any chart timeframe up to 15 minutes, along with a mid EMA (5-minute 36-period) for reference.
Features include:
EMA Cross Detection: Shows bullish and bearish cross arrows when the 5m 13 EMA crosses the 15m 20 EMA.
EMA Fill: Highlights the area between the EMAs in green (bullish) or red (bearish).
Mid EMA Buy/Sell Signals: Generates buy signals when price touches the mid EMA in a bullish stack and sell signals in a bearish stack.
Custom Alerts: Alerts for EMA crosses, EMA stack direction, and mid EMA buy/sell triggers.
Timeframe Safety Warning: Alerts if applied on timeframes higher than 15 minutes.
Ideal For:
Traders who want a locked, non-repainting EMA setup for multi-timeframe analysis and clear entry/exit signals based on mid-range EMA interaction.
Inputs:
Show/Hide arrows for EMA crosses
Show/Hide fill between EMAs
Show/Hide mid EMA line
Show/Hide buy/sell signals
Fill transparency adjustment
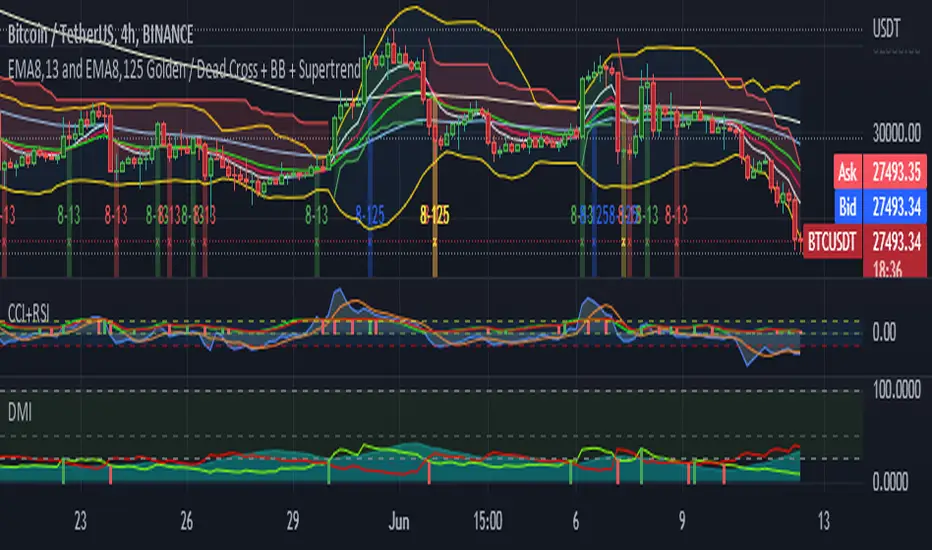
5EMA(8,13,21,55,125) w/ EMA8-13 + EMA8-125 GC/DC Signal-by TerryThis Script are Combined 5 EMAs Indicator with Golden / Death Cross EMA 8 -13 and EMA 8 - 125 within Green or Red Column Line as Default Signal. This Indicator also combined with Ballinger Band and Super Trend Channel.
If you have like this Indicator, please add to your favorite Indicator, and If You Don't, Don't be like a man without woman :) ... God Bless You All
Dorks 13/48 EMA Crossover This is a script that is helpful if you use review dorks (youtube) 13/48 Crossover strategy. According to him when the 13 EMA crosses the 48 EMA it would theoretically be a good entry for options. See the video at review dorks official youtube channel.
I also included the 30 and 200 EMAs as he suggests in the video as points of reference.
There are currently no scrips that provide these 4 specific sets of EMAs in an all in one package.

EMA 13/50/200/800Candle close below the 13 ema or above is entry singal for sell and buy respectively.
After a bounce off the 50,200 and 800 then a confirmation with the 13 ema