XAUUSD Scalper — VolEx + Imbalance (Cleaned)this scalping technique is only applicable for Gold Scalp Trading.
Wyszukaj w skryptach "纳斯达克期货cfd"

Footprint Safe FinalThis script is made for guide purpose only. It has some few important functions that can help you with your trading strategy.

Energy Meter (Candle Range/ATR Ratio)Purpose:
This indicator is a simple, intuitive way to visualize auction energy — the actual force behind a price move — rather than just its appearance on the chart. It’s built on a single idea:
If a bar travels farther than normal in its fixed amount of time, something pushed harder than usual.
That “push” is auction energy, and it’s the raw material of microstructure inference: reading intent and imbalance from nothing more than candles, tempo, and volatility.
Traditional indicators focus on price patterns or volume. This one focuses on pressure — the underlying imbalance driving each bar.
How It Works
Each bar’s True Range is divided by its ATR, producing a normalized ratio:
1.0 = Average energy
>1.2 (default) = Above-normal energy
<1.0 = Quiet, low-pressure bars
This ratio is plotted as a histogram to highlight bursts of force, with a smoothed line added to show the tempo of recent energy changes.
When the histogram spikes, you’re seeing the auction flash its teeth: aggression, initiative, failed absorption, breakout ignition, or the first punch of a reversal.
When the line rolls over, you’re seeing the engine lose torque.
It’s a minimalist tool for seeing who is actually winning the auction, even when price looks deceptively calm.
Why It Matters
Price moves because of imbalance, not geometry. Two candles that look identical can represent completely different internal dynamics.
This indicator helps you see:
Breakout strength vs. fakeouts
Acceleration vs. drift
Exhaustion after extended runs
Reversal attempts with real intent
Quiet absorption before explosive moves
Shifts in aggression hidden inside consolidation
For new traders, it’s a clean introduction to microstructure inference — extracting meaningful order-flow insights without needing L2, DOM, or volume profile.
For experienced traders, it's a compact impulse detector that complements trend, volatility, and liquidity models.
Summary
This is a lightweight, first-principles tool designed to expose the energy signature of the auction: how hard the market is trying to go somewhere.
It doesn’t predict direction — it reveals pressure, so you can judge the quality of the move you’re trading.
Energy beats geometry.
Intent beats patterns.
Microstructure is hiding in every candle; this indicator makes it visible.

AI Candlestick Pattern Identifier — Arrows & AlertsAI shows you high confidence candlestick patterns so that you can identify them quickly. Buy/Sell arrows will be placed alongside the pattern to alert you of which direction the indicator believes the market will go, as well as showing you the confidence in that indicator.

EQT Stochastic RibbonEQT Stochastic Ribbon is a modified Stochastic Oscillator with ribbon fill visualization.
Features:
- Dynamic color ribbon that changes based on trend direction (Blue for bullish, White for bearish)
- Crossover signals with triangle markers when %K crosses %D
- Customizable colors and signal offset
- Dashed lines at 80/20 levels for overbought/oversold zones
How to use:
- Blue ribbon = Bullish momentum (%K above %D)
- White ribbon = Bearish momentum (%K below %D)
- Triangle up = Buy signal (K crosses above D)
- Triangle down = Sell signal (K crosses below D)
Settings:
- K, D, Smooth - Standard Stochastic parameters
- Signal Offset - Distance of signal arrows from the line
- Bullish/Bearish Colors - Customize ribbon and signal colors

Smart Margin Zone
SMART MARGIN ZONE - CME-BASED SUPPORT & RESISTANCE INDICATOR
TITLE FOR PUBLICATION:
Smart Margin Zone - CME Margin-Based Support and Resistance
CATEGORY:
Support and Resistance
SHORT DESCRIPTION (for preview):
Automatically plots margin zones based on CME Group requirements. These zones represent critical price levels where leveraged traders face margin calls, creating natural support and resistance through forced liquidations.
═══════════════════════════════════════════════════════════════
FULL DESCRIPTION FOR TRADINGVIEW:
═══════════════════════════════════════════════════════════════
📊 Smart Margin Zone - Professional Trading Zones Based on CME Data
This indicator automatically calculates and displays margin zones derived from official CME Group margin requirements. These zones represent critical price levels where traders using leverage receive margin calls, triggering forced position closures that create natural support and resistance levels.
═══════════════════════════════════════════════════════════════
🎯 CORE CONCEPT
═══════════════════════════════════════════════════════════════
When price reaches calculated margin zones, traders using 2:1 or 4:1 leverage on CME futures receive margin calls. Brokers automatically liquidate these positions, creating waves of buying or selling pressure that form strong support and resistance levels.
This is not theoretical - it's based on actual margin requirements from CME Group, the world's largest derivatives marketplace.
═══════════════════════════════════════════════════════════════
📐 CALCULATION METHODOLOGY
═══════════════════════════════════════════════════════════════
The indicator uses the following formula to calculate zone sizes:
Zone Size = (Margin Requirement / Tick Value) × Tick Size × 1.10
Where:
• Margin Requirement = Official CME initial margin (updated November 2024)
• Tick Value = Dollar value of minimum price movement
• Tick Size = Minimum price increment
• 1.10 = 10% buffer for realistic zone width
SUPPORTED INSTRUMENTS WITH CME DATA:
Currency Pairs:
• EURUSD: $2,100 margin → 0.0168 zone size
• GBPUSD: $1,800 margin → 0.0144 zone size
• AUDUSD: $1,300 margin → 0.0065 zone size
• NZDUSD: $1,100 margin → 0.0055 zone size
• USDJPY: $3,200 margin → custom calculation
• USDCAD: $950 margin → calculated
• USDCHF: $1,650 margin → calculated
Commodities:
• Gold (XAUUSD): $8,000 margin → 80 points zone size
• Silver (XAGUSD): $6,500 margin → calculated
• WTI Crude Oil: $4,500 margin → calculated
═══════════════════════════════════════════════════════════════
🔍 HOW IT WORKS
═══════════════════════════════════════════════════════════════
1. SWING POINT DETECTION
The indicator automatically identifies swing highs and swing lows using a configurable lookback period (default 10 bars). These become anchor points for zone calculations.
2. FIVE ZONE LEVELS
From each swing point, five zone levels are calculated:
• Zone 1/4 (25%) - First correction level
• Zone 1/2 (50%) - KEY ZONE for trend determination
• Zone 3/4 (75%) - Intermediate level
• Zone 1/1 (100%) - Full margin zone (strongest level)
• Zone 5/4 (125%) - Extended zone
3. TREND IDENTIFICATION
• Close above Zone 1/2 resistance = Bullish trend
• Close below Zone 1/2 support = Bearish trend
• Between zones = Range/consolidation
4. HISTORICAL CONTEXT
Current zones are displayed prominently with fills and labels. Historical zones appear as thin, semi-transparent lines for context without cluttering the chart.
═══════════════════════════════════════════════════════════════
⚙️ FEATURES
═══════════════════════════════════════════════════════════════
AUTOMATED CALCULATION:
✅ Auto-detection of swing highs and lows
✅ Real-time zone updates as new swings form
✅ CME margin data built-in for major instruments
✅ Manual override option for custom calculations
VISUAL CLARITY:
✅ Color-coded zones (red=resistance, green=support)
✅ Adjustable transparency for fills and lines
✅ Current zones bold with fills and price labels
✅ Historical zones thin and transparent
✅ Swing point markers show calculation origins
CUSTOMIZATION:
✅ Show/hide individual zone levels (1/4, 1/2, 3/4, 1/1, 5/4)
✅ Toggle historical zones on/off
✅ Adjustable lookback period (5-50 bars)
✅ Customizable colors for all elements
✅ Line width and transparency controls
✅ Zone extension options (none/right/both)
TREND ANALYSIS:
✅ Optional trend background coloring
✅ Customizable trend colors and transparency
✅ Real-time trend identification display
STATISTICS:
✅ Live statistics table showing:
- Current instrument
- Active zone size
- Calculation mode
- Current trend direction
- Number of zones displayed
ALERTS:
✅ Zone 1/2 breakout (up/down)
✅ Full margin zone 1/1 reached
✅ Customizable alert messages
═══════════════════════════════════════════════════════════════
📈 TRADING APPLICATIONS
═══════════════════════════════════════════════════════════════
ENTRY SIGNALS:
• Bounces from zone levels = potential entry points
• Zone 1/2 breakouts = trend continuation entries
• Zone rejections = reversal opportunities
RISK MANAGEMENT:
• Zone levels = logical stop-loss placement
• Zone 1/1 = maximum risk level
• Zone spacing = position sizing guide
PROFIT TARGETS:
• Next zone level = first target
• Zone 1/1 = full profit target
• Zone breakouts = extended targets
TREND CONFIRMATION:
• Price above Zone 1/2 resistance = confirmed uptrend
• Price below Zone 1/2 support = confirmed downtrend
• Consolidation between zones = wait for breakout
═══════════════════════════════════════════════════════════════
📚 USAGE INSTRUCTIONS
═══════════════════════════════════════════════════════════════
GETTING STARTED:
1. Add indicator to chart of any supported instrument
2. Zones automatically calculate and display
3. Adjust swing detection period if needed (default 10 works well)
4. Customize colors and visibility to your preference
OPTIMAL SETTINGS:
• Best timeframes: H1, H4, Daily, Weekly
• Default swing length (10) suitable for most markets
• Show 2-3 historical zones for context
• Enable swing point markers to see calculation origins
INTERPRETATION:
• Watch for price reactions at zone boundaries
• Strong bounces = respect for margin level
• Clean breaks = momentum continuation
• Multiple touches = zone strength confirmation
SET ALERTS:
• Zone 1/2 breakouts for trend entries
• Zone 1/1 reaches for profit-taking
• Custom alerts for your specific strategy
═══════════════════════════════════════════════════════════════
⚠️ IMPORTANT NOTES
═══════════════════════════════════════════════════════════════
DATA ACCURACY:
• CME margin requirements updated November 2024
• Margins change periodically - check CME Group website
• Manual mode available for latest margin data
• Indicator provides analysis tool, not financial advice
STATISTICAL PERFORMANCE:
• Historical data shows >60% probability of continued movement after Zone 1/2 breakout
• Zone effectiveness varies by market conditions
• Best results in trending markets with clear swings
LIMITATIONS:
• Margin requirements change - monitor CME updates
• Works best on liquid instruments with clear swings
• Not a standalone trading system
• Should be combined with additional analysis
═══════════════════════════════════════════════════════════════
🔧 METHODOLOGY CREDIT
═══════════════════════════════════════════════════════════════
This indicator is based on the margin zones concept developed by Alexander Bazylev (BTrade indicator for MetaTrader platforms).
The TradingView implementation has been completely rewritten with original enhancements:
• Multiple zone levels instead of single level
• Automatic swing point detection algorithm
• Direct CME data integration
• Historical zone visualization
• Advanced customization options
• Comprehensive statistics and alerts
All code is original and specifically designed for TradingView's Pine Script v5 environment.
═══════════════════════════════════════════════════════════════
💡 BEST PRACTICES
═══════════════════════════════════════════════════════════════
COMBINE WITH:
• Volume analysis for confirmation
• Trend indicators for direction bias
• Price action patterns at zones
• Higher timeframe analysis
AVOID:
• Trading against strong trends at minor zones
• Over-leveraging based solely on zone placement
• Ignoring broader market context
• Expecting perfect bounces every time
OPTIMIZE:
• Adjust swing length for different timeframes
• Shorter period (5-7) for intraday trading
• Longer period (15-20) for swing trading
• Test historical effectiveness on your instruments
═══════════════════════════════════════════════════════════════
📖 EDUCATIONAL VALUE
═══════════════════════════════════════════════════════════════
This indicator helps traders understand:
• How institutional margin requirements affect price
• Where forced liquidations create pressure
• Natural support and resistance formation
• Relationship between leverage and price levels
• Market structure and key technical levels
═══════════════════════════════════════════════════════════════
🔄 VERSION HISTORY
═══════════════════════════════════════════════════════════════
Version 1.0 (Initial Release):
• CME-based zone calculation for 10 instruments
• Automatic swing high/low detection
• 5 zone levels with customizable display
• Historical zones with transparency control
• Swing point markers
• Trend background indicator
• Live statistics table
• Multiple alert conditions
• Fully customizable colors and styles
• English language interface
═══════════════════════════════════════════════════════════════
📞 SUPPORT & FEEDBACK
═══════════════════════════════════════════════════════════════
Questions or suggestions? Leave a comment below!
If you find this indicator useful:
⭐ Please leave a like
💬 Share your experience in comments
🔔 Follow for updates and new indicators
═══════════════════════════════════════════════════════════════
⚖️ DISCLAIMER
═══════════════════════════════════════════════════════════════
This indicator is provided for educational and analytical purposes only. It is not financial advice and should not be the sole basis for trading decisions.
• Past performance does not guarantee future results
• Trading involves substantial risk of loss
• CME margin requirements subject to change
• Always do your own research and risk management
• Consult a financial advisor for investment advice
The creator is not responsible for any trading losses incurred through use of this indicator.

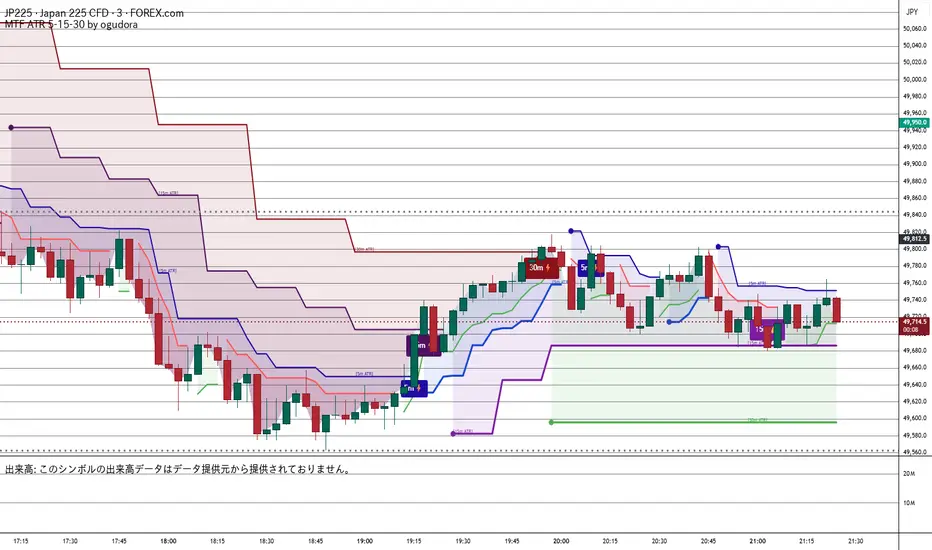
Multitime ATR (5m/15m/30m)Special thanks to Ogura
“This indicator displays ATR values for timeframes shorter than 30 minutes.”
“An ATR indicator designed to visualize volatility across 5-minute, 15-minute, and 30-minute timeframes.”
30分未満のATRを表示するインジケーターです。おぐさんありがとう。
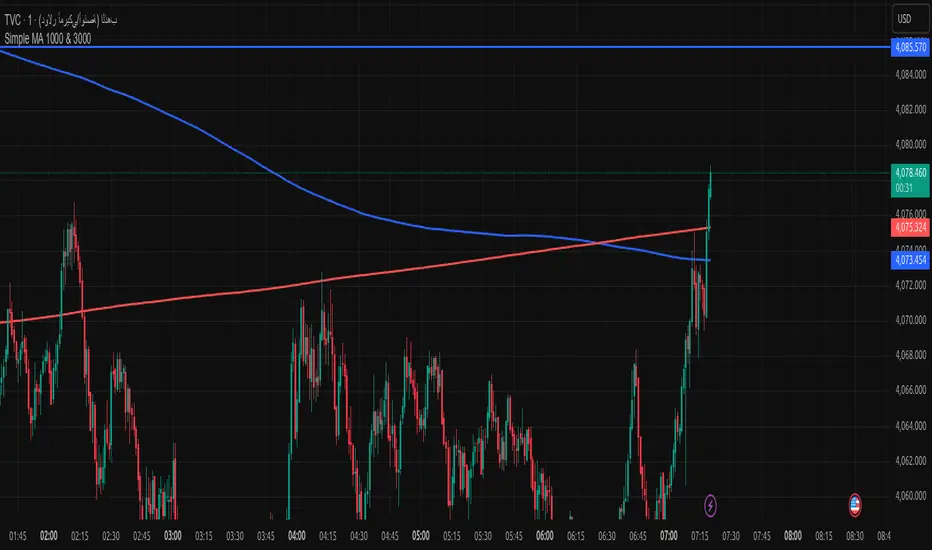
Simple MA 1000 & 3000when toche moving address add buy if from high or sell if from donw with sl 20pip
DANGHIEU EMA 34/89/200 Ribbon (Scaled HTF)📘 Indicator Description – EMA 34/89/200 Ribbon (Scaled HTF)
The EMA 34/89/200 Ribbon (Scaled HTF) indicator is designed to replicate higher-timeframe EMAs directly on your current chart without switching timeframes.
Using a precise HTF Scaling Algorithm, the script converts EMAs from 1H, 2H, 4H, 6H, 12H, 1D, and even 1W into equivalent lengths on lower timeframes—allowing traders to perform true multi-timeframe trend analysis on a single chart.
The 34-EMA and 89-EMA form a dynamic trend ribbon that changes color based on the relationship between the two moving averages. This helps traders quickly identify trend direction, momentum strength, and potential market reversals. The indicator also includes optional crossover markers (X symbols) to highlight bullish and bearish crossovers for cleaner signal recognition. EMA200 is included as the long-term trend anchor.
This tool is ideal for scalpers, day traders, and swing traders who require higher-timeframe context while trading lower-timeframe entries.
🟦 How to Use the Indicator
1. Choose the Higher Timeframe to Simulate
Use the “HTF to Simulate” dropdown to select the timeframe you want to emulate (e.g., 4H, 2H, 1D, 1W).
The script automatically scales the EMA lengths so they match the selected HTF.
2. Read the Ribbon for Trend Direction
Green Ribbon → EMA34 above EMA89 → Bullish momentum
Red Ribbon → EMA34 below EMA89 → Bearish momentum
The ribbon expands when momentum strengthens and contracts during consolidation.
3. Use EMA Crossovers as Signal Zones
Optional X markers highlight crossover points:
Bullish Crossover → EMA34 crosses above EMA89
Bearish Crossover → EMA34 crosses below EMA89
These crossovers often align with trend shifts or early momentum changes.
4. EMA200 as Trend Filter
The EMA200 acts as the macro trend filter:
Price above EMA200 → only consider long setups
Price below EMA200 → only consider short setups
Combining ribbon trend + EMA200 alignment improves signal accuracy.
5. Multi-Timeframe Trading Strategy
This indicator is powerful for:
Scalping with HTF bias
Pullback entry on lower timeframe during HTF trend
Identifying trend exhaustion when the ribbon flips
Confirming wave structure (Elliott Wave, Dow Theory)
Spotting strong momentum phases and squeeze zones
Example workflow:
Select 4H as HTF simulation.
Trade on 15m or 5m chart.
Enter only when price aligns with the HTF ribbon + EMA200 trend.
Use EMA crossovers as confirmation signals.

Multi-Timeframe Stochastic (4x) z Podświetlaniem - PawelA script that provides information when most of the stocks are in the overbought or oversold zone.

Multi-Timeframe RSI (4x) z Podświetlaniem - PawełRSI z podświetleniem z różnych tfów z ustawianiem intensywnosci i kolorów.

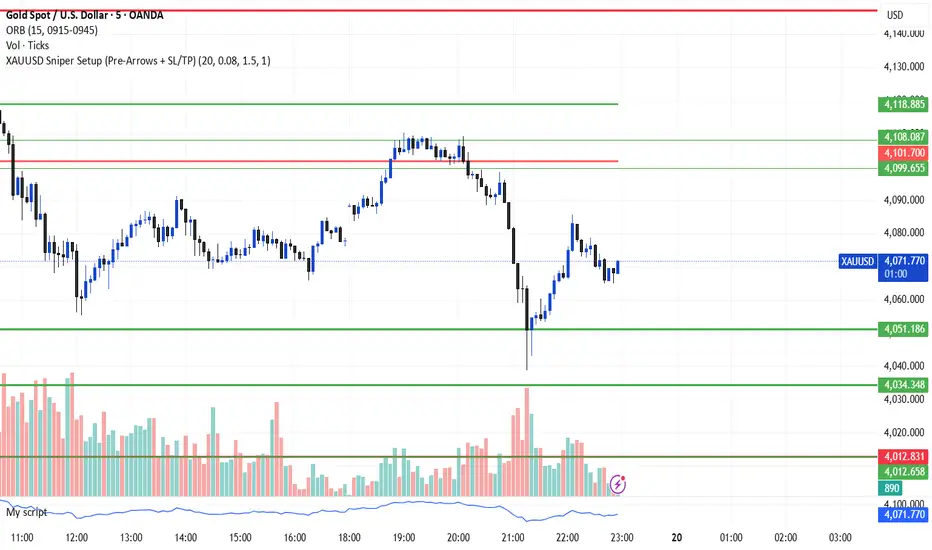
XAUUSD Sniper Setup (Pre-Arrows + SL/TP)//@version=5
indicator("XAUUSD Sniper Setup (Pre-Arrows + SL/TP)", overlay=true)
// === Inputs ===
rangePeriod = input.int(20, "Lookback Bars for Zone", minval=5)
maxRangePercent = input.float(0.08, "Max Range % for Consolidation", step=0.01)
tpMultiplier = input.float(1.5, "TP Multiplier")
slMultiplier = input.float(1.0, "SL Multiplier")
// === Consolidation Detection ===
highestPrice = ta.highest(high, rangePeriod)
lowestPrice = ta.lowest(low, rangePeriod)
priceRange = highestPrice - lowestPrice
percentRange = (priceRange / close) * 100
isConsolidation = percentRange < maxRangePercent
// === Zones ===
demandZone = lowestPrice
supplyZone = highestPrice
// === Plot Consolidation Zone Background ===
bgcolor(isConsolidation ? color.new(color.gray, 85) : na)
// === Plot Potential Buy/Sell Levels ===
plot(isConsolidation ? demandZone : na, color=color.green, title="Potential Buy Level", linewidth=2)
plot(isConsolidation ? supplyZone : na, color=color.red, title="Potential Sell Level", linewidth=2)
// === Liquidity Sweep ===
liquidityTakenBelow = low < demandZone
liquidityTakenAbove = high > supplyZone
// === Engulfing Candles ===
bullishEngulfing = close > open and close < open and close > open
bearishEngulfing = close < open and close > open and close < open
// === Break of Structure ===
bosUp = high > ta.highest(high , 5)
bosDown = low < ta.lowest(low , 5)
// === Sniper Entry Conditions ===
buySignal = isConsolidation and liquidityTakenBelow and bullishEngulfing and bosUp
sellSignal = isConsolidation and liquidityTakenAbove and bearishEngulfing and bosDown
// === SL & TP Levels ===
slBuy = demandZone - (priceRange * slMultiplier)
tpBuy = close + (priceRange * tpMultiplier)
slSell = supplyZone + (priceRange * slMultiplier)
tpSell = close - (priceRange * tpMultiplier)
// === PRE-ARROWS (Show Before Breakout) ===
preBuyArrow = isConsolidation ? 1 : na
preSellArrow = isConsolidation ? -1 : na
plotarrow(preBuyArrow, colorup=color.new(color.green, 50), maxheight=20, minheight=20, title="Pre-Buy Arrow")
plotarrow(preSellArrow, colordown=color.new(color.red, 50), maxheight=20, minheight=20, title="Pre-Sell Arrow")
// === SNIPER CONFIRMATION ARROWS ===
buyArrow = buySignal ? 1 : na
sellArrow = sellSignal ? -1 : na
plotarrow(buyArrow, colorup=color.green, maxheight=60, minheight=60, title="Sniper BUY Arrow")
plotarrow(sellArrow, colordown=color.red, maxheight=60, minheight=60, title="Sniper SELL Arrow")
// === BUY SIGNAL ===
if buySignal
label.new(bar_index, low, "BUY\nSL/TP Added", style=label.style_label_up, color=color.green, textcolor=color.white)
line.new(bar_index, slBuy, bar_index + 5, slBuy, color=color.red, style=line.style_dotted)
line.new(bar_index, tpBuy, bar_index + 5, tpBuy, color=color.green, style=line.style_dotted)
label.new(bar_index, slBuy, "SL", color=color.red, style=label.style_label_down)
label.new(bar_index, tpBuy, "TP", color=color.green, style=label.style_label_up)
// === SELL SIGNAL ===
if sellSignal
label.new(bar_index, high, "SELL\nSL/TP Added", style=label.style_label_down, color=color.red, textcolor=color.white)
line.new(bar_index, slSell, bar_index + 5, slSell, color=color.red, style=line.style_dotted)
line.new(bar_index, tpSell, bar_index + 5, tpSell, color=color.green, style=line.style_dotted)
label.new(bar_index, slSell, "SL", color=color.red, style=label.style_label_up)
label.new(bar_index, tpSell, "TP", color=color.green, style=label.style_label_down)
// === Alerts ===
alertcondition(buySignal, title="Sniper BUY", message="Sniper BUY setup on XAUUSD")
alertcondition(sellSignal, title="Sniper SELL", message="Sniper SELL setup on XAUUSD")
OANDA:XAUUSD
FxAST Ichi ProSeries Enhanced Full Market Regime EngineFxAST Ichi ProSeries v1.x is a modernized Ichimoku engine that keeps the classic logic but adds a full market regime engine for any market and instrument.”
Multi-timeframe cloud overlay
Oracle long-term baseline
Trend regime classifier (Bull / Bear / Transition / Range)
Chikou & Cloud breakout signals
HTF + Oracle + Trend dashboard
Alert-ready structure for automation
No repainting: all HTF calls use lookahead_off.
1. Core Ichimoku Engine
Code sections:
Input group: Core Ichimoku
Function: ichiCalc()
Variables: tenkan, kijun, spanA, spanB, chikou
What it does
Calculates the classic Ichimoku components:
Tenkan (Conversion Line) – fast Donchian average (convLen)
Kijun (Base Line) – slower Donchian average (baseLen)
Senkou Span A (Span A / Lead1) – (Tenkan + Kijun)/2
Senkou Span B (Span B / Lead2) – Donchian over spanBLen
Chikou – current close shifted back in time (displace)
Everything else in the indicator builds on this engine.
How to use it (trading)
Tenkan vs Kijun = short-term vs medium-term balance.
Tenkan above Kijun = short-term bullish control; below = bearish control.
Span A / B defines the cloud, which represents equilibrium and support/resistance.
Price above cloud = bullish bias; price below cloud = bearish bias.
Graphic
2. Display & Cloud Styling
Code sections:
Input groups: Display Options, Cloud Styling, Lagging Span & Signals
Variables: showTenkan, showKijun, showChikou, showCloud, bullCloudColor, bearCloudColor, cloudLineWidth, laggingColor
Plots: plot(tenkan), plot(kijun), plot(chikou), p1, p2, fill(p1, p2, ...)
What it does
Lets you toggle individual components:
Show/hide Tenkan, Kijun, Chikou, and the cloud.
Customize cloud colors & opacity:
bullCloudColor when Span A > Span B
bearCloudColor when Span A < Span B
Adjust cloud line width for clarity.
How to use it
Turn off components you don’t use (e.g., hide Chikou if you only want cloud + Tenkan/Kijun).
For higher-timeframe or noisy charts, use thicker Kijun & cloud so structure is easier to see.
Graphic
Before
After
3. HTF Cloud Overlay (Multi-Timeframe)
Code sections:
Input group: HTF Cloud Overlay
Vars: showHTFCloud, htfTf, htfAlpha
Logic: request.security(..., ichiCalc(...)) → htfSpanA, htfSpanB
Plots: pHTF1, pHTF2, fill(pHTF1, pHTF2, ...)
What it does
Pulls higher-timeframe Ichimoku cloud (e.g., 1H, 4H, Daily) onto your current chart.
Uses the same Ichimoku settings but aggregates on htfTf.
Plots an extra, semi-transparent cloud ahead of price:
Greenish when HTF Span A > Span B
Reddish when HTF Span B > Span A
How to use it
Trade LTF (e.g., 5m/15m) only in alignment with HTF trend:
HTF cloud bullish + LTF Ichi bullish → look for longs
HTF cloud bearish + LTF Ichi bearish → look for shorts
Treat HTF cloud boundaries as major S/R zones.
Graphic
4. Oracle Module
Code sections:
Input group: Oracle Module
Vars: useOracle, oracleLen, oracleColor, oracleWidth, oracleSlopeLen
Logic: oracleLine = donchian(oracleLen); slope check vs oracleLine
Plot: plot(useOracle ? oracleLine : na, "Oracle", ...)
What it does
Creates a long-term Donchian baseline (default 208 bars).
Uses a simple slope check:
Current Oracle > Oracle oracleSlopeLen bars ago → Oracle Bull
Current Oracle < Oracle oracleSlopeLen bars ago → Oracle Bear
Slope state is also shown in the dashboard (“Bull / Bear / Flat”).
How to use it
Think of Oracle as your macro anchor :
Only take longs when Oracle is sloping up or flat.
Only take shorts when Oracle is sloping down or flat.
Works well combined with HTF cloud:
HTF cloud bullish + Oracle Bull = higher conviction long bias.
Ideal for Gold / Indices swing trades as a trend filter.
Graphic idea
5. Trend Regime Classifier
Code sections:
Input group: Trend Regime Logic
Vars: useTrendRegime, bgTrendOpacity, minTrendScore
Logic:
priceAboveCloud, priceBelowCloud, priceInsideCloud
Tenkan vs Kijun alignment
Cloud bullish/bearish
bullScore / bearScore (0–3)
regime + regimeLabel + regimeColor
Visuals: bgcolor(regimeColor) and optional barcolor() in priceColoring mode.
What it does
Scores the market in three dimensions :
Price vs Cloud
Tenkan vs Kijun
Cloud Direction (Span A vs Span B)
Each condition contributes +1 to either bullScore or bearScore .
Then:
Bull regime when:
bullScore >= minTrendScore and bullScore > bearScore
Price in cloud → “Range”
Everything else → “Transition”
These regimes are shown as:
Background colors:
Teal = Bull
Maroon = Bear
Orange = Range
Silver = Transition
Optional candle recoloring when priceColoring = true.
How to use it
Filters:
Only buy when regime = Bull or Transition and Oracle/HTF agree.
Only sell when regime = Bear or Transition and Oracle/HTF agree.
No trade zone:
When regime = Range (price inside cloud), avoid new entries; wait for break.
Aggressiveness:
Adjust minTrendScore to be stricter (3) or looser (1).
Graphic
6. Signals: Chikou & Cloud Breakout
Code sections :
Logic:
chikouBuySignal = ta.crossover(chikou, close)
chikouSellSignal = ta.crossunder(chikou, close)
cloudBreakUp = priceInsideCloud and priceAboveCloud
cloudBreakDown = priceInsideCloud and priceBelowCloud
What it does
1. Two key signal groups:
Chikou Cross Signals
Buy when Chikou crosses up through price.
Sell when Chikou crosses down through price.
Classic Ichi confirmation idea: Chikou breaking free of price cluster.
2. Cloud Breakout Signals
Long trigger: yesterday inside cloud → today price breaks above cloud.
Short trigger: yesterday inside cloud → today price breaks below cloud.
Captures “equilibrium → expansion” moves.
These are conditions only in this version (no chart shapes yet) but are fully wired for alerts. (Future Updates)
How to use it
Use Chikou signals as confirmation, not standalone entries:
Eg., Bull regime + Oracle Bull + cloud breakout + Chikou Buy.
Use Cloud Breakouts to catch the first impulsive leg after consolidation.
Graphic
7. Alerts (Automation Ready)
[
b]Code sections:
Input group: Alerts
Vars: useAlertTrend, useAlertChikou, useAlertCloudBO
Alert lines like: "FxAST Ichi Bull Trend", "FxAST Ichi Bull Trend", "FxAST Ichi Cloud Break Up"
What it does
Provides ready-made alert hooks for:
Trend regime (Bull / Bear)
Chikou cross buy/sell
Cloud breakout up/down
Each type can be globally toggled on/off via the inputs (helpful if a user only wants one kind).
How to use it
In TradingView: set alerts using “Any alert() function call” on this indicator.
Then filter which ones fire by:
Turning specific alert toggles on/off in input panel, or
Filtering text in your external bot / webhook side.
Example simple workflow ---> Indicator ---> TV Alert ---> Webhook ---> Bot/Broker
8. FxAST Dashboard
Code sections:
Input group: Dashboard
Vars: showDashboard, dashPos, dash, dashInit
Helper: getDashPos() → position.*
Table cells (updated on barstate.islast):
Row 0: Regime + label
Row 1: Oracle status (Bull / Bear / Flat / Off)
Row 2: HTF Cloud (On + TF / Off)
Row 3: Scores (BullScore / BearScore)
What it does
Displays a compact panel with the state of the whole system :
Current Trend Regime (Bull / Bear / Transition / Range)
Oracle slope state
Whether HTF Cloud is active + which timeframe
Raw Bull / Bear scores (0–3 each)
Position can be set: Top Right, Top Left, Bottom Right, Bottom Left.
How to use it
Treat it like a pilot instrument cluster :
Quick glance: “Are my trend, oracle and HTF all aligned?”
Great for streaming / screenshots: everything important is visible in one place without reading the code.
Graphic (lower right of chart )

Trend Following Volatility Trail*Script was previously removed by Moderators at 1.8k boosts* - This was out of my control. This script was very popular and seemed to help a lot of traders. I am re uploading to help the community!
Trend Following Volatility Trail
The Trend Following Volatility Trail is a dynamic trend-following tool that adapts its stop, bias, and zones to real-time volatility and trend strength. Instead of using static ATR multiples like a normal Supertrend or Chandelier Stop, it continuously adjusts itself based on how stretched the market is and how persistent the trend has been. This indicator is based on volatility weighted EMAC
This makes the system far more reactive during momentum phases and more conservative during consolidation, helping avoid fake flips and late entries.
How It Works
The indicator builds an adaptive trail around a smoothed price basis:
– It starts with a short EMA as the “core trend line.”
– It measures volatility expansion versus normal volatility.
– It measures trend persistence by reading whether price has been rising or falling consistently.
– These two components combine to adjust the ATR multiplier dynamically.
As volatility expands or the trend becomes more persistent, the bands widen.
When volatility compresses or the trend weakens, the bands tighten.
These adaptive bands form the foundation of the trailing system.
Bull & Bear State Logic
The tool constantly tracks whether price is above or below the adaptive trail:
Price above the upper trail → Bullish regime
Price below the lower trail → Bearish regime
But instead of flipping immediately, it waits for confirmation bars to avoid noise.
This greatly reduces whipsaws and keeps the focus on sustained moves.
Once a new regime is confirmed:
– A coloured cloud appears (bull or bear)
– A label marks the flip point
– Alerts can be triggered automatically
Best Uses
Identifying regime shifts early
Riding sustained trends with confidence
Avoiding choppy markets by requiring confirmation
Using the adaptive cloud as a directional bias layer

Dresteghamat-Multi timeframe Regime & Exhaustion**Dresteghamat-Multi timeframe Regime & Exhaustion**
This script is a custom decision-support dashboard that aggregates volatility, momentum, and structural data across multiple timeframes to filter market noise. It addresses the problem of "Analysis Paralysis" by automating the correlation between lower timeframe momentum and higher timeframe structure using a weighted scoring algorithm.
### 🔧 Methodology & Calculation Logic
The core engine does not simply overlay indicators; it normalizes their outputs into a unified score (-100 to +100). The logic is hidden (Protected) to preserve the proprietary weighting algorithm, but the underlying concepts are as follows:
**1. Adaptive Timeframe Selection (Context Engine)**
Instead of static monitoring, the script detects the user's current chart timeframe (`timeframe.multiplier`) and dynamically assigns two relevant Higher Timeframes (HTF) as anchors.
* *Logic:* If Current TF < 5min, the script analyzes 15m and 1H data. If Current TF < 1H, it shifts to 4H and Daily data. This ensures the analysis is contextually relevant.
**2. Regime & Volatility Filter (ATR Based)**
We use the Average True Range (ATR) to determine the market regime (Trend vs. Range).
* **Calculation:** We compare the current Swing Range (High-Low lookback) against a smoothed ATR. A high Ratio (> 2.0) indicates a Trend Regime, activating Trend-Following logic. A low ratio dampens the signals.
**3. Directional Bias (Structure + Flow)**
Direction is not determined by a single crossover. It is a fusion of:
* **Swing Structure:** Using `ta.pivothigh/low` to identify Higher Highs/Lower Lows.
* **Volume Flow:** Calculating the cumulative delta of candle bodies over a lookback period.
* **Micro-Bias:** A short-term (default 5-bar) momentum filter to detect immediate order flow changes.
**4. Exhaustion Logic (Mean Reversion Warning)**
To prevent buying at tops, the script calculates an "Exhaustion Score" based on:
* **RSI Divergence:** Detecting discrepancies between price peaks and momentum.
* **Volatility Extension:** Identifying when price has deviated significantly from its volatility mean (VRSD logic).
* **Volume Anomalies:** Detecting low volume on new highs (Supply absorption).
### 📊 How to Read the Dashboard
The table displays the raw status of each timeframe. The **"MODE"** row is the output of the algorithmic decision tree:
* **BUY/SELL ONLY:** Generated when the Current TF momentum aligns with the dynamically selected HTF structure AND the Exhaustion Score is below the threshold (default 70).
* **PULLBACK:** Triggered when the HTF Structure is bullish, but Current Momentum is bearish (indicating a corrective phase).
* **HTF EXHAUST:** A safety warning triggered when the HTF Volatility or RSI metrics hit extreme levels, overriding any entry signals.
* **WAIT:** Default state when volatility is low (Range Regime) or signals conflict.
### ⚠️ Disclaimer
This tool provides algorithmic analysis based on historical price action and volatility metrics. It does not guarantee future results.

Advanced Linear Regression Pro [PointAlgo]Advanced Linear Regression Pro is an open-source tool designed to visualize market structure using linear regression, volatility bands, and optional volume-weighted calculations.
The indicator expands the concept of regression channels by adding higher-timeframe confluence, slope analysis, imbalance detection, and breakout highlighting.
Key Features
• Volume-Weighted Regression
Weights the regression curve based on volume to highlight periods of strong participation.
• Dynamic Standard-Deviation Bands
Upper and lower bands are derived from volatility to help visualize potential expansion or contraction zones.
• Multi-Timeframe (MTF) Regression
Plots higher-timeframe regression lines and bands for additional trend context.
• Slope Strength Analysis
Helps identify whether the current regression slope is trending upward, downward, or in a neutral range.
• Order Flow Imbalance Detection
Highlights bars where price and volume move unusually fast, which may indicate liquidity voids or imbalance zones.
• Breakout Markers
Shows simple visual markers when the price closes beyond volatility bands with volume confirmation.
These are visual signals only, not trading signals.
How to Use
This indicator is meant for visual market analysis, such as:
Observing trend direction through regression slope
Spotting volatility expansions
Comparing price against higher-timeframe regression structure
Identifying areas where price moves rapidly with volume
It can be used on any market or timeframe.
No part of this script is intended as financial advice or a complete trading system.

Forex Session TrackerForex Session Tracker - Professional Trading Session Indicator
The Forex Session Tracker is a comprehensive and visually intuitive indicator designed specifically for forex traders who need precise tracking of major global trading sessions. This powerful tool helps traders identify active market sessions, monitor session-specific price ranges, and capitalize on volatility patterns unique to each trading period.
Understanding when major financial centers are active is crucial for forex trading success. This indicator provides real-time visualization of the Tokyo, London, New York, and Sydney trading sessions, allowing traders to align their strategies with peak liquidity periods and avoid low-volatility trading windows.
---
Key Features
📊 Four Major Global Trading Sessions
The indicator tracks all four primary forex trading sessions with precision:
- Tokyo Session (Asian Market) - Captures the Asian trading hours, ideal for JPY, AUD, and NZD pairs
- London Session (European Market) - Monitors the most liquid trading period, perfect for EUR, GBP pairs
- New York Session (American Market) - Tracks US market hours, essential for USD-based currency pairs
- Sydney Session (Pacific Market) - Identifies the opening of the trading week and AUD/NZD activity
Each session is fully customizable with individual color schemes, making it easy to distinguish between different market periods at a glance.
🎯 Session Range Visualization
For each active trading session, the indicator automatically:
- Draws rectangular boxes that highlight the session's time period
- Tracks and displays session HIGH and LOW price levels in real-time
- Creates horizontal lines at session extremes for easy reference
- Positions session labels at the center of each trading period
- Updates dynamically as new highs or lows are formed within the session
This visual approach helps traders quickly identify:
- Session breakout opportunities
- Support and resistance zones formed during specific sessions
- Range-bound vs. trending session behavior
- Key price levels that institutional traders are watching
📱 Live Information Dashboard
A sleek, professional information panel displays:
- Real-time session status - Instantly see which sessions are currently active
- Color-coded indicators - Green dots for active sessions, gray for closed sessions
- Timezone information - Confirms your current timezone settings
- Customizable positioning - Place the dashboard anywhere on your chart (Top Left, Top Right, Bottom Left, Bottom Right)
- Adjustable size - Choose from Tiny, Small, Normal, or Large text sizes for optimal visibility
The dashboard provides at-a-glance awareness of market conditions without cluttering your chart analysis.
⚙️ Extensive Customization Options
Every aspect of the indicator can be tailored to your trading preferences:
Session-Specific Controls:
- Enable/disable individual sessions
- Customize colors for each trading period
- Adjust session times to match your broker's server time
- Toggle background highlighting on/off
- Show/hide session high/low lines independently
General Settings:
- UTC Offset Control - Adjust timezone from UTC-12 to UTC+14
- Exchange Timezone Option - Automatically use your chart's exchange timezone
- Background Transparency - Fine-tune the opacity of session highlighting (0-100%)
- Session Labels - Show or hide session name labels
- Information Panel - Toggle the live status dashboard on/off
Style Settings:
- Turn session backgrounds ON/OFF directly from the Style tab
- Maintain clean charts while keeping all analytical features active
🔔 Built-in Alert System
Stay informed about session openings with customizable alerts:
- Tokyo Session Started
- London Session Started
- New York Session Started
- Sydney Session Started
Set up notifications to never miss important market opening periods, even when you're away from your charts.
---
How to Use This Indicator
For Day Traders:
1. Identify High-Volatility Periods - Focus your trading during London and New York session overlaps for maximum liquidity
2. Monitor Session Breakouts - Watch for price breaks above/below session highs and lows
3. Avoid Low-Volume Periods - Recognize when major sessions are closed to avoid false signals
For Swing Traders:
1. Mark Key Levels - Use session highs and lows as support/resistance zones
2. Track Multi-Session Patterns - Observe how price behaves across different trading sessions
3. Plan Entry/Exit Points - Time your trades around session openings for better execution
For Currency-Specific Traders:
1. JPY Pairs - Focus on Tokyo session movements
2. EUR/GBP Pairs - Monitor London session activity
3. USD Pairs - Track New York session volatility
4. AUD/NZD Pairs - Watch Sydney and Tokyo sessions
---
Technical Specifications
- Pine Script Version: 5
- Overlay Indicator: Yes (displays directly on price chart)
- Maximum Bars Back: 500
- Drawing Objects: Up to 500 lines, boxes, and labels
- Performance: Optimized for real-time data processing
- Compatibility: Works on all timeframes (recommended: 5m to 1H for session tracking)
---
Installation & Setup
1. Add to Chart - Click "Add to Chart" after copying the script to Pine Editor
2. Configure Timezone - Set your UTC offset or enable "Use Exchange Timezone"
3. Customize Colors - Choose your preferred color scheme for each session
4. Adjust Display - Enable/disable features based on your trading style
5. Set Alerts - Create alert notifications for session starts
---
Best Practices
✅ Combine with Price Action - Use session ranges alongside candlestick patterns for confirmation
✅ Watch Session Overlaps - The London-New York overlap (1300-1600 UTC) typically shows highest volatility
✅ Respect Session Highs/Lows - These levels often act as intraday support and resistance
✅ Adjust for Your Broker - Verify session times match your broker's server clock
✅ Use Multiple Timeframes - View sessions on both lower (15m) and higher (1H) timeframes for context
---
Why Choose Forex Session Tracker Pro?
✨ Professional Grade Tool - Built with clean, efficient code following TradingView best practices
✨ Beginner Friendly - Intuitive design with clear visual cues
✨ Highly Customizable - Adapt every feature to match your trading style
✨ Performance Optimized - Lightweight code that won't slow down your charts
✨ Actively Maintained - Regular updates and improvements
✨ No Repainting - All visual elements are fixed once the session completes
---
Support & Updates
This indicator is designed to provide reliable, accurate session tracking for forex traders of all experience levels. Whether you're a scalper looking for high-volatility windows or a position trader marking key institutional levels, the Forex Session Tracker Pro delivers the insights you need to make informed trading decisions.
Happy Trading! 📈
---
Disclaimer
This indicator is a tool for technical analysis and should be used as part of a comprehensive trading strategy. Past performance does not guarantee future results. Always practice proper risk management and never risk more than you can afford to lose. Trading forex carries a high level of risk and may not be suitable for all investors.

VWAP TrendSignalVWAP TrendSignal
VWAP (Volume-Weighted Average Price) is the market’s true fair value — the benchmark institutions use to see when price is balanced, extended, or trending with real intent.
Price often snaps back when it moves too far (mean reversion), and only shows genuine strength when it holds above or below VWAP.
VWAP TrendSignal makes this insight effortless by color-coding VWAP direction:
Yellow = VWAP rising → bullish pressure
Red = VWAP falling → bearish pressure
No bands. No noise. Just pure directional clarity.
Anchor VWAP to the Session, Week, Month, Quarter, or Year, and tailor the Slope Smoothing Filter to your timeframe:
1–2 smoothing → fast & reactive (1–5m scalping)
3–5 smoothing → clean & stable (5–15m intraday)
6–10 smoothing → slow flips (1H–4H swings)
10–15 smoothing → macro bias only (Daily/Weekly)
The line adapts to how you trade.
How to Use It
Mean Reversion
When price stretches far from VWAP, expect pullbacks or snapbacks.
Trend Direction
Yellow supports long bias, red supports short bias.
Simple, reliable, instantly visible.
Balance Zones
Price sitting near VWAP = compression, buildup, or chop.
A perfect signal to wait or prepare for a breakout.
Why It Works
VWAP TrendSignal distills institutional logic into a clean, single-line tool.
It shows fair value, trend slope, and balance all at once — making your chart clearer and your decisions faster.
Once you get used to reading it, trading without it feels blind.

Candle 2 Closure📌 Indicator Presentation – Candle 2 Closure
" Candle 2 Closure "s is an indicator designed to identify three types of price–action-based signals in real time: Long, Short, and Generic.
The goal is to visually highlight moments when the market breaks a key level of the previous candle but rejects that break, closing on the opposite side.
The idea was inspired by the study of pure price action and specifically by the following video:
👉 www.youtube.com
🎯 How the Indicator Works
The indicator generates signals on bar close (barstate.isconfirmed), making them reliable and free from repainting.
🔵 LONG Signal
A long signal is triggered when:
The current candle breaks the low of the previous candle
But then closes back above that low
→ This is often a sign of a bear trap or a liquidity rejection to the downside.
🔴 SHORT Signal
A short signal is triggered when:
The current candle breaks the high of the previous candle
But then closes back below that high
→ This may indicate a bull trap or a liquidity rejection to the upside.
⚪ GENERIC Signal
A generic signal is triggered when:
A high or low is broken,
But neither the long nor short conditions are met,
Resulting in a simple unconfirmed break.
📍 Operational Advantages
Highlights liquidity absorption zones
Works on all timeframes (1m → 1D)
Useful for scalping, intraday, or swing trading
Clear and immediate visual signals on the chart
Zero repainting
✨ Visual Style
LONG displayed below the candle, white color
SHORT displayed above the candle, white color
Generic signal shown with a neutral label

Directional Candle Size TrackerThis indicator measures the strength of bullish and bearish momentum by tracking the average size of candles — but only when they’re moving in the intended direction.
🟢 Bullish Strength rises when green candles expand in size
🔴 Bearish Strength rises when red candles grow in size
When the market pauses or flips direction, the opposing line flatlines, preserving the last value
Unlike traditional moving averages that blend all candles together, this tracker isolates directional pressure, giving you a clearer read on which side is truly in control. It’s especially useful for spotting momentum decay, trap setups, and regime transitions.
Use it to:
Confirm breakout strength
Detect fading conviction
Compare bullish vs. bearish aggression in real time

Keltner Channels BandsKeltner Channels Bands - パブリッシュ用説明文
日本語版
タイトル
Keltner Channels Bands (Multi-Timeframe)
説明文
概要
シンプルで視認性の高いケルトナーチャネルインジケーターです。マルチタイムフレーム機能を搭載し、どの時間足でも上位足のケルトナーチャネルを表示できます。
特徴
グレーカラーでチャートを見やすく保持
マルチタイムフレーム対応(デフォルト: 1時間足)
4時間足以上で自動非表示機能(チャートの見やすさを維持)
EMAまたはSMAの選択が可能
ATR倍率とバンド幅を自由にカスタマイズ
トレードコンセプト
ケルトナーチャネルは、価格のボラティリティに基づいたトレンド追従型インジケーターです。
基本的な使い方:
トレンド判定: 価格がバンドの上部で推移している場合は上昇トレンド、下部で推移している場合は下降トレンド
エントリー: 価格がバンド外に出た後、バンド内に戻るタイミングでトレンド方向へエントリー
エグジット: 価格が中心線(MA)に到達、または反対側のバンドに接近した時
ブレイクアウト: バンドを勢いよく突破した場合、新たなトレンドの始まりを示唆
推奨設定:
スイングトレード: Length 20, Multiplier 2.2, 1時間足または4時間足
デイトレード: Length 20, Multiplier 2.0, 5分足または15分足で1時間足を表示
注意事項
このインジケーターは単独での使用ではなく、他のテクニカル指標やプライスアクションと組み合わせて使用することを推奨します。
English Version
Title
Keltner Channels Bands (Multi-Timeframe)
Description
Overview
A simple and visually clean Keltner Channels indicator with multi-timeframe capabilities. Display higher timeframe Keltner Channels on any chart timeframe.
Features
Clean gray color scheme for better chart visibility
Multi-timeframe support (Default: 1-hour)
Auto-hide on 4H+ timeframes to maintain chart clarity
Choice between EMA or SMA
Customizable ATR multiplier and band width
Trading Concept
Keltner Channels is a volatility-based trend-following indicator that helps traders identify trend direction and potential entry/exit points.
Basic Usage:
Trend Identification: Price staying near upper band indicates uptrend; near lower band indicates downtrend
Entry Signals: Enter in trend direction when price returns inside the bands after moving outside
Exit Signals: Consider exits when price reaches the center line (MA) or approaches the opposite band
Breakout Trading: Strong momentum breaks through the bands may signal the start of a new trend
Recommended Settings:
Swing Trading: Length 20, Multiplier 2.2, 1H or 4H timeframe
Day Trading: Length 20, Multiplier 2.0, Display 1H channels on 5M or 15M charts
Disclaimer
This indicator should not be used alone. Combine it with other technical indicators and price action analysis for better trading decisions.

Delta Zones Buy/Sell Pressure UT Plus Delta Zones Buy/Sell Pressure: All-in-One Smart Trading Indicator
💡 Summary: This Indicator is designed as a powerful All-in-One analysis tool, consolidating 4 crucial trading strategies: Delta Zones (Extreme Pressure), Orderblocks & Breaker Blocks (Market Structure), Multi-Indicator Signals (RSI/CCI/Stoch), and UT Bot Alerts (Trend Signals). It provides a comprehensive trading setup on a single chart.
🔎 Key Features:
Delta Zones (Extreme Buy/Sell Pressure): Utilizes Standard Deviation to spot candles with abnormal Buy/Sell Pressure, often indicating institutional activity or stop hunts.
Orderblocks & Breaker Blocks: Automatically analyzes Market Structure Shifts (MSS) to draw Orderblocks and convert them into Breaker Blocks, serving as key support/resistance zones.
Multi-Indicator Signals (RSI/CCI/Stoch): Provides confirmed Buy/Sell signals when RSI, CCI, and Stochastic are in Oversold/Overbought conditions and show reversal action (Users can select the combination).
UT Bot Alerts: Includes a ATR-based Trailing Stop system and secondary Buy/Sell signals for trend confirmation.
🚀 How to Use:
Use the "BUY/SELL" signals from the Multi-Indicator section as the primary trigger.
Use the Delta Zones or Orderblocks/Breaker Blocks as high-confidence confirmation zones for entry/exit, and as precise Stop Loss placement areas.
⚠️ Note on Performance: This Indicator uses complex logic (especially Array and Box drawing functions) and may be resource-intensive on lower timeframes.

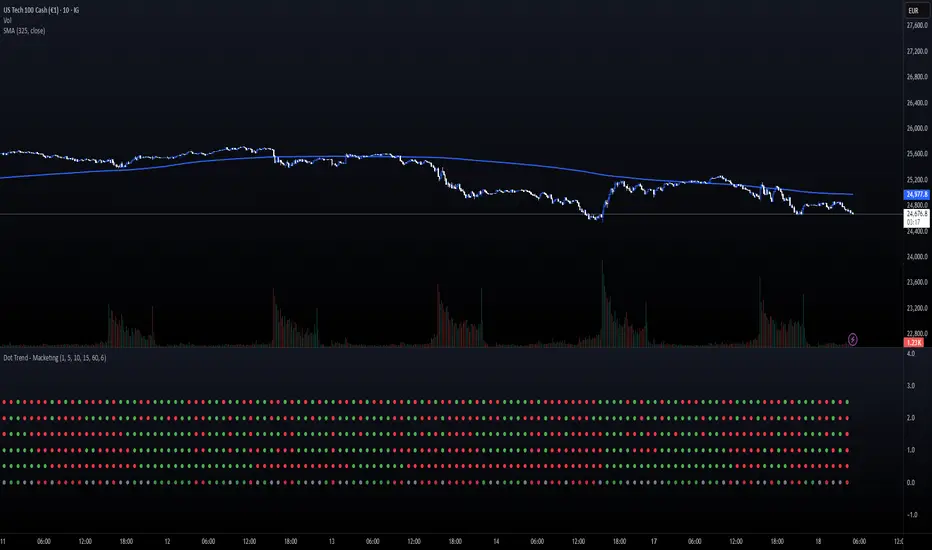
Dot Trend - MacketingDOT TRENDS (5x Multi-Timeframe Consensus Filter)
Description:
The DOT TRENDS indicator is a powerful, highly customizable tool designed to provide a clear, aggregated view of trend direction across five distinct timeframes (TFs). It uses an advanced ATR-based trailing mechanism coupled with an optional MACD filter to generate reliable trend signals, making multi-timeframe analysis simple and non-cluttered.
This indicator is ideal for scalpers and day traders who need immediate confirmation that market momentum aligns across various horizons (e.g., 1m, 5m, 15m, 1h).
Key Features:
5-Tier Trend Alignment: Track the trend across five fully customizable timeframes simultaneously (Default: 1m, 5m, 10m, 15m, 60m).
Clean Visual Design: Trends are represented by large, clear dots (Green for Bullish, Red for Bearish) in a dedicated sub-panel, free from chart clutter.
Consensus Row (NEW!): A dedicated bottom row displays the overall consensus. It signals a strong institutional trend (Muted Green/Red) only when 4 out of 5 timeframes agree.
MACD Momentum Filter: An optional feature that detects divergence/weakness. If the primary ATR trend is Bullish, but the MACD Histogram is negative, the dot turns Yellow—warning of a potential reversal or pause.
Dot Plot Frequency Filter: Custom setting (plotFrequency) to reduce visual noise by only drawing dots every N bars, keeping the panel clean when zoomed out.
Companion Chart Markers (Separate Script): A companion script is available to plot visual markers directly onto the main price chart when a perfect 5/5 consensus is reached.
How to Use It:
Green Dot: Strong Bullish Trend on that specific timeframe.
Red Dot: Strong Bearish Trend on that specific timeframe.
Yellow Dot (If Filter Active): Trend is confirmed, but momentum is fading (MACD disagreement).
Consensus Row (Bottom): Use as a primary confirmation filter. Only trade in the direction indicated by the Consensus row's color.
Technical Note:
The core trend logic is a custom, recursive ATR-based mechanism (similar to SuperTrend) known for its stability and lag-free signal generation.