Full Candle Higher/Lower (No Repeats)🔎 What the Script Does (Pine Script v6)
Keeps track of the last signal
Uses a persistent variable lastSignal (initialized once as "none").
Ensures that if a signal repeats consecutively, it won’t be triggered again.
Defines the conditions for a “Higher” or “Lower” candle sequence
Higher condition:
Current close > previous high, AND previous low ≤ the high of two bars ago.
→ This means the candle has fully broken higher.
Lower condition:
Current close < previous low, AND previous high ≥ the low of two bars ago.
→ This means the candle has fully broken lower.
Checks for new signals only
If a candle meets the condition and the last signal wasn’t the same, a new signal is triggered.
Updates lastSignal to prevent repeats.
Plots labels/arrows
A “Higher” signal shows a green label below the bar.
A “Lower” signal shows a red label above the bar.
Sets alerts
So you can be notified in TradingView whenever a “Higher” or “Lower” flag is detected.
📊 Trading Logic in Words
The indicator is looking for full candle breakouts.
If a candle closes above the previous high (with some confirmation from older bars), it flags it as a “Higher” signal.
If a candle closes below the previous low (with similar confirmation), it flags it as a “Lower” signal.
It avoids duplicate consecutive signals by remembering what the last one was.
✅ Why It’s Useful
Helps traders spot momentum continuation candles (strong push candles).
Reduces noise by not repeating the same signal multiple times in a row.
Works like a breakout detector that tells you when the market is making a new leg up or new leg down.
Wyszukaj w skryptach "纳斯达克指数期货cfd"
RSI ALL INOverbought and Oversold with Candle Pattern Confluences
1. Overbought / Oversold signal only
2. RSI + Engulfing Candle
3. RSI + Hammer/Shooting Star
SMC Pro (Wellington) v1.4.2This SMC indicator combines BOS/CHoCH, OBs, FVGs, liquidity, and Premium/Discount with confirmation on the 1H (EMA200).
Entries only appear when 3+ confluences align, filtering noise and delivering clear signals.
✅ Ready-to-use alerts (LONG, SHORT, or unified)
✅ Real-time HUD
✅ Strategy tailored for XAUUSD


Gold Master Indicator [Improved Signals]this indicater help you buy sans sell abobe and below the blue line.

ADR LadderAverage Daily Range Indicator.
Buy zone is from +3% to +20%. TP before 50%.
Sell zone is from -3% to -20%. TP before -50%.
Combine with other indicators for confluence especially for support and resistance levels.

Pivot Up & Down range - Máximos y Mínimos de RangoUps and downs from range 3 to 10 candles. Highs are marked with a red arrow and lows with a green one.

All-In-One MA Stack ScalperWhat is this Indicator?
This tool is an advanced, multi-layered breakout and trend-following indicator designed for lower timeframes. It identifies high-conviction buy and sell signals by combining moving average stacking with a suite of professional-grade filters.
How Does It Work?
A signal is generated only when ALL of the following conditions are met:
Moving Average Stack (5M Chart):
Buy: The close price is above all five moving averages (MAs: 100, 48, 36, 24, 12).
Sell: The close price is below all five MAs.
Volatility Filter (ATR):
Signals only print when the current ATR (14) is at least 80% of its 100-period average, ensuring you only trade in actively moving markets.
Candle Structure Filter:
The current candle must have a real body that is at least 35% of the candle’s total range, filtering out dojis and indecision bars.
Big Candle Filter:
The candle’s total range must be at least 40% of the current ATR, avoiding signals on minor, insignificant moves.
Volume Filter:
The current volume must be at least 80% of its 50-period average, filtering out signals during illiquid or quiet market conditions.
Minimum Distance from All MAs:
Price must be a minimum distance (20% ATR) away from each MA, confirming a clean breakout and avoiding signals in tight MA clusters or ranging markets.
RSI Momentum Filter:
Buy: RSI(14) must be greater than 55.
Sell: RSI(14) must be less than 45.
This ensures trades are only taken in the direction of momentum.
ADX Trend Filter:
ADX(14,14) must be above 20, ensuring signals only print in trending conditions (not in chop/range).
Minimum Bars Between Signals:
Only one signal per direction is allowed every 10 bars to avoid overtrading and signal clustering.
What Does This Achieve?
Reduces noise and false signals common in basic MA cross or stack systems.
Captures only strong, high-momentum, and high-conviction moves.
Helps you avoid chop, range, and news whipsaws by combining multiple market filters.
Perfect for advanced scalpers, intraday trend followers, or as a trade filter for algos/EAs.
How to Use It:
Apply to your 5-minute chart.
Green BUY signals: Only when all bullish conditions align.
Red SELL signals: Only when all bearish conditions align.
Use as a stand-alone system or as a filter for your own entries.
Recommended For:
Scalpers & intraday traders who want only the best opportunities.
EA and bot builders seeking reliable signal logic.
Manual traders seeking confirmation of high-probability breakouts.
Tip:
Adjust any of the filters (e.g., RSI/ADX thresholds, minBars, minDist) to make it more/less selective for your style or market.

US30 ORB 5m / 1m StrategyThis is Open range breakout strategy, its tested with Us30 only. You cant optimize or try. it seems profitable

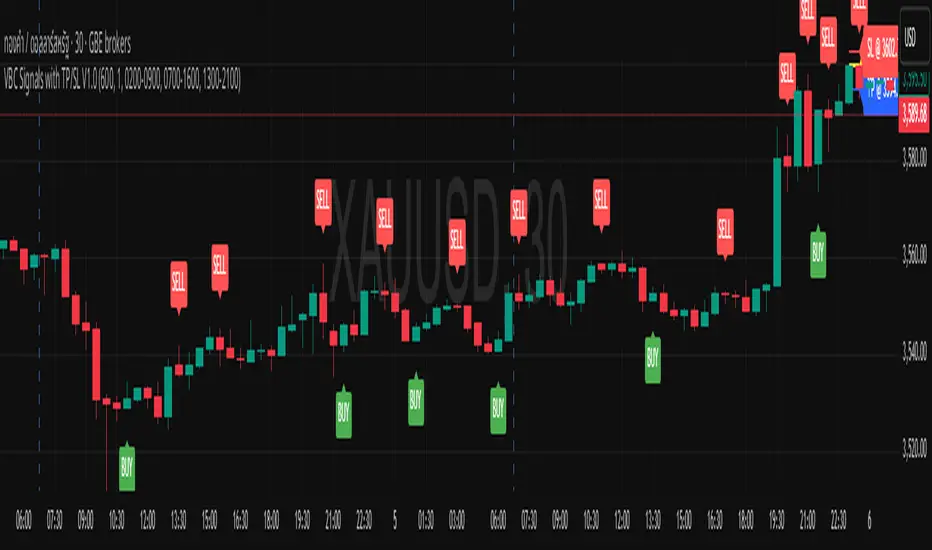
VBC Signals with TP/SL V1.0This script was based on volume break candle theory.
VBC has a very simple idea. It uses the principle that if the price of the XAUUSD asset rises above a specified range of at least 600 points (configuarable) continuously, and a candle breaks the upward trend, a signal will be generated to sell. The entry principle is to enter at the price at the last bullish candle with TP300 SL300.
On the other hand, if the price of xauusd falls below the specified level of 600 points and a candle breaks the price down by 1 candle, a BUY signal will occur, and the ENTRY and TP SL will use the same values as the SELL signalใ
How it works:
SELL SIGNAL : When the asset price rises above 600 points continuously and a "SELL" signal occurs, place a limit sell order at the pair of green and red bars that formed the signal, specifying a TP of 300 and SL of 300.
BUY SIGNAL : When the asset price falls more than 600 points continuously and a "BUY" signal occurs, place a limit sell order at the double bar pattern of the red and green bars that formed the signal, specifying a TP of 300 and a SL of 300.
Disclaimer: This script is for educational purposes only. It does not constitute financial advice. Always do your own research before making trading decisions.
NOTE: For certain XAUUSD of certain broker (for instance XAUUSD on OANDA), the signal might found to often, just multiple the threshold by 10, then 600 will be come 6000
Trend Following S/R Fibonacci Strategy 2Trend Following S/R Fibonacci Strategy 2
Trend Following S/R Fibonacci Strategy 2

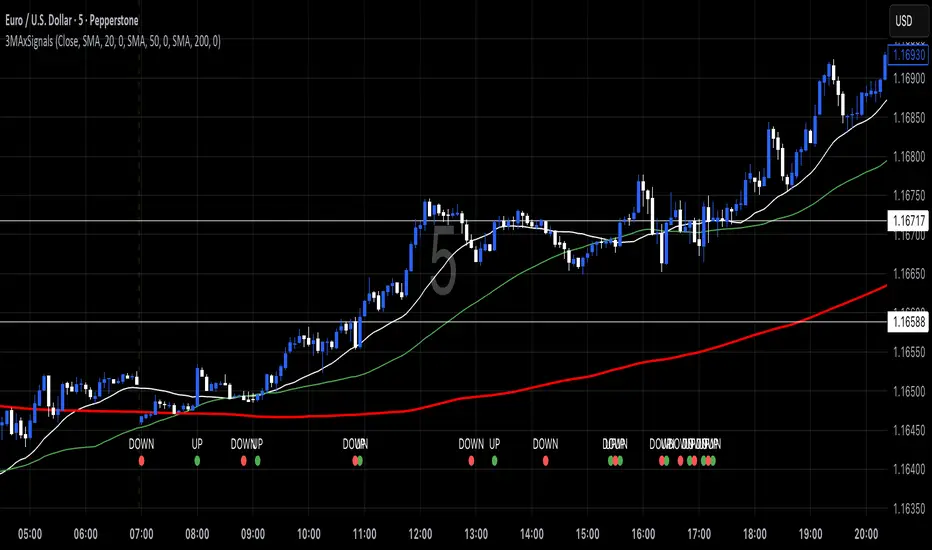
3 MA's with Crossing SignalsPlots three fully configurable moving averages on one chart and prints/alerts BUY/SELL signals when price crosses your chosen MA(s). Built to match TradingView’s built-ins exactly.
Features
Per-line MA type: SMA, EMA, SMMA (RMA), WMA, VWMA
Per-line settings: length, color, offset
Source control: Close, Open, High, Low, HL2, HLC3, OHLC4
Optional Heikin Ashi calculation for both the MAs and the cross price
Toggle signals vs MA1 / MA2 / MA3 independently
Alert conditions for every cross (ready for “Once per bar close”)
How signals work
UP when the selected price stream crosses above the chosen MA
DOWN when it crosses below
Signals/alerts follow your selected source (and HA toggle) to keep everything consistent.
Simple TPODisplays price distribution over time using Time Price Opportunities (TPO). Shows Point of Control (POC), Value Area High/Low (VAH/VAL) levels to identify key support/resistance zones and fair value areas. Includes customizable timeframes and price breakout alerts.

Trend Following S/R Fibonacci StrategyTrend Following S/R Fibonacci Strategy
Trend Following S/R Fibonacci Strategy

Multiple Asset note_table Sections### Features
- **Expanded to 10 independent Sections**: Each Section has a title, content, and associated asset
- **Asset-based filtering**: Section only displays when the Section's asset name is empty or matches the current chart asset
- **Empty asset setting retained**: If Section asset name is left blank, that Section will display across all assets
- **Automatic display of current asset**: Current asset name is automatically shown in the header and footer
### Usage Instructions
1. Each Section can be assigned a specific asset name, such as "BTCUSDT", "ETHUSDT", etc.
2. A Section will only display when the current chart asset matches the asset specified for that Section
3. If you want a Section to display across all assets, simply leave the asset name blank for that Section
4. Each Section has independent title and content that can be customized as needed
5. When switching to different trading instruments, the indicator automatically displays notes relevant to the current instrument
PCV (Darren.L-V2)Description:
This indicator combines Bollinger Bands, CCI, and RVI to help identify high-probability zones on M15 charts.
Features:
Bollinger Bands (BB) – displayed on the main chart in light gray. Helps visualize overbought and oversold price levels.
CCI ±100 levels + RVI – displayed in a separate sub-window:
CCI only shows the ±100 reference lines.
RVI displays a cyan main line and a red signal line.
Valid Zone Detection:
Candle closes outside the Bollinger Bands.
RVI crosses above +100 or below -100 (CCI level reference).
Candle closes back inside the BB, confirming a price rebound.
Requires two touches in the same direction to confirm the zone.
Only zones within 20–30 pips range are considered valid.
Usage:
Helps traders spot reversal or bounce zones with clear visual signals.
Suitable for all indices, Forex, and crypto on M15 timeframe.

FNGAdataOpenOpen prices for FNGA ETF (Dec 2018–May 2025)
The FNGA ETF (originally launched under the FNGU ticker before being renamed in March 2025) tracked the MicroSectors FANG+™ Index with 3x daily leverage and was designed to give traders magnified exposure to a concentrated basket of large-cap technology and tech-enabled companies. The fund’s price history contains multiple phases due to ticker changes, corporate actions, and its eventual redemption in mid-2025.
When looking specifically at Open prices from December 2018 through May 2025, this dataset provides the daily opening values for FNGA across its entire lifecycle. The opening price is the first traded price at the start of each regular U.S. market session (9:30 a.m. Eastern Time). It is an important measure for traders and analysts because it reflects overnight sentiment, pre-market positioning, and often sets the tone for intraday volatility.

Swing Oracle Stock// (\_/)
// ( •.•)
// (")_(")
📌 Swing Oracle Stock – Professional Cycle & Trend Detection Indicator
The Swing Oracle Stock is an advanced market analysis tool designed to highlight price cycles, trend shifts, and key trading zones with precision. It combines trendline dynamics, normalized oscillators, and multi-timeframe confirmation into a single comprehensive indicator.
🔑 Key Features
NDOS (Normalized Dynamic Oscillator System):
Measures price strength relative to recent highs and lows to detect overbought, neutral, and oversold zones.
Dynamic Trendline (EMA8 or SMA231):
Flexible source selection for adapting to different trading styles (scalping vs. swing).
Multi-Timeframe H1 Confirmation:
Adds higher-timeframe validation to improve signal reliability.
Automated Buy & Sell Signals:
Triggered only on significant crossovers above/below defined levels.
Weekly Cycles (7-day M5 projection):
Tracks recurring time-based market cycles to anticipate reversal points.
Intuitive Visualization:
Colored zones (high, low, neutral) for quick market context.
Optional background and candlestick coloring for better clarity.
Multi-Timeframe Cross Table:
Automatically compares SMA50 vs. EMA200 across multiple timeframes (1m → 4h), showing clear status:
⭐️⬆️ UP = bullish trend confirmation
💀⬇️ Drop = bearish trend confirmation
📊 Built-in Statistical Tools
Normalized difference between short and long EMA.
Projected normalized mean levels plotted directly on the main chart.
Dynamic analysis of price distance from SMA50 to capture market “waves.”
🎯 Use Cases
Spot trend reversals with multi-timeframe confirmation.
Identify powerful breakout and breakdown zones.
Time entries and exits based on trend + cycle confluence.
Enhance market timing for swing trades, scalps, or long-term positions.
⚡ Swing Oracle Stock brings together cycle detection, oscillator normalization, and multi-timeframe confirmation into one streamlined indicator for traders who want a professional edge.

Monthly MA Box for S&P 500 or othersThis moving average helps detect when the asset is undervalued or overvalued. Users can adjust the spread between the moving averages.


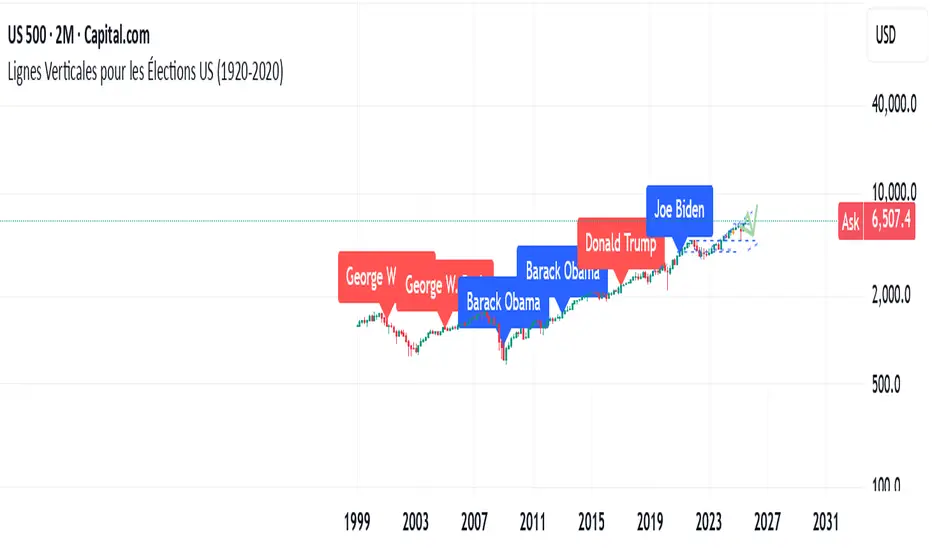
US Elections Democrate-Republicain (1920-2025)This script shows the different U.S. presidents and indicates whether each was Democratic or Republican. It allows users to analyze the market based on the president in office.
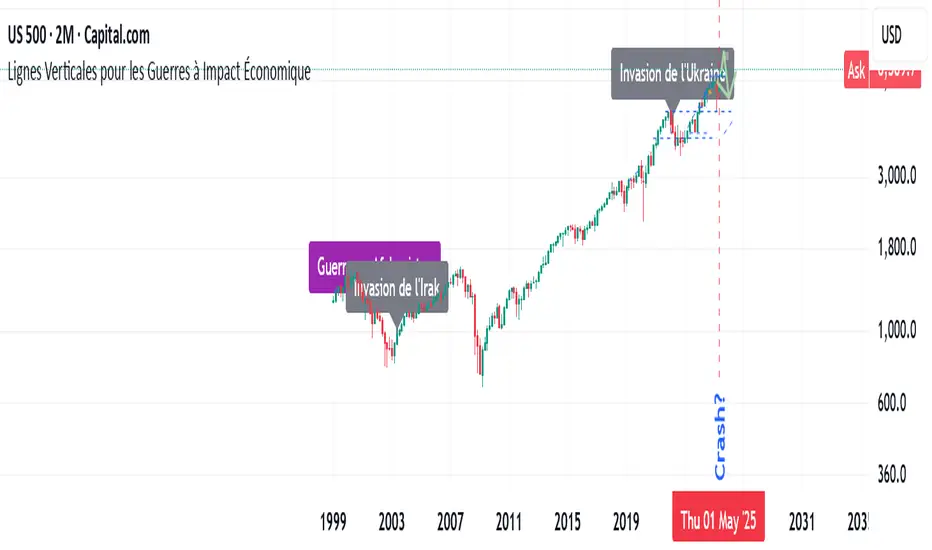
Major Wars with a signifiant economic impactThis indicator highlights major wars that have had a significant economic impact worldwide. It allows users to easily see their effects on the charts.