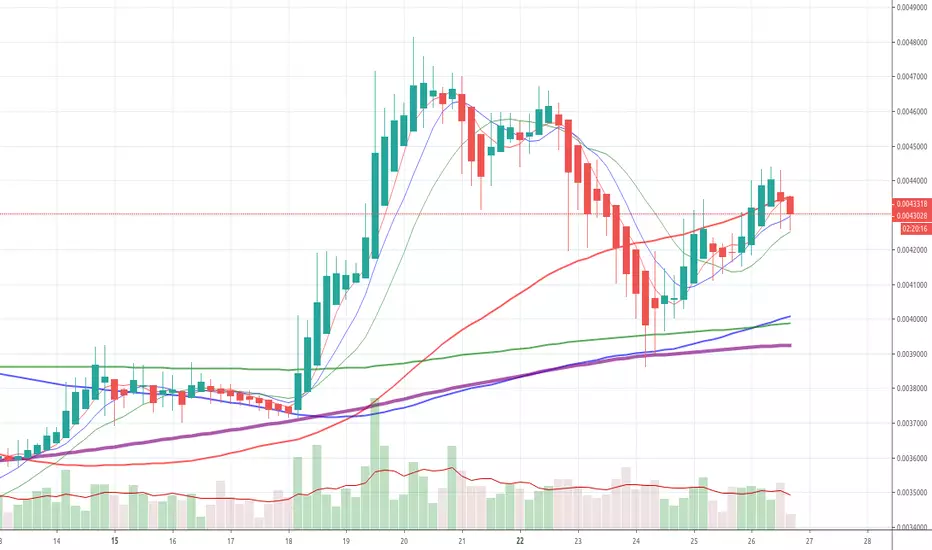
Czarlieron's Multiple MA's w/ BBThis script contains:
Multiple EMA's (8, 13, 21, 34, 55, 100, 200)
Multiple SMA's (8, 13, 21, 34, 55, 100, 200)
Bollinger Bands
Wyszukaj w skryptach "情绪指数板块+约200只股票+选股规则"
EMA/SMA Support/Resistance Levels////////////////////////////////////////////////////////////
// saxonlucius 07/08/2019
// EMA/SMA Major Support/Resistance levels
////////////////////////////////////////////////////////////
The script contains major support/resistance EMA's and SMA's.
This includes:
EMA
EMA 21
EMA 34
EMA 50
EMA 89
EMA 100
EMA 200
EMA 377
SMA
SMA 10
SMA 100
SMA 200
SMA 900
The EMA 34 and SMA 900 are not as relevant as the others.

Double 7's StrategyStrategy described in the book "Short Term Trading Strategies that Work", written by Larry Connors and Cesar Alvarez.
It is the simplest strategy I know and has only 3 rules:
- Price must be above the arithmetic moving average of 200 periods.
- Buy when the price closes below the closing of the last 7 days.
- Sale when the price closes above the closing of the last 7 days.
Simple as it may seem, this strategy works very well in some stocks and/or graphical times (in some stocks it overcomes many RSI 2 strategies). It was developed for the daily chart and does not usually work well on weekly or monthly charts, but can be used for day trades if the back-test proves to be favorable.
If you want, you can change the input and output rules by setting other values for the input or output period and thus find more positive results for specific stocks.
There is no stop loss because in tests the stop loss usually reduces the gains of the strategy.
Good luck and good trades.
================================
Estrategia descrita no livro "Short Term Trading Strategies that Work", escrito por Larry Connors e Cesar Alvarez.
É a estratégia mais simples que eu conheço e tem apenas 3 regras:
- Preço deve estar acima da média móvel aritmética de 200 períodos.
- Compre quando o preço fechar abaixo do fechamento dos ultimos 7 dias.
- Venda quando o preço fechar acima do fechamento dos ultimos 7 dias.
Por mais simples que pareça, esta estratégia funciona muito bem em alguns papeis e/ou tempos gráficos (em alguns papeis a mesma supera muitas estratégias pelo IFR2). A mesma foi desenvolvida para o gráfico diário e normalmente não funciona muito bem em gráficos semanais ou mensais, mas pode ser utilizado no intraday caso o backtest se mostre favorável.
Caso você queira, é possível alterar a regra de entrada e saída definindo outros valores para o período de entrada ou saída e assim encontrar resultados mais positivos para cada papel.
Não existe stop loss pois nos testes normalmente o stop loss reduz os ganhos da estratégia.
Boa sorte e bons trades.


Mayer MultiplerThe ‘Mayer Multiple’ is one of the most popular metrics and derives from the current price divided by the 200-day moving average (200-MA). The average value is 1.39, and historically, when it becomes equal to or greater than 2.4 it will retrace to under 1.5.
Simulations performed by Trace Mayer determined that in the past, the best long-term results were achieved by accumulating Bitcoin whenever the Mayer Multiple was below 2.4.
Since the simulations were based on historical data, they are purely educational and should not be the basis of any financial decision.
Credit:
bitcoinist.com
mayermultiple.info

MA-EMA_ECMoving Average x4 (10,30,100, 200)
Exponential Moving Average x4 (21, 55, 200, 377)
Bearish/Bullish Engulfing markers

Crypto Indicators #u9tusA set of low timeframe (LTF), medium timeframe (MTF), and high timeframe (HTF) indicators for use in crypto currencies / bitcoin.
Traditionally the 10, 20, 50, 100, and 200 SMAs are used in TA. With cryptos, I've found that the 8 EMA, 21, 55, and 128 SMAs backtest better, while no change in length was necessary for the 200. I wanted to combine all these into one indicator to easily add them to a chart layout, hence this script.
You can customize the length of each MA to your liking in the settings, or accept the defaults.
LTF Indicators:
8 EMA in blue hues, medium line stroke.
MTF Indicators:
21, 55 SMA in purple hues, medium line stroke.
HTF Indicators:
128, 200 SMA in yellow hues, thick line stroke.
Defaults are for daily timeframes and lower; suggest changing up the intervals for weekly and monthly to:
21 -> 30
55 -> 50
128 -> 100
$BTC, $ETH, #ALTS
twitter.com
(c) @jhaurawachsman 20190515

rainbow ema갤럭시님 이평선 토대로 JB가 에디트한 지수이평선 모음입니다. 편집하시면 일반 이평선으로도 사용이 가능합니다.
하나의 지표 추가 만으로 여러개의 지수이평선을 사용하실 수 있고, 제가 자주 사용하는 7,14,21,28,40,60,120,200,300선 넣어 놨습니다.
"Galaxy" made, JB edited EMA script. Editing is free for use if you swap ema to ma as a base setting.
You can use several ema lines by adding one indicator only, and I put 7,14,21,28,40,60,120,200,300 as a threshold which I frequently use.
It is made as an open source at any time possible, so that you are free for playing with it.
Gazua!!!!


5 MAs w. alerts [LucF]Is this gazillionth MA indicator worth an addition to the already crowded field of contenders? I say yes! This one shows up to 5 MAs and 6 different marker conditions that can be used to create alerts, among many other goodies.
Features
MAs can be darkened when they are falling.
MAs from another time frame can be displayed, with the option of smoothing them.
Markers can be filtered to Longs or Shorts only.
EMAs can be selected for either all or the two shortest MAs.
The background can be colored using any of the marker states except no. 3.
Markers are:
1. On crosses between any two user-defined MAs,
2. When price is above or below an MA,
3. On Quick Flips (a specific setup involving a cross, multiple MA states and increasing volume, when available),
4. When the difference between two MAs is within a % of its high/low historic values,
5. When an MA has been rising/falling for n bars,
6. When the difference between two MAs is greater than a multiple of ATR.
Some markers use similar visual cues, so distinguishing them will be a challenge if they are used concurrently.
Alerts
Alerts can be created on any combination of alerts. Only non-consecutive instances of markers 5 and 6 will trigger the alert condition. Make sure you are on the interval you want the alert to run at. Using the “Once Per Bar Close” trigger condition is usually the best option.
When an alert is created in TradingView, a snapshot of the indicator’s settings is saved with the alert, which then takes on a life of its own. That is why even though there is only one alert to choose from when you bring up the alert creation dialog box and choose “5 MAs”, that alert can be triggered from any number of conditions. You select those conditions by activating the markers you want the alert to trigger on before creating the alert. If you have selected multiple conditions, then it can be a good idea to record a reminder in the alert’s message field. When the alert triggers, you will need the indicator on the chart to figure out which one of your conditions triggered the alert, as there is currently no way to dynamically change the alert’s message field from within the script.
Background settings will not trigger alerts; only marker configurations.
Notes
MAs are just… averages. Trader lure would have them act as support and resistance levels. I’m not sure about that, and not the only one thinking along these lines. Adam Grimes has studied moving averages in quite a bit of detail. His numbers point to no evidence indicating they act as support/resistance, and to specific MA lengths not being more meaningful than others. His point of view is debated by some—not by me. Mean reversion does not entail that price stops when it reaches its MA; rather, it makes sense to me that price would often more or less oscillate around its MA, which entails the MA does not act as support/resistance. Aren’t the best mean reversion opportunities when price is furthest away from its MA? If so, it should be more profitable to identify these areas, which some of this indicator’s markers try to do.
I think MAs can be much more powerful when thought of as instruments we can use to situate price events in contexts of various resolutions, from the instantaneous to the big picture. Accordingly, I use the relative positions and slopes of MAs in both discretionary and automated trading; but never their purported ability to support/resist.
Regardless of how you use MAs, I hope you will find this indicator useful.
Biased References
The Art and Science of Technical Analysis: Market Structure, Price Action, and Trading Strategies, Adam Grimes, 2012.
Does the 200 day moving average “work”?
Moving averages: digging deeper

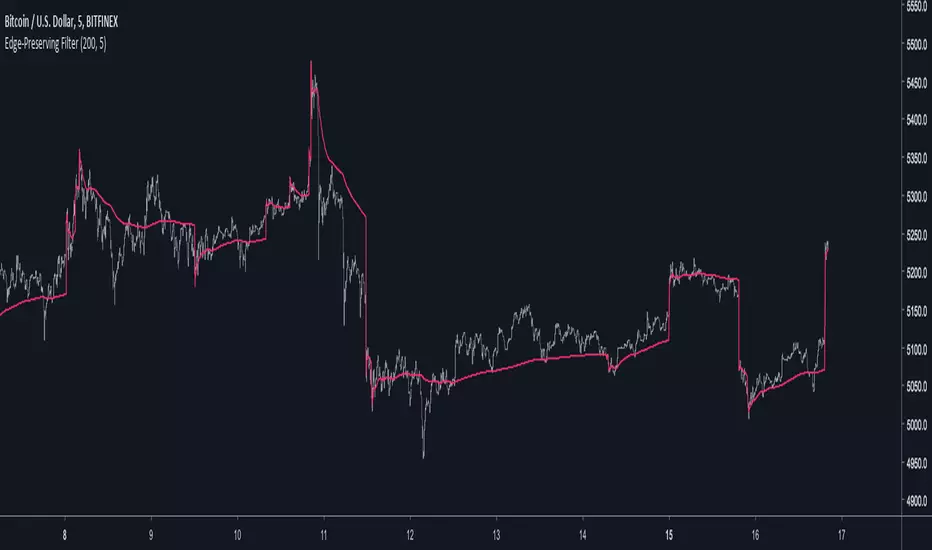
Edge-Preserving FilterIntroduction
Edge-preserving smoothing is often used in image processing in order to preserve edge information while filtering the remaining signal. I introduce two concepts in this indicator, edge preservation and an adaptive cumulative average allowing for fast edge-signal transition with period increase over time. This filter have nothing to do with classic filters for image processing, those filters use kernels convolution and are most of the time in a spatial domain.
Edge Detection Method
We want to minimize smoothing when an edge is detected, so our first goal is to detect an edge. An edge will be considered as being a peak or a valley, if you recall there is one of my indicator who aim to detect peaks and valley (reference at the bottom of the post) , since this estimation return binary outputs we will use it to tell our filter when to stop filtering.
Filtering Increase By Using Multi Steps Cumulative Average
The edge detection is a binary output, using a exponential smoothing could be possible and certainly more efficient but i wanted instead to try using a cumulative average approach because it smooth more and is a bit more original to use an adaptive architecture using something else than exponential averaging. A cumulative average is defined as the sum of the price and the previous value of the cumulative average and then this result is divided by n with n = number of data points. You could say that a cumulative average is a moving average with a linear increasing period.
So lets call CMA our cumulative average and n our divisor. When an edge is detected CMA = close price and n = 1 , else n is equal to previous n+1 and the CMA act as a normal cumulative average by summing its previous values with the price and dividing the sum by n until a new edge is detected, so there is a "no filtering state" and a "filtering state" with linear period increase transition, this is why its multi-steps.
The Filter
The filter have two parameters, a length parameter and a smooth parameter, length refer to the edge detection sensitivity, small values will detect short terms edges while higher values will detect more long terms edges. Smooth is directly related to the edge detection method, high values of smooth can avoid the detection of some edges.
smooth = 200
smooth = 50
smooth = 3
Conclusion
Preserving the price edges can be useful when it come to allow for reactivity during important price points, such filter can help with moving average crossover methods or can be used as a source for other indicators making those directly dependent of the edge detection.
Rsi with a period of 200 and our filter as source, will cross triggers line when an edge is detected
Feel free to share suggestions ! Thanks for reading !
References
Peak/Valley estimator used for the detection of edges in price.
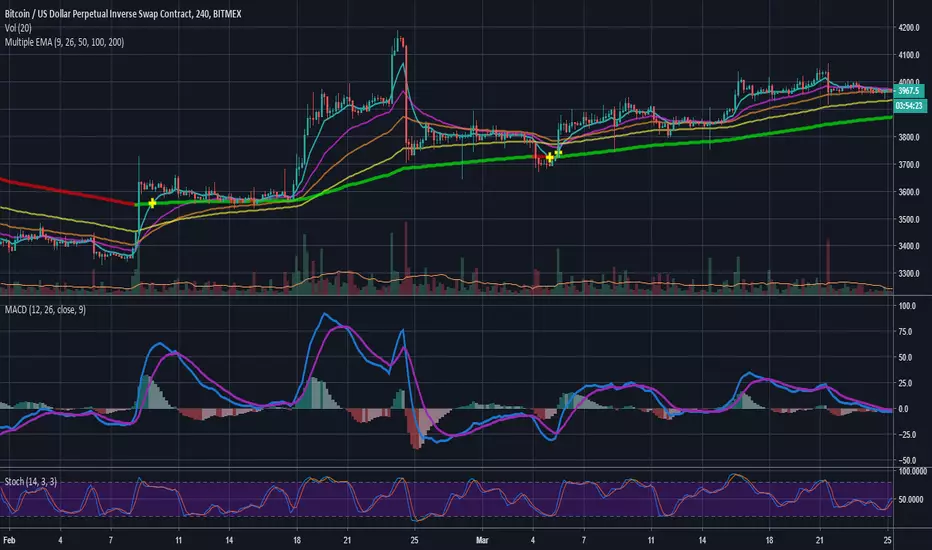
Multiple EMAMultiple EMA. Color switch of slowest EMA (def=200) when price close below or above. Trend marker when fastest EMA (def=9) cross slowest EMA (def=200).

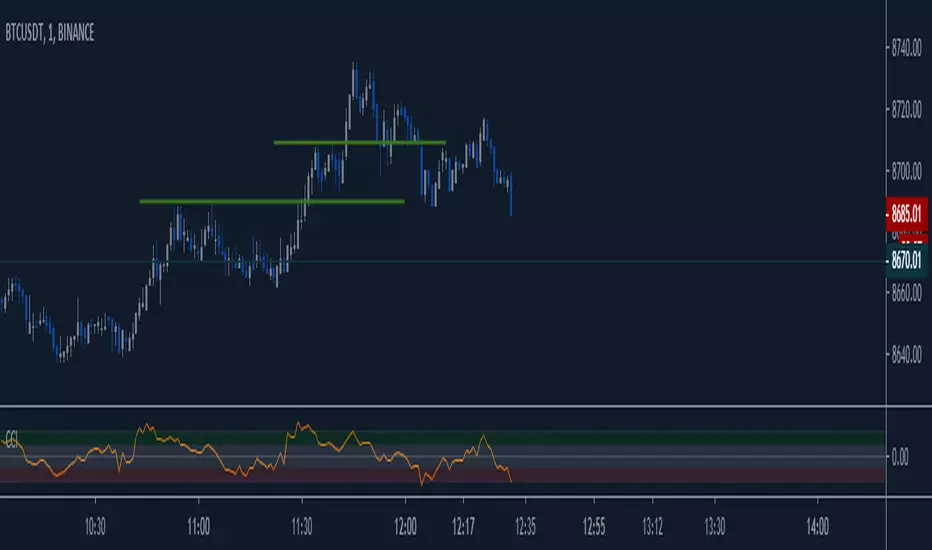
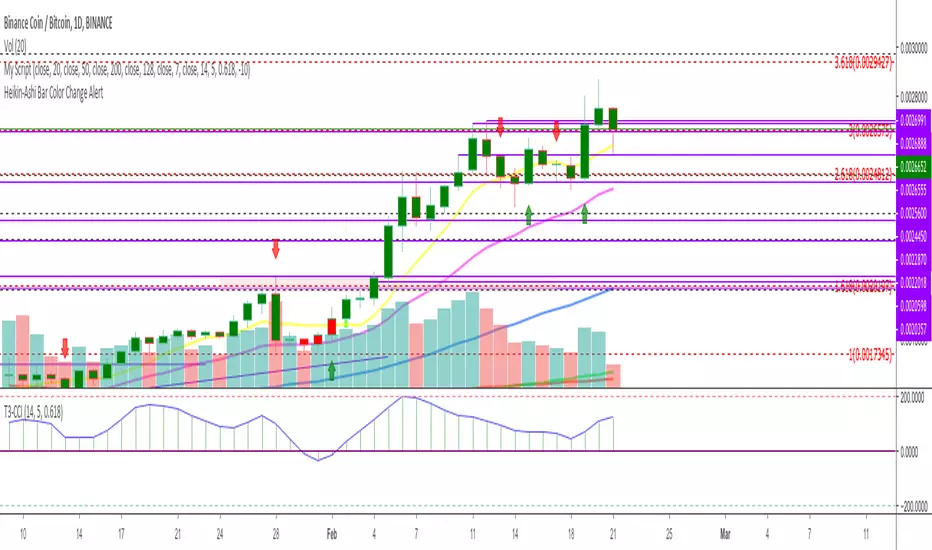
FX Sniper: T3-CCI Strategy with OB/OS guidesThis is a simple addition to Hpotters T3 CCI that has dashed guide lines at the 200 and -200 level to indicate overbought / oversold conditions.
Multi SMAPlot all of the most important SMA values.
SMA 5, 8, 13 are based on Fibonaci values and frequently used in day trading frequently.
SMA 50, 100, 200 are important support/resistance lines.
Especially, SMA 50, 100, 200 are the most important support/resistance on BTC 1W. Dont forget to look at the weekly prices when trading :)