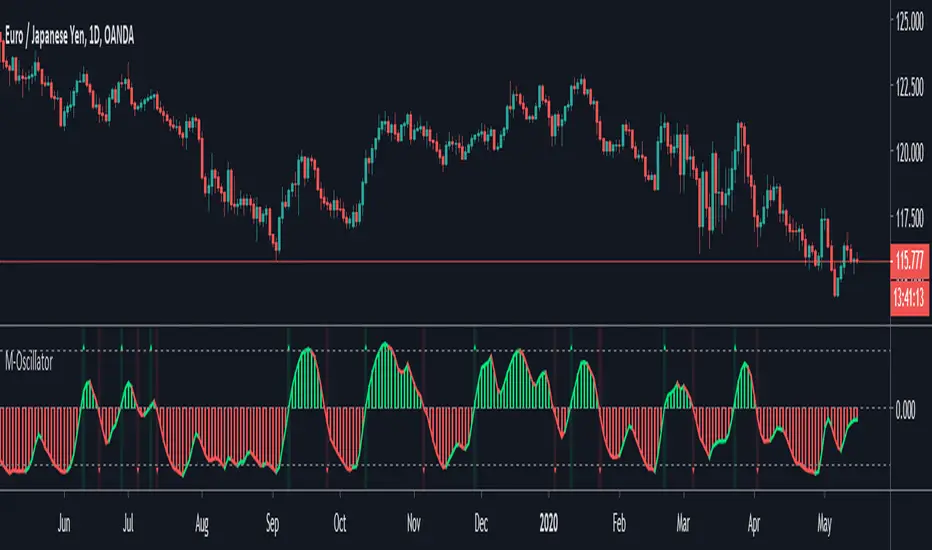
M-OscillatorM-Oscillator developed By Mohamed Fawzy, MFTA, CFTe
as Written in IFTA Journal 2018 Edition
more info : ifta.org
Interpretation
• M-Oscillator is a bounded oscillator that moves between (-14) and (+14),
• Movement above 10 is considered overbought, and movement below -10 is oversold.
Overbought/Oversold rule:
• Buy when the M-Oscillator violates the (-10) level to the downside and crosses back to the upside.
• Sell when the M-Oscillator crosses above the (+10) level and crosses back to the downside.
Crossover on Extreme Levels
• Sell signals are triggered when the M-Oscillator crosses its signal line above (13), which indicates an extreme market condition
• Buy signals are triggered when the M-Oscillator crosses its signal line below (- 13)
Wyszukaj w skryptach "德国10年期国债"
2-Period RSI strategy (with filter)2-period RSI strategy backtest described in several books of the trader Larry Connors . This strategy uses a 2 periods RSI , one slow arithmetic moving average and one fast arithmetic moving average.
Entry signal:
- RSI 2 value below oversold level (Larry Connors usually sets oversold to be below 5, but other authors prefer to work below 10 due to the higher number of signals).
- Closing above the slow average (200 periods).
- Entry at closing of candle or opening of next candle.
Exit signal:
- Occurs when the candlestick closes above the fast average (the most common fast average is 5 periods, but some traders also suggest the 10 period average).
Entry Filter (modification made by me):
- Applied an RSI2 arithmetic moving average to smooth out oscillations.
- Entered only when RSI2 is below oversold level and RSI2 moving average is below 30.
* NOTE: In the stocks that I evaluate daily the averages of 4 and 6 periods work very well as a filter.
Comments:
This strategy works very well in Daily charts but can be applied in other chart times as well. As this is a strategy to catch market fluctuations, it presents different results with different stocks.
I have been applying this strategy to the stocks of the Brazilian market (BOVESPA) and have enjoyed the result. Every day I evaluate the stocks that are generating entry signals and choose which one to trade based on the stocks with the highest Profit Value.
The RSI 2 averaging filter probably will reduce profit of the backtests because reduces the number of signals, but the Profit Value will usually increase. For me this was a good thing because without the filter, this strategy usually shows more signals than I have capital to allocate.
Before entering a trade I look at which fast average the paper has the highest Profit Value and then I use this average as my output signal for that trade (this change has greatly improved the result of the outputs).
This strategy does not use Stop Loss because normally Stop Loss decreases effectiveness (profit). In any case, the option to apply a percentage Stop Loss if desired is added in the script. As the strategy does not use stop, extra caution with risk management is advisable. I advise not to allocate more than 20% of the trade capital in the same operation.
I'm still studying ways to improve this strategy, but so far this is the best setup I've found. Suggestions are always welcome and we can test to see if they improve the backtest result.
Good luck and good trades.
================================================
Backtest das estratégia do IFR de 2 períodos descrita em varios livros do trader Larry Connors . Esta estratégia usa um IFR de 2 períodos, uma média movel aritmética lenta e uma média movel aritmética rápida.
Sinal de entrada:
- Valor do IFR 2 abaixo do nível de sobrevenda (Larry Connors usualmente define sobrevenda sendo abaixo de 5, mas outros autores preferem trabalhar abaixo de 10 devido ao maior número de sinais).
- Fechamento acima da média lenta (200 períodos).
- Realizado a compra no fechamento do candle ou na abertura do candle seguinte.
Sinal de saída:
- Ocorre quando o candle fecha acima da média rápida (a média rápida mais comum é a de 5 períodos, mas alguns traders sugerem também a média de 10 períodos).
Filtro para entrada (modificação feita por mim):
- Aplicado uma média móvel aritmética do IFR2 para suavisar as oscilações.
- Realizado a entrada apenas quando o IFR2 está abaixo do nível de sobrevenda e a média móvel do IFR2 está abaixo de 30.
*OBS: nos ativos que avalio diariamente as médias de 4 e 6 períodos funcionam muito bem como filtro.
Comentários:
Esta estratégia funciona muito bem no tempo gráfico Diário mas pode ser aplicada tambem em outros tempos gráficos. Como trata-se de uma estratégia para pegar oscilações do mercado, ela apresenta diferentes resultados com diferentes ativos.
Eu venho aplicando esta estratégia nos ativos do mercado brasileiro (BOVESPA) e tenho gostado do resultado. Diariamente eu avalio os papeis que estão gerando entrada e escolho qual irei realizar o trade baseado nos papeis que apresentam maior Profit Value.
O filtro da média do IFR 2 reduz o lucro nos backtests pois reduz também a quantidade de sinais, mas em compensação o Profit Value irá normalmente aumentar. Para mim isto foi algo positivo pois, sem o filtro, normalmente esta estratégia apresenta mais sinais do que possuo capital para alocar.
Antes de entrar em um trade eu olho em qual média rápida o papel apresenta maior Profit Value e então eu utilizo está média como meu sinal de saída para aquele trade (esta mudança tem melhorado bastante o resultado das saídas).
Está estratégia não utiliza Stop Loss pois normalmente o Stop Loss diminui a eficácia (lucro). De qualquer maneira, foi acrescentado no script a opção de aplicar um Stop Loss percentual caso seja desejado. Como a estratégia não utiliza stop é aconselhável um cuidado redobrado com o gerenciamento de risco. Eu aconselho não alocar mais de 20% do capital de trade em uma mesma operação.
Ainda estou estudando formas de melhorar esta estratégia, mas até o momento está é a melhor configuração que encontrei. Sugestões são sempre bem vindas e podemos testar para verificar se melhoram o resultado do backtest.
Boa sorte e bons trades.

Pinescript v3 Compatibility Framework (v4 Migration Tool)Pinescript v3 Compatibility Framework (v4 Migration Tool)
This code makes most v3 scripts work in v4 with only a few minor changes below. Place the framework code before the first input statement.
You can totally delete all comments.
Pros:
- to port to v4 you only need to make a few simple changes, not affecting the core v3 code functionality
Cons:
- without #include - large redundant code block, but can be reduced as needed
- no proper syntax highlighting, intellisence for substitute constant names
Make the following changes in v3 script:
1. standard types can't be var names, color_transp can't be in a function, rename in v3 script:
color() => color.new()
bool => bool_
integer => integer_
float => float_
string => string_
2. init na requires explicit type declaration
float a = na
color col = na
3. persistent var init (optional):
s = na
s := nz(s , s) // or s := na(s ) ? 0 : s
// can be replaced with var s
var s = 0
s := s + 1
___________________________________________________________
Key features of Pinescript v4 (FYI):
1. optional explicit type declaration/conversion (you still can't cast series to int)
float s
2. persistent var modifier
var s
var float s
3. string series - persistent strings now can be used in cond and output to screen dynamically
4. label and line objects
- can be dynamically created, deleted, modified using get/set functions, moved before/after the current bar
- can be in if or a function unlike plot
- max limit: 50-55 label, and 50-55 line drawing objects in addition to already existing plots - both not affected by max plot outputs 64
- can only be used in the main chart
- can serve as the only output function - at least one is required: plot, barcolor, line, label etc.
- dynamic var values (including strings) can be output to screen as text using label.new and to_string
str = close >= open ? "up" : "down"
label.new(bar_index, high, text=str)
col = close >= open ? color.green : color.red
label.new(bar_index, na, "close = " + tostring(close), color=col, textcolor=color.white, style=label.style_labeldown, yloc=yloc.abovebar)
// create new objects, delete old ones
l = line.new(bar_index, high, bar_index , low , width=4)
line.delete(l )
// free object buffer by deleting old objects first, then create new ones
var l = na
line.delete(l)
l = line.new(bar_index, high, bar_index , low , width=4)

Turtle Trade Channels by KıvanÇ fr3762his trend following system was designed by Dennis Gartman and Bill Eckhart, and relies on breakouts of historical highs and lows to take and close trades: it is the complete opposite to the "buy low and sell high" approach. This trend following system was taught to a group of average and normal individuals, and almost everyone turned into a profitable trader.
The main rule is "Trade an N-day breakout and take profits when an M-day high or low is breached (N must me above M)". Examples:
Buy a 10-day breakout and close the trade when price action reaches a 5-day low.
Go short a 20-day breakout and close the trade when price action reaches a 10-day high.
In this indicator, the red line is the trading line, and the dotted blue line is the exit line. Original system is:
Go long when the trading line crosses below close price
Go short when the trading line rosses above close price
Exit long positions when the price touches the exit line
Exit short positions when the price touches the exit line
Recommended initial stop-loss is ATR * 2 from the opening price. Default system parameters were 20,10 and 55,20.
Original Turtle Rules:
To trade exactly like the turtles did, you need to set up two indicators representing the main and the failsafe system.
Set up the main indicator with TradePeriod = 20 and StopPeriod = 10 (A.k.a S1)
Set up the failsafe indicator with TradePeriod = 55 and StopPeriod = 20 using a different color. (A.k.a S2)
The entry strategy using S1 is as follows
Buy 20-day breakouts using S1 only if last signaled trade was a loss.
Sell 20-day breakouts using S1 only if last signaled trade was a loss.
If last signaled trade by S1 was a win, you shouldn't trade -Irregardless of the direction or if you traded last signal it or not-
The entry strategy using S2 is as follows:
Buy 55-day breakouts only if you ignored last S1 signal and the market is rallying without you
Sell 55-day breakouts only if you ignored last S1 signal and the market is pluging without you
The turtles had a progressive position sizing approach that boosted their winnings. Once a trading decision has been made you should...
Developers: Dennis Gartman and Bill Eckhart
İndikatörü geliştiren: Dennis Gartman and Bill Eckhart

Amazing Crossover System - 100+ pips per day!I got the main concept for this system on another site. While I have made one important change, I must stress that the heart of this system was created by someone else! We must give credit where credit is due!
Y'all know baby pips. @ForexPhantom published about this system and did both back and forward test around 10 years ago.
I found it on the sit and now I put it to code to see how it performs. I assume 10 points spread for every trade. I use Renesource or AxiTrader to get the low spreads.
There are 2 mods, the single trades and constant trading on the direction.
Main concept
Indicators
5 EMA -- YELLOW
10 EMA -- RED
RSI (10 - Apply to Median Price: HL/2) -- One level at 50.
TIME FRAME
1 Hour Only (very important!)
PAIRS
Virtually any pair seems to work as this is strictly technical analysis.
I recommend sticking to the main currencies and avoiding cross currencies (just his preference).
WHEN TO ENTER A TRADE
Enter LONG when the Yellow EMA crosses the Red EMA from underneath.
RSI must be approaching 50 from the BOTTOM and cross 50 to warrant entry.
Enter SHORT when the Yellow EMA crosses the Red EMA from the top.
RSI must be approaching 50 from the TOP and cross 50 to warrant entry.
I've attached a picture which demonstrates all these conditions.
That's it!
f.bpcdn.co

Trend Score by KIVANÇ fr3762Trend Score compares close prices between last close with previous closes by a certain period of time.
It's like momentum but gives a score +1 when close price is equal to or above (defaultly) 10 bars ago and gives a score of -1 when below.
calculation continues from default length to the 2 times of length.
Defaultly (for 10 bars length)
If Trend Score converges to 10; that means there's a strong uptrend
conversely if Trend Score converges to -10; that means a strong downtrend market is on.

JSE Wyckoff Wave Volume Code// The Stock Market Institute (SMI) describes an propriety indicator the "SMI Wyckoff Wave" for US Stocks. This code is an attempt to make a Wyckoff Wave for the Johannesburg Stock Exchange (JSE).
// The JSE Wyckoff Wave is in a separate code. This is the code for the volume of the wave. Please see code for the JSE Wyckoff Wave which goes with this indicator.
//
// The Wave presents a normalized price for the 10 selected stocks (An Index for the 10 stocks).
// The theory is to select stocks that are widely held, market leaders, actively traded and participate in important market moves.
// This is only my attempt to select 10 stocks and a different selection can be made.
// I am not certain how SMI determine their weightings but what I have done it to equalize the Rand value of the stock volumne so that moves are of equal magnitude.
// The then provides a view of the overall condition of the market and volume flow in the market.
//
// I have used the September 2018 price to normalize the stock price for the 10 selected stocks based. The stocks and weightings can be changed periodically depending on the performance and leadership.
//
// Please, let me know if there is a better work around this.
The stocks and their weightings are:
"JSE:BTI"/0.79
"JSE:SHP"/2.87
"JSE:NPN"/0.18
"JSE:AGL"/1.96
"JSE:SOL"/1.0
"JSE:CFR"/4.42
"JSE:MND"/1.40
"JSE:MTN"/7.63
"JSE:SLM"/7.29
"JSE:FSR"/8.25

JSE Wyckoff WaveThe Stock Market Institute (SMI) describes an propriety indicator the "SMI Wyckoff Wave" for US Stocks. This code is an attempt to make a Wyckoff Wave for the Johannesburg Stock Exchange (JSE). Once the wave has been established the volume can also be calculated. Please see code for the JSE Wyckoff Wave Volume which goes with this indicator.
The Wave presents a normalized price for the 10 selected stocks (An Index for the 10 stocks). The theory is to select stocks that are widely held, market leaders, actively traded and participate in important market moves. This is only my attempt to select 10 stocks and a different selection can be made. I am not certain how SMI determine their weightings but what I have done it to equalize the Rand value of the stock so that moves are of equal magnitude. The then provides a view of the overall condition of the market and volume flow in the market.
I have used the September 2018 price to normalize the stock price for the 10 selected stocks based. The stocks and weightings can be changed periodically depending on the performance and leadership.
Most Indecies when constructed assume that all high prices and all low prices happen at the same time and therefor inflate the wicks of the bars. To make the wave more representatives for the SMI Wyckoff Wave the price is determined on the 5 minute timeframe which removes this bias. However, TradingView does not calculate properly when selecting a lower timeframe than in current period. A work around is to call the sma of the highs and add these which provides more realistic tails. Please, let me know if there is a better work around this.
The stocks and their weightings are:
"JSE:BTI"*0.79
"JSE:SHP"*2.87
"JSE:NPN"*0.18
"JSE:AGL"*1.96
"JSE:SOL"*1.0
"JSE:CFR"*4.42
"JSE:MND"*1.40
"JSE:MTN"*7.63
"JSE:SLM"*7.29
"JSE:FSR"*8.25

OHLC Daily Resolution BandsShout out to nPE- for the idea.
Bands made with stdev from 10 day OHLC.
Keeps resolution to daily, so you can use bands as daily pivots for day trading.
Upper band 1=yesterday close + 0.5 std(ohlc,10)
Upper band 1=yesterday close + 1 std(ohlc,10)
Mid=yesterday close
Lower band 1=yesterday close - 0.5 std(ohlc,10)
Lower band 2=yesterday close - 1 std(ohlc,1

XPloRR MA-Buy ATR-Trailing-Stop Long Term Strategy Beating B&HXPloRR MA-Buy ATR-MA-Trailing-Stop Strategy
Long term MA Trailing Stop strategy to beat Buy&Hold strategy
None of the strategies that I tested can beat the long term Buy&Hold strategy. That's the reason why I wrote this strategy.
Purpose: beat Buy&Hold strategy with around 10 trades. 100% capitalize sold trade into new trade.
My buy strategy is triggered by the EMA(blue) crossing over the SMA curve(orange).
My sell strategy is triggered by another EMA(lime) of the close value crossing the trailing stop(green) value.
The trailing stop value(green) is set to a multiple of the ATR(15) value.
ATR(15) is the SMA(15) value of the difference between high and low values.
Every stock has it's own "DNA", so first thing to do is find the right parameters to get the best strategy values voor EMA, SMA and Trailing Stop.
Then keep using these parameter for future buy/sell signals only for that particular stock.
Do the same for other stocks.
Here are the parameters:
Exponential MA: buy trigger when crossing over the SMA value (use values between 11-50)
Simple MA: buy trigger when EMA crosses over the SMA value (use values between 20 and 200)
Stop EMA: sell trigger when Stop EMA of close value crosses under the trailing stop value (use values between 8 and 16)
Trailing Stop #ATR: defines the trailing stop value as a multiple of the ATR(15) value
Example parameters for different stocks (Start capital: 1000, Order=100% of equity, Period 1/1/2005 to now):
BAR(Barco): EMA=11, SMA=82, StopEMA=12, Stop#ATR=9
Buy&HoldProfit: 45.82%, NetProfit: 294.7%, #Trades:8, %Profit:62.5%, ProfitFactor: 12.539
AAPL(Apple): EMA=12, SMA=45, StopEMA=12, Stop#ATR=6
Buy&HoldProfit: 2925.86%, NetProfit: 4035.92%, #Trades:10, %Profit:60%, ProfitFactor: 6.36
BEKB(Bekaert): EMA=12, SMA=42, StopEMA=12, Stop#ATR=7
Buy&HoldProfit: 81.11%, NetProfit: 521.37%, #Trades:10, %Profit:60%, ProfitFactor: 2.617
SOLB(Solvay): EMA=12, SMA=63, StopEMA=11, Stop#ATR=8
Buy&HoldProfit: 43.61%, NetProfit: 151.4%, #Trades:8, %Profit:75%, ProfitFactor: 3.794
PHIA(Philips): EMA=11, SMA=80, StopEMA=8, Stop#ATR=10
Buy&HoldProfit: 56.79%, NetProfit: 198.46%, #Trades:6, %Profit:83.33%, ProfitFactor: 23.07
I am very curious to see the parameters for your stocks and please make suggestions to improve this strategy.

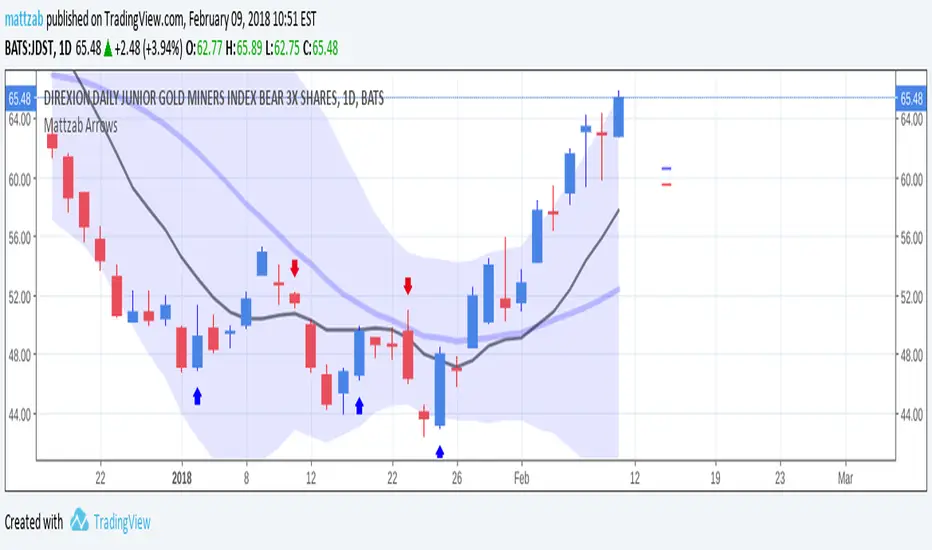
Mattzab ArrowsMattzab Arrows
THE BASICS
Buy and Sell Signal Arrows
Tack Marks to show how close the next opposite arrow might be- showing possible trend reversals
Standard Bollinger Bands
10-Day SMA Line
Configurable
Open Source
THE NITTY GRITTY
For starters, all values listed below can be changed in the settings. Length of time, as well as source, can be changed. For the Hidden EMA, this can be made visible by increasing its transparency.
ARROWS
The buy and sell signal arrows are based on price and MACD histogram.
The MACD settings are as follows: 10 day fast EMA , 20 day slow EMA , 5 day SMA signal smoothing. Instead of close price, we are using the average point of the day's high, low, and close.
For the arrows, current price and yesterday's price are using hl2 for high/low average.
A BUY arrow is created when:
Current Price IS GREATER THAN Previous Price _AND_ Current MACD Histogram IS GREATER THAN Previous MACD Histogram.
Important Note! Because the MACD Histogram repaints, the buy arrows may appear, then disappear later in the day, if the MACD changes. Check on the changelog to see if I've fixed it by the time you're reading this. (TradingView doesn't let you edit the description after it's been posted)
A SELL arrow is created when:
Current Price IS LESS THAN Previous Price _AND_ Current MACD Histogram IS LESS THAN Yesterday's MACD Histogram _AND_ Close Price is below _EITHER_ the Hidden EMA (default set to 4) _OR_ the Visible SMA (Default set to 10, which is the black line).
The hidden EMA can be made visible by increasing it's transparency in the Style tab.
Including the requirement to only sell if the standard conditions are met, PLUS being below one of those moving average lines, helps to prevent false sell arrows and repainting.
TACK MARKS
The Red Tack is the threshold, or barrier, for the next arrow. It will not move. It is based on previous High/Low/Close Price + MACD.
The Blue Tack is the current point in space for our average Price and MACD Delta Values. It will move throughout the day (or hour or minute depending on your resolution). The Blue Tack will give you an indication of how close or how far from the reversal threshold (Red Tack) the ticker is at that point.
While the Blue Tack is ABOVE Red, the most recent signal arrow will be a buy, and we are in a buy/hold period.
While the Blue Tack is BELOW Red, the most recent signal arrow will be a sell, and we are in a sell/wait period.
If the Blue Tack crosses above or below Red, you'll get the next arrow.
MOVING AVERAGE LINES
There are three moving average lines in this indicator.
The first is black, and is by default a 10-Day Simple Moving Average Line.
This black line is a good safeguard against selling too early. This is a good support line and that's how I use it.
The second is invisible, but can be made visible in the Styling, and is by default a 4-Day Exponential Moving Average Line
The third is the blue 20-Day Bollinger Band line.
BOLLINGER BANDS
The Bollinger Bands are unmodified and are just a background indicator for your use. If you prefer not to see the Bollinger Bands , change their transparency to 0% to hide them. I've cleaned up the Bollinger Bands to make the indicator as a whole- easier on the eyes.
Please leave feedback on how the script works for you, if you run into problems, if you have any changes you'd like to see, etc.
MACDouble + RSI (rec. 15min-2hr intrv) Uses two sets of MACD plus an RSI to either long or short. All three indicators trigger buy/sell as one (ie it's not 'IF MACD1 OR MACD2 OR RSI > 1 = buy", its more like "IF 1 AND 2 AND RSI=buy", all 3 match required for trigger)
The MACD inputs should be tweaked depending on timeframe and what you are trading. If you are doing 1, 3, 5 min or real frequent trading then 21/44/20 and 32/66/29 or other high value MACDs should be considered. If you are doing longer intervals like 2, 3, 4hr then consider 9/19/9 and 21/44/20 for MACDs (experiment! I picked these example #s randomly).
Ideal usage for the MACD sets is to have MACD2 inputs at around 1.5x, 2x, or 3x MACD1's inputs.
Other settings to consider: try having fastlength1=macdlength1 and then (fastlength2 = macdlength2 - 2). Like 10/26/10 and 23/48/20. This seems to increase net profit since it is more likely to trigger before major price moves, but may decrease profitable trade %. Conversely, consider FL1=MCDL1 and FL2 = MCDL2 + (FL2 * 0.5). Example: 10/26/10 and 22/48/30 this can increase profitable trade %, though may cost some net profit.
Feel free to message me with suggestions or questions.

Kay_BBandsV3This is the 3rd version of Kay_BBands.
When +DI (Directional Index ) is above -DI , then Upper band will be visible and vice-versa.
This is when the ADX is above the threshold. 28 is the default in this version. I found its more appealing in 5M time frame.
BLUE - ADX under 10
GREEN - Uptrend, ADX over 10
RED - Downtrend, ADX over 10
Use it with another band with setting 20, 0.6 deviation. Prices keeping above or below the 2nd bands upper or lower bounds shows trending conditions.
I didn't know how to update the old script so published it again.
Changes - :
1) Updated default settings for the indicator
2) ADX setting are now DI (28), ADX (10), adx level to check is 10.
3) IMPORTANT one - When DI is up/down, lower/upper band will also have color (more visible that way.)
Play around the settings.. It really eliminates extra indicator checking visually... Please like if you think idea is good.

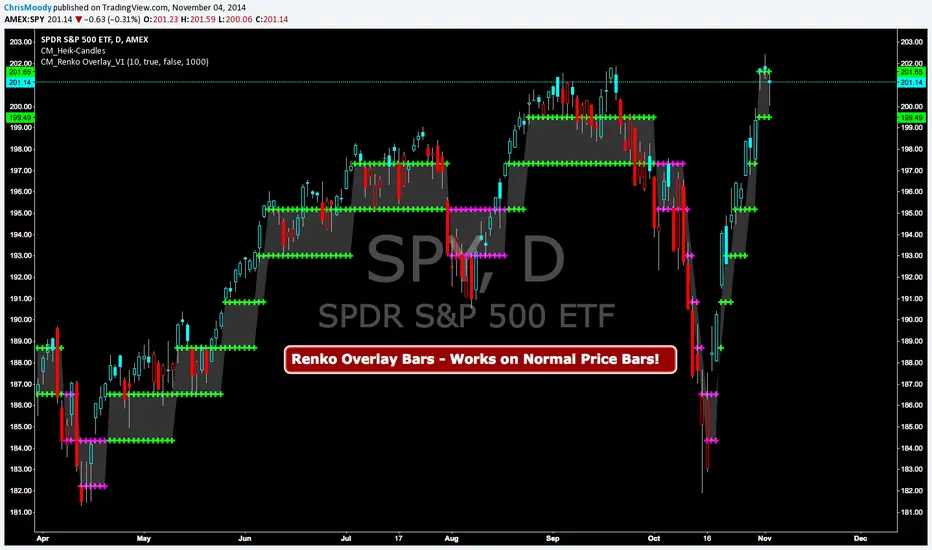
CM Renko Overlay BarsCM_Renko Overlay Bars V1
Overlays Renko Bars on Regular Price Bars.
Default Renko plot is based on Average True Range. Look Back period adjustable in Inputs Tab.
If you Choose to use "Traditional" Renko bars and pick the Size of the Renko Bars the please read below.
Value in Input Tab is multiplied by .001 (To work on Forex)
1 = 10 pips on EURUSD - 1 X .001 = .001 or 10 Pips
10 = .01 or 100 Pips
1000 = 1 point to the left of decimal. 1 Point in Stocks etc.
10000 = 10 Points on Stocks etc.
***V2 will fix this issue.
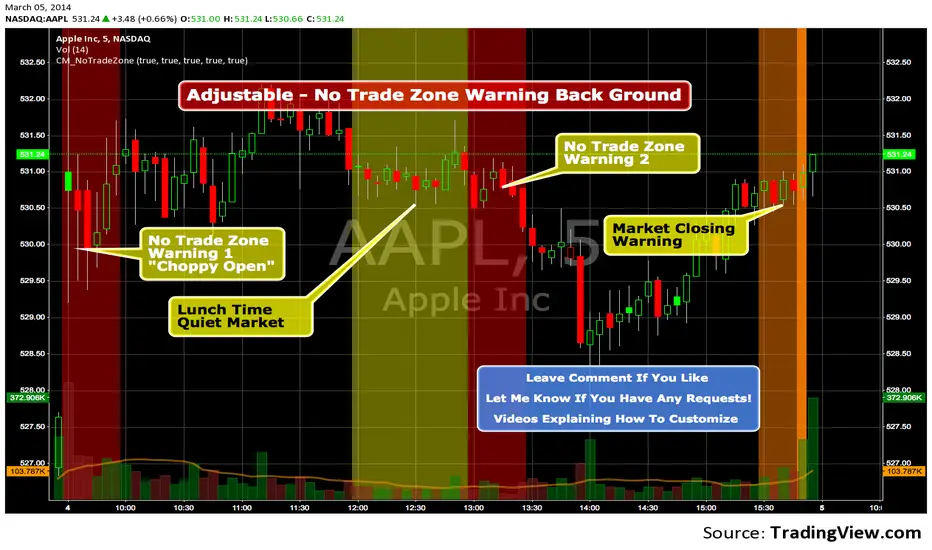
Custom Indicator - No Trade Zone Warning Back Ground Highlights!Years ago I did an analysis of my trades. Every period of the day was profitable except for two. From 10:00-1030, and 1:00 to 1:30. (I was actively Day Trading Futures) Imagine a vertical graph broken down in to 30 minute time segments. I had nice Green bars in every time slot (Showing Net Profits), and HUGE Red Bars from 10 to 10:30 and 1 to 1:30. After analysis I found I made consistent profits at session open, but then I would enter in to bad setups around 10 to make more money. I also found after I took lunch when I came back at 1:00 I would force trades instead of patiently waiting for a great trade setup. I created an indicator that plotted a red background around those times telling me I was not allowed to enter a trade. Profits went up!!! Details on How to adjust times are in 1st Post. You can adjust times and colors to meet your own trading needs.
Opening Range IndicatorComplete Trading Guide: Opening Range Breakout Strategy
What Are Opening Ranges?
Opening ranges capture the high and low prices during the first few minutes of market open. These levels often act as key support and resistance throughout the trading day because:
Heavy volume occurs at market open as overnight orders execute
Institutional activity is concentrated during opening minutes
Price discovery happens as market participants react to overnight news
Psychological levels are established that traders watch all day
Understanding the Three Timeframes
OR5 (5-Minute Range: 9:30-9:35 AM)
Most sensitive - captures immediate market reaction
Quick signals but higher false breakout rate
Best for scalping and momentum trading
Use for early entry when conviction is high
OR15 (15-Minute Range: 9:30-9:45 AM)
Balanced approach - most popular among day traders
Moderate sensitivity with better reliability
Good for swing trades lasting several hours
Primary timeframe for most strategies
OR30 (30-Minute Range: 9:30-10:00 AM)
Most reliable but slower signals
Lower false breakout rate
Best for position trades and trend following
Use when looking for major moves
Core Trading Strategies
Strategy 1: Basic Breakout
Setup:
Wait for price to break above OR15 high or below OR15 low
Enter on the breakout candle close
Stop loss: Opposite side of the range
Target: 2-3x the range size
Example:
OR15 range: $100.00 - $102.00 (Range = $2.00)
Long entry: Break above $102.00
Stop loss: $99.50 (below OR15 low)
Target: $104.00+ (2x range size)
Strategy 2: Multiple Confirmation
Setup:
Wait for OR5 break first (early signal)
Confirm with OR15 break in same direction
Enter on OR15 confirmation
Stop: Below OR30 if available, or OR15 opposite level
Why it works:
Multiple timeframe confirmation reduces false signals and increases probability of sustained moves.
Strategy 3: Failed Breakout Reversal
Setup:
Price breaks OR15 level but fails to hold
Wait for re-entry into the range
Enter reversal trade toward opposite OR level
Stop: Recent breakout high/low
Target: Opposite side of range + extension
Key insight: Failed breakouts often lead to strong moves in the opposite direction.
Advanced Techniques
Range Quality Assessment
High-Quality Ranges (Trade these):
Range size: 0.5% - 2% of stock price
Clean boundaries (not choppy)
Volume spike during range formation
Clear rejection at range levels
Low-Quality Ranges (Avoid these):
Very narrow ranges (<0.3% of stock price)
Extremely wide ranges (>3% of stock price)
Choppy, overlapping candles
Low volume during formation
Volume Confirmation
For Breakouts:
Look for volume spike (2x+ average) on breakout
Declining volume often signals false breakout
Rising volume during range formation shows interest
Market Context Filters
Best Conditions:
Trending market days (SPY/QQQ with clear direction)
Earnings reactions or news-driven moves
High-volume stocks with good liquidity
Volatility above average (VIX considerations)
Avoid Trading When:
Extremely low volume days
Major economic announcements pending
Holidays or half-days
Choppy, sideways market conditions
Risk Management Rules
Position Sizing
Conservative: Risk 0.5% of account per trade
Moderate: Risk 1% of account per trade
Aggressive: Risk 2% maximum per trade
Stop Loss Placement
Inside the range: Quick exit but higher stop-out rate
Outside opposite level: More room but larger risk
ATR-based: 1.5-2x Average True Range below entry
Profit Taking
Target 1: 1x range size (take 50% off)
Target 2: 2x range size (take 25% off)
Runner: Trail remaining 25% with moving stops
Specific Entry Techniques
Breakout Entry Methods
Method 1: Immediate Entry
Enter as soon as price closes above/below range
Fastest entry but highest false signal rate
Best for strong momentum situations
Method 2: Pullback Entry
Wait for breakout, then pullback to range level
Enter when price bounces off former resistance/support
Better risk/reward but may miss some moves
Method 3: Volume Confirmation
Wait for breakout + volume spike
Enter after volume confirmation candle
Reduces false signals significantly
Multiple Timeframe Entries
Aggressive: OR5 break → immediate entry
Conservative: OR5 + OR15 + OR30 all align → enter
Balanced: OR15 break with OR30 support → enter
Common Mistakes to Avoid
1. Trading Poor-Quality Ranges
❌ Don't trade ranges that are too narrow or too wide
✅ Focus on clean, well-defined ranges with good volume
2. Ignoring Volume
❌ Don't chase breakouts without volume confirmation
✅ Always check for volume spike on breakouts
3. Over-Trading
❌ Don't force trades when ranges are unclear
✅ Wait for high-probability setups only
4. Poor Risk Management
❌ Don't risk more than planned or use tight stops in volatile conditions
✅ Stick to predetermined risk levels
5. Fighting the Trend
❌ Don't fade breakouts in strongly trending markets
✅ Align trades with overall market direction
Daily Trading Routine
Pre-Market (8:00-9:30 AM)
Check overnight news and earnings
Review major indices (SPY, QQQ, IWM)
Identify potential opening range candidates
Set alerts for range breakouts
Market Open (9:30-10:00 AM)
Watch opening range formation
Note volume and price action quality
Mark key levels on charts
Prepare for breakout signals
Trading Session (10:00 AM - 4:00 PM)
Execute breakout strategies
Manage existing positions
Trail stops as profits develop
Look for additional setups
Post-Market Review
Analyze winning and losing trades
Review range quality vs. outcomes
Identify improvement areas
Prepare for next session
Best Stocks/ETFs for Opening Range Trading
Large Cap Stocks (Best for beginners):
AAPL, MSFT, GOOGL, AMZN, TSLA
High liquidity, predictable behavior
Good range formation most days
ETFs (Consistent patterns):
SPY, QQQ, IWM, XLF, XLE
Excellent liquidity
Clear range boundaries
Mid-Cap Growth (Advanced traders):
Stocks with good volume (1M+ shares daily)
Recent news catalysts
Clean technical patterns
Performance Optimization
Track These Metrics:
Win rate by range type (OR5 vs OR15 vs OR30)
Average R/R (risk vs reward ratio)
Best performing market conditions
Time of day performance
Continuous Improvement:
Keep detailed trade journal
Review failed breakouts for patterns
Adjust position sizing based on win rate
Refine entry timing based on backtesting
Final Tips for Success
Start small - Paper trade or use tiny positions initially
Focus on quality - Better to miss trades than take bad ones
Stay disciplined - Stick to your rules even during losing streaks
Adapt to conditions - What works in trending markets may fail in choppy conditions
Keep learning - Markets evolve, so should your approach
The opening range strategy is powerful because it captures natural market behavior, but like all strategies, it requires practice, discipline, and proper risk management to be profitable long-term.

INFLECTION NEXUS - SPAINFLECTION NEXUS - SPA (Shadow Portfolio Adaptive)
Foreword: The Living Algorithm
For decades, technical analysis has been a conversation between a trader and a static chart. We apply our indicators with their fixed-length inputs, and we hope that our rigid tools can somehow capture the essence of a market that is fluid, chaotic, and perpetually evolving. When our tools fail, we are told to "adapt." But what if the tools themselves could learn that lesson? What if our indicators could adapt not just for us, but with us?
This script, INFLECTION NEXUS - SPA, is the realization of that vision. It is an advanced analytical framework built around a revolutionary core: the Shadow Portfolio Adaptive (SPA) Engine . The buy and sell signals you see on the chart are an evolution of the logic from my previous work, "Turning Point." However, this is not a simple combination of two scripts. The SPA engine so fundamentally transforms the nature of the analysis that it creates an entirely new class of indicator. This publication is a showcase of that groundbreaking, self-learning engine.
This system is undeniably complex. When you first load it, the sheer volume of information may feel overwhelming. That is a testament to the depth of its analysis. This guide is designed to be your comprehensive manual, to break down every single component, every color, every number, into simple, understandable concepts. By the end of this document, you will not only master its functions but will also possess a deeper understanding of the market dynamics it is designed to reveal.
Chapter 1: The Paradigm Shift - Why the SPA Engine is a Leap Forward
To grasp the innovation here, we must first deconstruct the severe limitations of traditional "adaptive" indicators.
Part A: The Traditional Model - Driving by the Rear-View Mirror
Conventional "adaptive" systems are fundamentally reactive. They operate on a slow, inefficient loop: they wait for their own specific, biased signal to fire, wait for that trade to close, and only after a long and statistically significant "warm-up" period of 50-100 trades do they finally make a small, retrospective adjustment. They are always adapting to a market that no longer exists.
Part B: The SPA Model - The Proactive Co-Pilot
The Shadow Portfolio Adaptive (SPA) engine is a complete re-imagining of this process. It is not reactive; it is proactive, data-saturated, and instantly aware.
Continuous, Unbiased Learning: The SPA engine does not wait for a signal to learn. Its Shadow Portfolio is constantly running 5-bar long and short trades in the background. It learns from every single 5-bar slice of market action , giving it a continuous, unbiased stream of performance data. It is the difference between reading a textbook chapter and having a live sparring partner in the ring 24/7.
Instantaneous Market Awareness - The End of the "Warm-Up": This is the critical innovation. The SPA engine does not require a 100-trade warm-up period. The learning does not start after 50 trades; it begins on the 6th bar of the chart when the first shadow trade closes. From that moment on, the system is market-aware, analyzing data, and capable of making intelligent adjustments. The SPA engine is not adapting to old wins and losses. It is adapting, in near real-time, to the market's ever-shifting character, volatility, and personality.
Chapter 2: The Anatomy of the SPA Engine - A Granular Deep Dive
The engine is composed of three primary systems that work in a sophisticated, interconnected symphony.
Section 1: The Shadow Portfolio (The Information Harvester)
What it is, Simply: Think of this as the script's eyes and ears. It's a team of 10 virtual traders (5 long, 5 short) who are constantly taking small, quick trades to feel out the market.
How it Works, Simply: On every new bar, a new "long" trader and a new "short" trader enter the market. Exactly 5 bars later, they close their positions. This cycle is perpetual and relentless.
The Critical 'Why': Because these virtual traders enter and exit based on a fixed time (5 bars), not on a "good" or "bad" signal, their results are completely unbiased . They are simply measuring: "What happened to price over the last 5 bars?" This provides the raw, untainted truth about the market's behavior that the rest of the system needs to learn effectively.
The Golden Metric (ATR Normalization): The engine doesn't just look at dollar P&L. It's smarter than that. It asks a more intelligent question: "How much did this trade make relative to the current volatility?"
Analogy: Imagine a flea and an elephant. If they both jump 1 inch, who is more impressive? The flea. The SPA engine understands this. A $10 profit when the market is dead quiet is far more significant than a $10 profit during a wild, volatile swing.
The Formula: realized_atr = (close - trade.entry) / trade.atr_entry. It takes the raw profit and divides it by the Average True Range (a measure of volatility) at the moment of entry. This gives a pure, "apples-to-apples" score for every single trade, which is the foundational data point for all learning.
Section 2: The Cognitive Map (The Long-Term Brain)
What it is, Simply: This is the engine's deep memory, its library of experiences. Imagine a giant, 64-square chessboard (8x8 grid). Each square on the board represents a very specific type of market environment.
The Two Dimensions of Thought (The 'How'): How does it know which square we are on? It looks at two things:
The Market's Personality (X-Axis): Is the market behaving like a disciplined soldier, marching in a clear trend? Or is it like a chaotic, unpredictable child, running all over the place? The engine calculates a "Regime" score to figure this out.
The Market's Energy Level (Y-Axis): Is the market sleepy and quiet, or is it wide-awake and hyperactive? The engine measures "Normalized Volatility" to determine this.
The Power of Generalization (The 'Why'): When a Shadow Portfolio trade closes, its result is recorded in the corresponding square on the chessboard. But here's the clever part: it also shares a little bit of that lesson with the squares immediately next to it (using a Gaussian Kernel).
Analogy: If you touch a hot stove and learn "don't touch," your brain is smart enough to know you probably shouldn't touch the hot oven door next to it either, even if you haven't touched it directly. The Cognitive Map does the same thing, allowing it to make intelligent inferences even in market conditions it has seen less frequently. Each square remembers what indicator settings worked best in that specific environment.
Section 3: The Adaptive Engine (The Central Nervous System)
What it is, Simply: This is the conductor of the orchestra. It takes information from all other parts of the system and decides exactly what to do.
The Symphony of Inputs: It listens to three distinct sources of information before making a decision:
The Short-Term Memory (Rolling Stats): It looks at the performance of the last rollN shadow trades. This is its immediate, recent experience.
The Long-Term Wisdom (Cognitive Map): It consults the grand library of the Cognitive Map to see what has worked best in the current market type over the long haul.
The Gut Instinct (Bin Learning): It keeps a small "mini-batch" of the most recent trades. If this batch shows a very strong, sudden pattern, it can trigger a rapid, reflexive adjustment, like pulling your hand away from a flame.
The Fusion Process: It then blends these three opinions together in a sophisticated way. It gives more weight to the opinions it's more confident in (e.g., a Cognitive Map square with hundreds of trades of experience) and uses your Adaptation Intensity (dialK) input to decide how much to listen to its "gut instinct." The final decision is then smoothed to ensure the indicator's parameters change in a stable, intelligent way.
Chapter 3: The Control Panel - A Novice's Guide to Every Input
This is the most important chapter. Let's break down what these confusing settings actually do in the simplest terms possible.
--- SECTION 1: THE DRIVER'S SEAT (SIGNAL ENGINE & BASE SETTINGS) ---
🧾 Signal Engine (Turning Point):
What it is: These are the rules for the final BUY and SELL signs.
Think of it like this: The SPA engine is the smart robot that tunes your race car. These settings are you, the driver, telling the robot what kind of race you're in.
Enable Reversal Mode: You tell the robot, "I want to race on a curvy track with lots of turns." The robot will tune the car to be agile for catching tops and bottoms.
Enable Breakout Mode: You tell the robot, "I want to race on a long, straight track." The robot will tune the car for pure speed to follow the trend.
Require New Extreme: This is a quality filter. It tells the driver, "Don't look for a turn unless we've just hit a new top speed on the straightaway." It makes sure the reversal is from a real extreme.
Min Bars Between Signals: This is the "pit stop" rule. You're telling the robot, "After you show me a sign, wait at least 10 bars before showing another one, so I don't get confused."
⚡ ATR Bands (Base Inputs):
What they are: These are the starting settings for your car before the robot starts tuning it. These are your factory defaults.
Sensitivity: This is the "Bump Detector." A low number means the car feels every tiny pebble on the road. A high number means it only notices the big speed bumps. You want to set it so it notices the important bumps (real market structure) but ignores the pebbles (noise).
ATR Period & Multiplier: These set the starting size of the "safety lane" (the green and blue bands) around your car. The robot's main job is to constantly adjust the size of this safety lane to perfectly fit the current road conditions.
📊 & 📈 Filter Settings (RSI & Volume):
What they are: These are your co-pilot's confirmation checks.
Enable RSI Filter: Your co-pilot will check the "Engine Temperature" (RSI). He won't let you hit the gas (BUY) if the engine is already overheating (overbought).
RSI Length & Lookbacks: These tune how your co-pilot's temperature gauge works. The defaults are standard.
Require Volume Spike: Your co-pilot will check the "Crowd Noise" (Volume). He won't give you a signal unless he hears the crowd roar, confirming that a lot of people are interested in this move.
🎯 Signal Quality Control:
Enable Major Levels Only: This tells your co-pilot to be extra picky. He will only confirm signals that happen after a huge, powerful move, ignoring all the small stuff.
--- SECTION 2: THE ROBOT'S BRAIN (ENGINE & LEARNING CONTROLS) ---
🎛️ Master Control:
Adaptation Intensity (dialK): THIS IS THE ROBOT'S PERSONALITY DIAL.
Turn it DOWN (1-5): The robot becomes a "Wise Old Professor." It thinks very slowly and carefully, gathers lots of data, and only makes a change when it is 100% sure. Its advice is very reliable but might come a little late.
Turn it UP (15-20): The robot becomes a "Hyper-Reactive Teenager." It has a short attention span, reacts instantly to everything it sees, and changes its mind constantly. It's super-fast to new information but might get faked out a lot.
The Default (10): A "Skilled Professional." The perfect balance of thoughtful and responsive. Start here.
🧠 Adaptive Engine:
Enable Adaptive System: This is the main power button for your robot. Turn it off, and you're driving a normal, non-smart car. Turn it on, and the robot takes over the tuning.
Use Shadow Cycle: This turns on the robot's "practice laps." The robot can't learn without practicing. This must be on for the robot to work.
Lock ATR Bands: This is a visual choice. "Locked" means the safety lanes on your screen stay where your factory defaults put them (the robot still makes changes to the signals in the background). "Unlocked" means you see the safety lanes moving and changing shape in real-time as the robot tunes them.
🎯 Learning (Global + Risk):
What they are: These are the deep-level settings for how your robot's brain processes information.
Rolling Window Size: This is the robot's "Short-Term Memory." How many of the last few practice laps should it remember? A small number means it only cares about what just happened. A big number means it remembers the last hour of practice.
Learn Rate & Smooth Alpha: This is "How big of a change should the robot make?" and "How smoothly should it make the change?" Think of it as turning the steering wheel. A high learn rate is like yanking the wheel; a low one is like a gentle turn. The smoothing makes sure the turn is graceful.
WinRate Thresholds & PnL Cap: These are rules for the robot's learning. They tell it what a "good" or "bad" outcome looks like and tell it to ignore crazy, once-in-a-lifetime events so its memory doesn't get corrupted.
--- SECTION 3: THE GARAGE (RISK, MEMORY & VISUALS) ---
⚠️ Risk Management:
What they are: These are safety rules you can give to your co-pilot for your own awareness. They appear on the dashboard.
The settings: You can set a max number of trades, a max loss for the day, and a "time out" period after a few losses.
Apply Risk to Shadow: This is an important switch. If you turn this ON, your safety rules also apply to the robot's practice laps. If you hit your max loss, the robot stops practicing and learning. It's recommended to leave this OFF so the robot can learn 24/7, even if you have stopped trading.
🗺️ Cognitive Map, STM & Checkpoints:
What it is: The robot's "Long-Term Memory" or its entire library of racing experience.
Use Cognitive Map & STM: These switches turn on the long-term and short-term memory banks. You want these on for the smartest robot.
Map Settings (Grid, Sigma, Half-Life): These are very advanced settings for neuroscientists. They control how the robot's brain is structured and how it forgets old information. The defaults are expertly tuned.
The Checkpoint System: This is the "Save Your Game" button for the robot.
To Save: Check Emit Checkpoint Now. Go to your alert log, and you will see a very long password. Copy this password.
To Load: Paste that password into the Memory Checkpoint box. Then, check Apply Checkpoint On Next Bar. The robot will instantly download all of its saved memories and experience.
🎨 Visuals & 🧩 Display Params:
What they are: These are all about how your screen looks.
You can control everything: The size and shape of the little diamonds (Entry Orbs), whether you see the purple Adapt Pulse, and where the Dashboards appear on your screen. You can change the Theme to Dark, Light, or Neon. These settings don't change how the robot thinks, only how it presents its information to you.
Chapter 4: The Command Center - Decoding the Dashboard
PANEL A (INFLECTION NEXUS): Your high-level mission control, showing the engine's classification of the current Market Context and the performance summary of the Shadow Portfolio.
PANEL B (SHADOW PORTFOLIO ADAPTIVE): Your deep diagnostic screen.
Performance Metrics: View advanced risk-adjusted stats like the Sharpe Ratio to understand the quality of the market movements the engine is learning from.
Adaptive Parameters (Live vs Base): THIS IS THE MOST CRITICAL SECTION. It shows the engine's Live parameters right next to your (Base) inputs. When the Live values deviate, the engine is communicating its learned wisdom to you. For example, a Live ATR Multiplier of 2.5 versus your Base of 1.4 is the engine telling you: "Caution. The market is currently experiencing high fake-outs and requires giving positions more room to breathe." This section is a direct translation of the engine's learning into actionable insight.
Chapter 5: Reading the Canvas - On-Chart Visuals
The Bands (Green/Blue Lines): These are not static Supertrend lines. They are the physical manifestation of the engine's current thinking. As the engine learns and adapts its ATR Period and Multiplier, you will see these bands widen, tighten, and adjust their distance from price. They are alive.
The Labels (BUY/SELL): These are the final output of the "Turning Point" logic, now supercharged and informed by the fully adaptive SPA engine.
The Purple Pulse (Dot and Background Glow): This is your visual cue that the engine is "thinking." Every time you see this pulse, it means the SPA has just completed a learning cycle and updated its parameters. It is actively recalibrating itself to the market.
Chapter 6: A Manifesto on Innovation and Community
I want to conclude with a personal note on why I dedicate countless hours to building systems like this and sharing them openly.
My purpose is to drive innovation, period. I am not in this space to follow the crowd or to re-package old ideas. The world does not need a 100th version of a slightly modified MACD. Real progress, real breakthroughs, come from venturing into the wilderness, from asking "what if?" and from pursuing concepts that lie at the very edge of possibility.
I am not afraid of being wrong. I am not afraid of being bested by my peers. In fact, I welcome it. If another developer takes an idea from this engine, improves it, and builds something even more magnificent, that is a profound win for our entire community. The only failure I recognize is the failure to try. The only trap I fear is the creative complacency of producing sterile, recycled work just to appease the status quo.
I love this community, and I believe with every fiber of my being that we have barely scratched the surface of what can be discovered and created. This script is my contribution to that shared journey. It is a tool, an idea, and a challenge to all of us: let's keep pushing.
DISCLAIMER: This script is an advanced analytical tool provided for educational and research purposes ONLY. It does not constitute financial advice. All trading involves substantial risk of loss. Past performance is not indicative of future results. Please use this tool responsibly and as part of a comprehensive trading plan.
As the great computer scientist Herbert A. Simon, a pioneer of artificial intelligence, famously said:
"Learning is any process by which a system improves performance from experience."
*Tooltips were updated with a comprehensive guide
May this engine enhance your experience.
— Dskyz, for DAFE Trading Systems

Multi-Symbol RSI/ADX Monitor# 📊 Multi-Symbol RSI/ADX Monitor + EMA Trend Analyzer
### 🔹 Smart Trend Analyzer with Golden/Death Cross Signals + Multi-Symbol Scanner
---
## 📌 Overview
The **Multi-Symbol RSI/ADX Monitor + EMA Trend Analyzer** combines **trend detection**, **crossover signals**, and a **multi-asset strength scanner** into a single tool.
- 🔹 **EMA Trend Analyzer** → Detects strong/weak bullish & bearish phases based on price vs EMAs, slope, and crossovers.
- 🔹 **RSI/ADX Scanner** → Monitors up to **10 custom tickers** in a dynamic table for relative strength & momentum.
- 🔹 **Alerts** → Catch **Strong Trends** or **Golden/Death Crosses** instantly.
Perfect for traders who want to track **trend bias** on their main chart while scanning **other assets for confirmation**.
---
## ✨ Key Features
### 🔹 EMA Trend Analyzer
- ✅ Plots **Fast EMA (20)** & **Slow EMA (50)**.
- ✅ Main **Trend EMA (100)** with slope confirmation.
- ✅ Detects **5 Market States**:
- 🟢 Strong Bullish (Green)
- 🟢 Moderate Bullish (Lime)
- 🟠 Moderate Bearish (Orange)
- 🔴 Strong Bearish (Red)
- ⚪ Neutral / Sideways (Gray)
- ✅ Highlights **Golden Cross** & **Death Cross**:
- 🎯 Golden Cross → Fast EMA crosses above Slow EMA (Green dot + label)
- 🎯 Death Cross → Fast EMA crosses below Slow EMA (Red dot + label)
- ✅ Dynamic **trend label** on the right edge (shows trend + crossover info).
- ✅ Optional **background shading** by trend strength.
---
### 🔹 Multi-Symbol RSI/ADX Monitor
- ✅ Track up to **10 tickers** simultaneously.
- ✅ Calculates **RSI & ADX** per symbol on the current chart’s timeframe.
- ✅ **Table display** with flexible position (top, middle, bottom).
- ✅ Highlights assets meeting both **RSI ≥ Threshold** & **ADX ≥ Threshold**.
- ✅ Handles empty slots gracefully → `"No symbols selected"`.
---
### 🔹 Alerts
- 📢 **Strong Bullish Trend**
- 📢 **Strong Bearish Trend**
- 📢 **Golden Cross (EMA Fast > Slow)**
- 📢 **Death Cross (EMA Fast < Slow)**
---
## 📖 How to Use
1. **EMA Analyzer**
- Enable *“Show Trend Direction”* to see EMA-based market bias.
- Look for **color-coded labels** & **background shading** to guide bias.
- Watch for **Golden/Death Cross dots** as entry/exit signals.
2. **RSI/ADX Scanner**
- Enter up to **10 tickers** (e.g., `NASDAQ:AAPL`, `BINANCE:BTCUSDT`).
- Adjust **RSI/ADX Lengths & Thresholds** to match your strategy.
- Monitor the **table panel** for which markets show **strong trend confirmation**.
3. **Alerts**
- Add alerts to catch **trend shifts** or **crossovers** without watching charts 24/7.
---
## 🎯 Best For
- ✅ Trend traders
- ✅ Swing traders
- ✅ Multi-asset confluence trading
- ✅ Traders using **EMA + RSI + ADX confirmation**
---
## ⚠️ Disclaimer
This script is for **educational purposes only**.
It is **not financial advice**. Please trade responsibly.
---

主力资金进出监控器Main Capital Flow Monitor-MEWINSIGHTMain Capital Flow Monitor Indicator
Indicator Description
This indicator utilizes a multi-cycle composite weighting algorithm to accurately capture the movement of main capital in and out of key price zones. The core logic is built upon three dimensions:
Multi-Cycle Pressure/Support System
Using triple timeframes (500-day/250-day/90-day) to calculate:
Long-term resistance lines (VAR1-3): Monitoring historical high resistance zones
Long-term support lines (VAR4-6): Identifying historical low support zones
EMA21 smoothing is applied to eliminate short-term fluctuations
Dynamic Capital Activity Engine
Proprietary VARD volatility algorithm:
VARD = EMA
Automatically amplifies volatility sensitivity by 10x when price approaches the safety margin (VARA×1.35), precisely capturing abnormal main capital movements
Capital Inflow Trigger Mechanism
Capital entry signals require simultaneous fulfillment of:
Price touching 30-day low zone (VARE)
Capital activity breaking recent peaks (VARF)
Weighted capital flow verified through triple EMA:
Capital Entry = EMA / 618
Visualization:
Green histogram: Continuous main capital inflow
Red histogram: Abnormal daily capital movement intensity
Column height intuitively displays capital strength
Application Scenarios:
Consecutive green columns → Main capital accumulation at bottom
Sudden expansion of red columns → Abnormal main capital rush
Continuous fluctuations near zero axis → Main capital washing phase
Core Value:
Provides 1-3 trading days early warning of main capital movements, suitable for:
Medium/long-term investors identifying main capital accumulation zones
Short-term traders capturing abnormal main capital breakouts
Risk control avoiding main capital distribution phases
Parameter Notes: Default parameters are optimized through historical A-share market backtesting. Users can adjust cycle parameters according to different market characteristics (suggest extending cycles by 20% for European/American markets).
Formula Features:
Multi-timeframe weighted synthesis technology
Dynamic sensitivity adjustment mechanism
Main capital activity intensity quantification
Early warning function for capital movements
Suitable Markets:
Stocks, futures, cryptocurrencies and other financial markets with obvious main capital characteristics.
指标名称:主力资金进出监控器
指标描述:
本指标通过多周期复合加权算法,精准捕捉主力资金在关键价格区域的进出动向。核心逻辑基于三大维度构建:
多周期压力/支撑体系
通过500日/250日/90日三重时间框架,分别计算:
长期压力线(VAR1-3):监控历史高位阻力区
长期支撑线(VAR4-6):识别历史低位承接区
采用EMA21平滑处理,消除短期波动干扰
动态资金活跃度引擎
独创VARD波动率算法:
当价格接近安全边际(VARA×1.35)时自动放大波动敏感度10倍,精准捕捉主力异动
资金进场触发机制
资金入场信号需同时满足:
价格触及30日最低区域(VARE)
资金活跃度突破近期峰值(VARF)
通过三重EMA验证的加权资金流:
资金入场 = EMA / 618
可视化呈现:
绿色柱状图:主力资金持续流入
红色柱状图:当日资金异动量级
柱体高度直观显示资金强度
使用场景:
绿色柱体连续出现 → 主力底部吸筹
红色柱体突然放大 → 主力异动抢筹
零轴附近持续波动 → 主力洗盘阶段
核心价值:
提前1-3个交易日预警主力资金动向,适用于:
中长线投资者识别主力建仓区间
短线交易者捕捉主力异动突破
风险控制规避主力出货阶段
参数说明:默认参数经A股历史数据回测优化,用户可根据不同市场特性调整周期参数(建议欧美市场延长周期20%)
Measured Move Volume XIndicator Description
The "Measured Move Volume X" indicator, developed for TradingView using Pine Script version 6, projects potential price targets based on the measured move concept, where the magnitude of a prior price leg (Leg A) is used to forecast a subsequent move. It overlays translucent boxes on the chart to visualize bullish (green) or bearish (red) price projections, extending them to the right for a user-specified number of bars. The indicator integrates volume analysis (relative to a simple moving average), RSI for momentum, and VWAP for price-volume weighting, combining these into a confidence score to filter entry signals, displayed as triangles on breakouts. Horizontal key level lines (large, medium, small) are drawn at significant price points derived from the measured moves, with customizable thresholds, colors, and styles. Exhaustion hints, shown as orange labels near box extremes, indicate potential reversal points. Anomalous candles, marked with diamond shapes, are identified based on volume spikes and body-to-range ratios. Optional higher timeframe candle coloring enhances context. The indicator is fully customizable through input groups for lookback periods, transparency, and signal weights, making it adaptable to various assets and timeframes.
Adjustment Tips for Optimization
To optimize the "Measured Move Volume X" indicator for specific assets or timeframes, adjust the following input parameters:
Leg A Lookback (default: 14 bars): Increase to 20-30 for volatile markets (e.g., cryptocurrencies) to capture larger price swings; decrease to 5-10 for intraday charts (e.g., stocks) for faster signals.
Extend Box to the Right (default: 30 bars): Extend to 50+ for daily or weekly charts to project further targets; shorten to 10-20 for lower timeframes to reduce clutter.
Volume SMA Length (default: 20) and Relative Volume Threshold (default: 1.5): Lower the threshold to 1.2-1.3 for low-volume assets (e.g., commodities) to detect subtler spikes; raise to 2.0+ for high-volume equities to filter noise. Match SMA length to RSI length for consistency.
RSI Parameters (default: length 14, overbought 70, oversold 30): Set overbought to 80 and oversold to 20 in trending markets to reduce premature exit signals; shorten length to 7-10 for scalping.
Key Level Thresholds (default: large 10%, medium 5%, small 5%): Increase thresholds (e.g., large to 15%) for volatile assets to focus on significant moves; disable medium or small lines to declutter charts.
Confidence Score Weights (default: volume 0.5, VWAP 0.3, RSI 0.2): Increase volume weight (e.g., 0.7) for volume-driven markets like futures; emphasize RSI (e.g., 0.4) for momentum-focused strategies.
Anomaly Detection (default: volume multiplier 1.5, small body ratio 0.2, large body ratio 0.75): Adjust the volume multiplier higher for stricter anomaly detection in noisy markets; fine-tune body-to-range ratios based on asset-specific candle patterns.
Use TradingView’s replay feature to test adjustments on historical data, ensuring settings suit the chosen market and timeframe.
Tips for Using the Indicator
Interpreting Signals: Green upward triangles indicate bullish breakout entries when price exceeds the prior high with a confidence score ≥40; red downward triangles signal bearish breakouts. Use these to identify potential entry points aligned with the projected box targets.
Box Projections: Bullish boxes project upward targets (top of box) equal to the prior leg’s height added to the breakout price; bearish boxes project downward. Monitor price action near box edges for target completion or reversal.
Exhaustion Hints: Orange labels near box tops (bullish) or bottoms (bearish) suggest potential exhaustion when price deviates within the set percentage (default: 5%) and RSI or volume conditions are met. Use these as cues to watch for reversals.
Key Level Lines: Large, medium, and small lines mark significant price levels from box tops/bottoms. Use these as potential support/resistance zones, especially when drawn with high volume (colored differently).
Anomaly Candles: Orange diamonds highlight candles with unusual volume/body characteristics, indicating potential reversals or pauses. Combine with box levels for context.
Higher Timeframe Coloring: Enable to color bars based on higher timeframe candle closures (e.g., 1, 2, 5, or 15 minutes) for added trend context.
Customization: Toggle "Only Show Bullish Moves" to focus on bullish setups. Adjust transparency and line styles for visual clarity. Test settings to balance signal frequency and chart readability.
Inputs: Organized into groups (e.g., "Measured Move Settings") using input.int, input.float, input.color, and input.bool for user customization, with tooltips for clarity.
Calculations: Computes relative volume (ta.sma(volume, volLookback)), VWAP (ta.vwap(hlc3)), RSI (ta.rsi(close, rsiLength)), and prior leg extremes (ta.highest/lowest) using prior bar data ( ) to prevent repainting.
Boxes and Lines: Creates boxes (box.new) for bullish/bearish projections and lines (line.new) for key levels. The f_addLine function manages line arrays (array.new_line), capping at maxLinesCount to avoid clutter.
Confidence Score: Combines volume, VWAP distance, and RSI into a weighted score (confScore), filtering entries (≥40). Rounded for display.
Exhaustion Hints: Functions like f_plotBullExitHint assess price deviation, RSI, and volume decrease, using label.new for dynamic orange labels.
Entry Signals and Plots: plotshape displays triangles for breakouts; plot and hline show VWAP and RSI levels; request.security handles higher timeframe coloring.
Anomaly Detection: Identifies candles with small-body high-volume or large-body average-volume patterns via ratios, plotted as diamonds.

Swing Oracle Stock 2.0- Gradient Enhanced# 🌈 Swing Oracle Pro - Advanced Gradient Trading Indicator
**Transform your technical analysis with stunning gradient visualizations that make market trends instantly recognizable.**
## 🚀 **What Makes This Indicator Special?**
The **Swing Oracle Pro** revolutionizes traditional technical analysis by combining advanced NDOS (Normalized Distance from Origin of Source) calculations with a sophisticated gradient color system. This isn't just another indicator—it's a complete visual trading experience that adapts colors based on market strength, making trend identification effortless and intuitive.
## 🎨 **10 Professional Gradient Themes**
Choose from carefully crafted color schemes designed for optimal visual clarity:
- **🌅 Sunset** - Warm oranges and purples for classic elegance
- **🌊 Ocean** - Cool blues and teals for calm analysis
- **🌲 Forest** - Natural greens and browns for organic feel
- **✨ Aurora** - Ethereal greens and magentas for mystique
- **⚡ Neon** - Vibrant electric colors for high-energy trading
- **🌌 Galaxy** - Deep purples and cosmic hues for night sessions
- **🔥 Fire** - Intense reds and golds for volatile markets
- **❄️ Ice** - Cool whites and blues for clear-headed decisions
- **🌈 Rainbow** - Full spectrum for comprehensive analysis
- **⚫ Monochrome** - Professional grays for focused trading
## 📊 **Core Features**
### **Advanced NDOS System**
- Normalized Distance from Origin of Source calculation with 231-period length
- Smoothed with customizable EMA for reduced noise
- Multi-timeframe confirmation with H1 filter option
- Dynamic gradient coloring based on oscillator position
### **Intelligent Visual Feedback**
- **Primary Gradient Line** - Main NDOS plot with dynamic color transitions
- **Gradient Fill Zones** - Beautiful color-coded areas for bullish, neutral, and bearish regions
- **Smart Transparency** - Colors adjust intensity based on market volatility
- **Dynamic Backgrounds** - Subtle gradient backgrounds that respond to market conditions
### **Enhanced EMA Projection System**
- 75/760 period EMA normalization with 50-period lookback
- Gradient-colored projection line for trend forecasting
- Toggleable display with advanced gradient controls
- Price tracking for precise level identification
### **Multi-Timeframe Analysis Table**
- Real-time trend analysis across 6 timeframes (1m, 3m, 5m, 15m, 1H, 4H)
- Gradient-colored cells showing trend strength
- Customizable table size and position
- Professional emoji indicators (🚀 UP, 📉 DOWN, ➡️ FLAT)
### **Signal System**
- **Gradient Buy Signals** - Triangle up arrows with intensity-based coloring
- **Gradient Sell Signals** - Triangle down arrows with strength indicators
- **Alert Conditions** - Built-in alerts for all signal types
- **7-Day Cycle Tracking** - Tuesday-to-Tuesday weekly cycle visualization
## ⚙️ **Customization Controls**
### **🎨 Gradient Controls**
- **Gradient Intensity** - Adjust color vibrancy (0.1-1.0)
- **Gradient Smoothing** - Control color transition smoothness (1-10 periods)
- **Dynamic Background** - Toggle animated background gradients
- **Advanced Gradients** - Enable/disable EMA projection and enhanced features
### **🛠️ Custom Color System**
- **Bullish Colors** - Define custom start/end colors for bull markets
- **Bearish Colors** - Set personalized bear market gradients
- **Full Theme Override** - Create completely custom color schemes
- **Real-time Preview** - See changes instantly on your chart
## 📈 **How to Use**
1. **Choose Your Theme** - Select from 10 professional gradient themes
2. **Configure Levels** - Adjust high/low levels (default 60/40) for your timeframe
3. **Set Smoothing** - Fine-tune gradient smoothing for your trading style
4. **Enable Features** - Toggle background gradients, candlestick coloring, and advanced EMA projection
5. **Monitor Signals** - Watch for gradient buy/sell arrows and multi-timeframe confirmations
## 🎯 **Trading Applications**
- **Swing Trading** - Perfect for identifying medium-term trend changes
- **Scalping** - Multi-timeframe table provides quick trend confirmation
- **Position Sizing** - Gradient intensity shows signal strength for risk management
- **Market Analysis** - Beautiful visualizations make complex data instantly understandable
- **Education** - Ideal for learning market dynamics through visual feedback
## ⚡ **Performance Optimized**
- **Smart Rendering** - Colors update only on significant changes
- **Efficient Calculations** - Optimized algorithms for smooth performance
- **Memory Management** - Minimal resource usage even with complex gradients
- **Real-time Updates** - Responsive to market changes without lag
## 🚨 **Alert System**
Built-in alert conditions notify you when:
- NDOS crosses above high level (Buy Signal)
- NDOS crosses below low level (Sell Signal)
- Multi-timeframe confirmations align
- Customizable alert messages with emoji indicators
## 🔧 **Technical Specifications**
- **PineScript Version**: v6 (Latest)
- **Overlay**: True (plots on main chart)
- **Calculations**: NDOS, EMA normalization, volatility-based transparency
- **Timeframes**: Compatible with all timeframes
- **Markets**: Stocks, Forex, Crypto, Commodities, Indices
## 💡 **Why Choose Swing Oracle Pro?**
This isn't just another technical indicator—it's a complete visual transformation of your trading experience. The gradient system provides instant visual feedback that traditional indicators simply can't match. Whether you're a beginner learning to read market trends or an experienced trader seeking clearer signals, the Swing Oracle Pro delivers professional-grade analysis with unprecedented visual clarity.
**Experience the future of technical analysis. Your charts will never look the same.**
---
*⚠️ Disclaimer: This indicator is for educational and informational purposes only. Past performance does not guarantee future results. Always conduct your own research and consider risk management before making trading decisions.*
**🔔 Like this indicator? Please leave a comment and boost! Your feedback helps improve future updates.**
---
**📝 Tags:** #GradientTrading #SwingTrading #NDOS #MultiTimeframe #TechnicalAnalysis #VisualTrading #TrendAnalysis #ColorCoded #ProfessionalCharts #TradingToo

Composite Time ProfileComposite Time Profile Overlay (CTPO) - Market Profile Compositing Tool
Automatically composite multiple time periods to identify key areas of balance and market structure
What is the Composite Time Profile Overlay?
The Composite Time Profile Overlay (CTPO) is a Pine Script indicator that automatically composites multiple time periods to identify key areas of balance and market structure. It's designed for traders who use market profile concepts and need to quickly identify where price is likely to find support or resistance.
The indicator analyzes TPO (Time Price Opportunity) data across different timeframes and merges overlapping profiles to create composite levels that represent the most significant areas of balance. This helps you spot where institutional traders are likely to make decisions based on accumulated price action.
Why Use CTPO for Market Profile Trading?
Eliminate Manual Compositing Work
Instead of manually drawing and compositing profiles across different timeframes, CTPO does this automatically. You get instant access to composite levels without spending time analyzing each individual period.
Spot Areas of Balance Quickly
The indicator highlights the most significant areas of balance by compositing overlapping profiles. These areas often act as support and resistance levels because they represent where the most trading activity occurred across multiple time periods.
Focus on What Matters
Rather than getting lost in individual session profiles, CTPO shows you the composite levels that have been validated across multiple timeframes. This helps you focus on the levels that are most likely to hold.
How CTPO Works for Market Profile Traders
Automatic Profile Compositing
CTPO uses a proprietary algorithm that:
- Identifies period boundaries based on your selected timeframe (sessions, daily, weekly, monthly, or auto-detection)
- Calculates TPO profiles for each period using the C2M (Composite 2 Method) row sizing calculation
- Merges overlapping profiles using configurable overlap thresholds (default 50% overlap required)
- Updates composite levels as new price action develops in real-time
Key Levels for Market Profile Analysis
The indicator displays:
- Value Area High (VAH) and Value Area Low (VAL) levels calculated from composite TPO data
- Point of Control (POC) levels where most trading occurred across all composited periods
- Composite zones representing areas of balance with configurable transparency
- 1.618 Fibonacci extensions for breakout targets based on composite range
Multiple Timeframe Support
- Sessions: For intraday market profile analysis
- Daily: For swing trading with daily profiles
- Weekly: For position trading with weekly structure
- Monthly: For long-term market profile analysis
- Auto: Automatically selects timeframe based on your chart
Trading Applications for Market Profile Users
Support and Resistance Trading
Use composite levels as dynamic support and resistance zones. These levels often hold because they represent areas where significant trading decisions were made across multiple timeframes.
Breakout Trading
When composite levels break, they often lead to significant moves. The indicator calculates 1.618 Fibonacci extensions to give you clear targets for breakout trades.
Mean Reversion Strategies
Value Area levels represent the price range where most trading activity occurred. These levels often act as magnets, drawing price back when it moves too far from the mean.
Institutional Level Analysis
Composite levels represent areas where institutional traders have made significant decisions. These levels often hold more weight than traditional technical analysis levels because they're based on actual trading activity.
Key Features for Market Profile Traders
Smart Compositing Logic
- Automatic overlap detection using price range intersection algorithms
- Configurable overlap thresholds (minimum 50% overlap required for merging)
- Dead composite identification (profiles that become engulfed by newer composites)
- Real-time updates as new price action develops using barstate.islast optimization
Visual Customization
- Customizable colors for active, broken, and dead composites
- Adjustable transparency levels for each composite state
- Premium/Discount zone highlighting based on current price vs composite range
- TPO aggression coloring using TPO distribution analysis to identify buying/selling pressure
- Fibonacci level extensions with 1.618 target calculations based on composite range
Clean Chart Presentation
- Only shows the most relevant composite levels (maximum 10 active composites)
- Eliminates clutter from individual session profiles
- Focuses on areas of balance that matter most to current price action
Real-World Trading Examples
Day Trading with Session Composites
Use session-based composites to identify intraday areas of balance. The VAH and VAL levels often act as natural profit targets and stop-loss levels for scalping strategies.
Swing Trading with Daily Composites
Daily composites provide excellent swing trading levels. Look for price reactions at composite zones and use the 1.618 extensions for profit targets.
Position Trading with Weekly Composites
Weekly composites help identify major trend changes and long-term areas of balance. These levels often hold for months or even years.
Risk Management
Composite levels provide natural stop-loss levels. If a composite level breaks, it often signals a significant shift in market sentiment, making it an ideal place to exit losing positions.
Why Composite Levels Work
Composite levels work because they represent areas where significant trading decisions were made across multiple timeframes. When price returns to these levels, traders often remember the previous price action and make similar decisions, creating self-fulfilling prophecies.
The compositing process uses a proprietary algorithm that ensures only levels validated across multiple time periods are displayed. This means you're looking at levels that have proven their significance through actual market behavior, not just random technical levels.
Technical Foundation
The indicator uses TPO (Time Price Opportunity) data combined with price action analysis to identify areas of balance. The C2M row sizing method ensures accurate profile calculations, while the overlap detection algorithm (minimum 50% price range intersection) ensures only truly significant composites are displayed. The algorithm calculates row size based on ATR (Average True Range) divided by 10, then converts to tick size for precise level calculations.
How the Code Actually Works
1. Period Detection and ATR Calculation
The code first determines the appropriate timeframe based on your chart:
- 1m-5m charts: Session-based profiles
- 15m-2h charts: Daily profiles
- 4h charts: Weekly profiles
- 1D charts: Monthly profiles
For each period type, it calculates the number of bars needed for ATR calculation:
- Sessions: 540 minutes divided by chart timeframe
- Daily: 1440 minutes divided by chart timeframe
- Weekly: 7 days worth of minutes divided by chart timeframe
- Monthly: 30 days worth of minutes divided by chart timeframe
2. C2M Row Size Calculation
The code calculates True Range for each bar in the determined period:
- True Range = max(high-low, |high-prevClose|, |low-prevClose|)
- Averages all True Range values to get ATR
- Row Size = (ATR / 10) converted to tick size
- This ensures each TPO row represents a meaningful price movement
3. TPO Profile Generation
For each period, the code:
- Creates price levels from lowest to highest price in the range
- Each level is separated by the calculated row size
- Counts how many bars touch each price level (TPO count)
- Finds the level with highest count = Point of Control (POC)
- Calculates Value Area by expanding from POC until 68.27% of total TPO blocks are included
4. Overlap Detection Algorithm
When a new profile is created, the code checks if it overlaps with existing composites:
- Calculates overlap range = min(currentVAH, prevVAH) - max(currentVAL, prevVAL)
- Calculates current profile range = currentVAH - currentVAL
- Overlap percentage = (overlap range / current profile range) * 100
- If overlap >= 50%, profiles are merged into a composite
5. Composite Merging Logic
When profiles overlap, the code creates a new composite by:
- Taking the earliest start bar and latest end bar
- Using the wider VAH/VAL range (max of both profiles)
- Keeping the POC from the profile with more TPO blocks
- Marking the composite as "active" until price breaks through
6. Real-Time Updates
The code uses barstate.islast to optimize performance:
- Only recalculates on the last bar of each period
- Updates active composite with live price action if enabled
- Cleans up old composites to prevent memory issues
- Redraws all visual elements from scratch each bar
7. Visual Rendering System
The code uses arrays to manage drawing objects:
- Clears all lines/boxes arrays on every bar
- Iterates through composites array to redraw everything
- Uses different colors for active, broken, and dead composites
- Calculates 1.618 Fibonacci extensions for broken composites
Getting Started with CTPO
Step 1: Choose Your Timeframe
Select the period type that matches your trading style:
- Use "Sessions" for day trading
- Use "Daily" for swing trading
- Use "Weekly" for position trading
- Use "Auto" to let the indicator choose based on your chart timeframe
Step 2: Customize the Display
Adjust colors, transparency, and display options to match your charting preferences. The indicator offers extensive customization options to ensure it fits seamlessly into your existing analysis.
Step 3: Identify Key Levels
Look for:
- Composite zones (blue boxes) - major areas of balance
- VAH/VAL lines - value area boundaries
- POC lines - areas of highest trading activity
- 1.618 extension lines - breakout targets
Step 4: Develop Your Strategy
Use these levels to:
- Set entry points near composite zones
- Place stop losses beyond composite levels
- Take profits at 1.618 extension levels
- Identify trend changes when major composites break
Perfect for Market Profile Traders
If you're already using market profile concepts in your trading, CTPO eliminates the manual work of compositing profiles across different timeframes. Instead of spending time analyzing each individual period, you get instant access to the composite levels that matter most.
The indicator's automated compositing process ensures you're always looking at the most relevant areas of balance, while its real-time updates keep you informed of changes as they happen. Whether you're a day trader looking for intraday levels or a position trader analyzing long-term structure, CTPO provides the market profile intelligence you need to succeed.
Streamline Your Market Profile Analysis
Stop wasting time on manual compositing. Let CTPO do the heavy lifting while you focus on executing profitable trades based on areas of balance that actually matter.
Ready to Streamline Your Market Profile Trading?
Add the Composite Time Profile Overlay to your charts today and experience the difference that automated profile compositing can make in your trading performance.

Volumatic Fair Value Gaps [BigBeluga]🔵 OVERVIEW
The Volumatic Fair Value Gaps indicator detects and plots size-filtered Fair Value Gaps (FVGs) and immediately analyzes the bullish vs. bearish volume composition inside each gap. When an FVG forms, the tool samples volume from a 10× lower timeframe , splits it into Buy and Sell components, and overlays two compact bars whose percentages always sum to 100%. Each gap also shows its total traded volume . A live dashboard (top-right) summarizes how many bullish and bearish FVGs are currently active and their cumulative volumes—offering a quick read on directional participation and trend pressure.
🔵 CONCEPTS
FVGs (Fair Value Gaps) : Imbalance zones between three consecutive candles where price “skips” trading. The script plots bullish and bearish gaps and extends them until mitigated.
Size Filtering : Only significant gaps (by relative size percentile) are drawn, reducing noise and emphasizing meaningful imbalances.
// Gap Filters
float diff = close > open ? (low - high ) / low * 100 : (low - high) / high *100
float sizeFVG = diff / ta.percentile_nearest_rank(diff, 1000, 100) * 100
bool filterFVG = sizeFVG > 15
Volume Decomposition : For each FVG, the indicator inspects a 10× lower timeframe and aggregates volume of bullish vs. bearish candles inside the gap’s span.
100% Split Bars : Two inline bars per FVG display the % Bull and % Bear shares; their total is always 100%.
Total Gap Volume : A numeric label at the right edge of the FVG shows the total traded volume associated with that gap.
Mitigation Logic : Gaps are removed when price closes through (or touches via high/low—user-selectable) the opposite boundary.
Dashboard Summary : Counts and sums the active bullish/bearish FVGs and their total volumes to gauge directional dominance.
🔵 FEATURES
Bullish & Bearish FVG plotting with independent color controls and visibility toggles.
Adaptive size filter (percentile-based) to keep only impactful gaps.
Lower-TF volume sampling at 10× faster resolution for more granular Buy/Sell breakdown.
Per-FVG volume bars : two horizontal bars showing Bull % and Bear % (sum = 100%).
Per-FVG total volume label displayed at the right end of the gap’s body.
Mitigation source option : choose close or high/low for removing/invalidating gaps.
Overlap control : older overlapped gaps are cleaned to avoid clutter.
Auto-extension : active gaps extend right until mitigated.
Dashboard : shows count of bullish/bearish gaps on chart and cumulative volume totals for each side.
Performance safeguards : caps the number of active FVG boxes to maintain responsiveness.
🔵 HOW TO USE
Turn on/off FVG types : Enable Bullish FVG and/or Bearish FVG depending on your focus.
Tune the filter : The script already filters by relative size; if you need fewer (stronger) signals, increase the percentile threshold in code or reduce the number of displayed boxes.
Choose mitigation source :
close — stricter; gap is removed when a closing price crosses the boundary.
high/low — more sensitive; a wick through the boundary mitigates the gap.
Read the per-FVG bars :
A higher Bull % inside a bullish gap suggests constructive demand backing the imbalance.
A higher Bear % inside a bearish gap suggests supply is enforcing the imbalance.
Use total gap volume : Larger totals imply more meaningful interest at that imbalance; confluence with structure/HTF levels increases relevance.
Watch the dashboard : If bullish counts and cumulative volume exceed bearish, market pressure is likely skewed upward (and vice versa). Combine with trend tools or market structure for entries/exits.
Optional: hide volume bars : Disable Volume Bars when you want a cleaner FVG map while keeping total volume labels and the dashboard.
🔵 CONCLUSION
Volumatic Fair Value Gaps blends precise FVG detection with lower-timeframe volume analytics to show not only where imbalances exist but also who powers them. The per-gap Bull/Bear % bars, total volume labels, and the cumulative dashboard together provide a fast, high-signal read on directional participation. Use the tool to prioritize higher-quality gaps, align with trend bias, and time mitigations or continuations with greater confidence.
