6x EMA Set (5/20/50/100/200/300)This Pine Script indicator utilizes six Exponential Moving Averages (5, 20, 50, 100, 200, and 300 EMA) to visualize market trends and support/resistance levels across multiple timeframes on a single chart. The code is highly customizable, allowing the user to input and adjust the period length and color for each EMA directly within the indicator settings. The calculation engine uses Pine Script v5's optimized ta.ema() function to compute each average based on the closing price, with the EMA formula naturally weighting recent price action more heavily. This multi-layered structure enables the trader to quickly compare short-term momentum (Fast EMAs) against long-term structural trends (Slow EMAs).
Wyszukaj w skryptach "北证50+股票+新浪财经"

21-50-100 EMA Crossover indicatorSimple EMA crossover indicator visualizing 21-50-100 EMA crossovers.
RSI + EMA Dynamic Zones + Volume + Divergence (with RSI 50 line)RSI + EMA Dynamic Zones + Volume + Divergence (with RSI 50 line)

2t's MA 50, MA 150, ATRThis indicator displays three key technical signals on the chart:
SMA 50 – Short-term trend direction
SMA 150 – Medium-term trend direction
ATR – Market volatility (Average True Range)
Line colors and lengths can be customized in the settings.
The ATR is plotted on the same chart for quick volatility reference without needing a separate panel.
This tool is designed for traders who want a clean, lightweight view of trend strength and volatility in a single indicator.

10/20 EMA 50/100/200 SMA — by mijoomoCreated by mijoomo.
This indicator combines EMA 10 & EMA 20 with SMA 50/100/200 in one clean package.
Each moving average is toggleable, fully labeled, and alert-compatible.
Designed for traders who want a simple and effective multi-MA trend tool.

10/20 EMA 50/100/200 SMA — by mijoomoCreated by mijoomo.
This indicator combines EMA 10 & EMA 20 with SMA 50/100/200 in one clean package.
Each moving average is toggleable, fully labeled, and alert-compatible.
Designed for traders who want a simple and effective multi-MA trend tool.


EMA 50/200 Signals with Price-Arrows✔ Plots EMA 50 and EMA 200
✔ Displays arrows when a crossover occurs (signals)
✔ Creates alerts for TradingView
✔ Works for crypto, forex, and stocks

MA Suite 10/50/150/200 + Legend (v6)ma 10 50 150 200 that i have made with chat gpt to help find moving avarage

BB Breakout + EMA Touch (50/100)Shows points only when BOTH happen on the same candle:
1️⃣ Price breaks through Bollinger Bands
2️⃣ Price touches (or crosses) EMA 50 or EMA 100

Vertical Lines: 5, 20, 50, 200 Days Back - 30 minutesVerticals lines to indicate 5, 20, 50, and 200 day marks on a 30 minute chart. Used in Swing trading with multi-timeframe approach to mark the levels.
Generated using Claude.

EMA 50/100/200 Trend BandsEMA Trend Bands is a clean and powerful trend-structure tool built around the classic 50/100/200 EMA stack.
It provides an intuitive, color-coded view of market conditions by identifying when the trend is bullish, bearish, or neutral based on EMA alignment.
This indicator is designed for traders who want a simple, objective trend filter without the clutter of extra signals or repainting logic.

EMA H/L 20-50 Table + RSI - KHALID ALADDIN🧾 Description
EMA H/L 20-50 Table + RSI — by Khalid Aladdin
A clean and minimal indicator designed for traders and analysts who prefer a quick glance at essential EMA values without any extra clutter on the chart.
📊 Features:
Displays precise values of EMA20 (High & Low) and EMA50 (High & Low) in a compact table below the chart.
Automatically updates values based on the current timeframe.
Includes RSI reading for momentum tracking.
Large, clear text with dark-theme friendly colors.
No lines or drawings — only a clean data panel.
✅ Perfect for:
Technical analysts, swing traders, and long-term investors who want an uncluttered view of trend levels and momentum strength.

Simple EMA Cloud 20/50Shades the area between the 20 and 50 EMAs.
That's all it does, but combined with other indicators like the MACD, it gives you clear indications of entries and exits.
AND, it has no calories. What more could you ask for?


Nifty 50 Weighted Volume IndicatorThis takes the volume of the cash market as per the composite weighted average of the Nifty 50 Components.
You can use this at your discretion to take calls on Index trades.

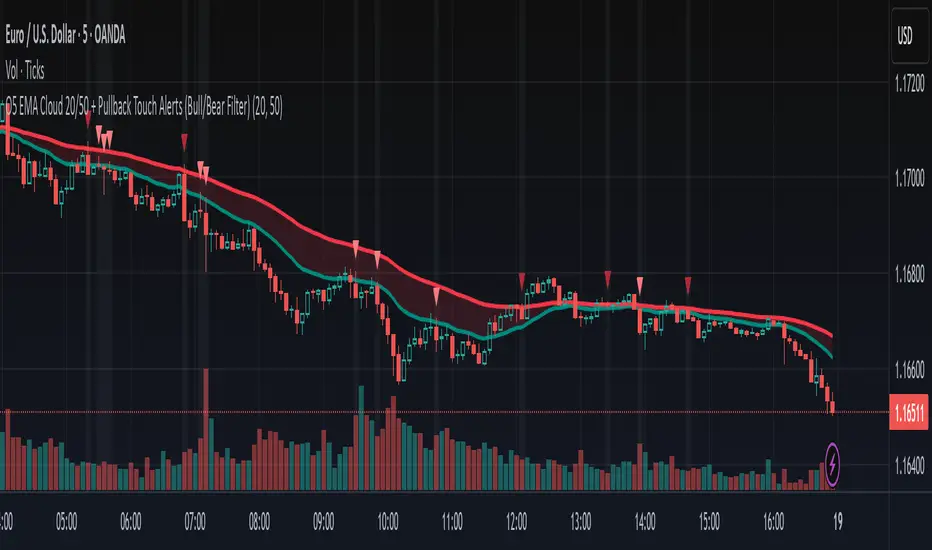
O5 EMA Cloud 20/50 + Pullback Touch Alerts (Bull/Bear Filter)This indicator shows an EMA cloud that is set to Fast=20 and Slow=50 by default, but can be changed.
It features suggested entry signals when price pulls back to either EMA level in both uptrends and downtrends.
Buy signals print only when price pulls back to one of the EMA levels and closes up.
Bearish signals only print when price pulls back to one of the EMA levels and closes down.
EMA 8/50/200I set it up so that three EMAs are displayed within a single indicator window.
このスクリプトでは、3本のEMA(8間・50期間・200期間)を1つのインジケータ枠で表示しています。

SMA 20 50 100A clean and lightweight SMA indicator that plots 20, 50, and 100 simple moving averages with customizable colors and line widths. Includes an optional label showing the latest SMA values for quick reference. Ideal for trend confirmation and swing trading setups.

Simple Moving Averages (20, 50, 100)A clean and lightweight SMA indicator that plots 20, 50, and 100 simple moving averages with customizable colors and line widths. Includes an optional label showing the latest SMA values for quick reference. Ideal for trend confirmation and swing trading setups.

Nifty 50 Scalping - Bullish Buy & Bearish Sell (5 Target / 2 SL)Nifty 50 Scalping - Bullish Buy & Bearish Sell (5 Target / 2 SL)

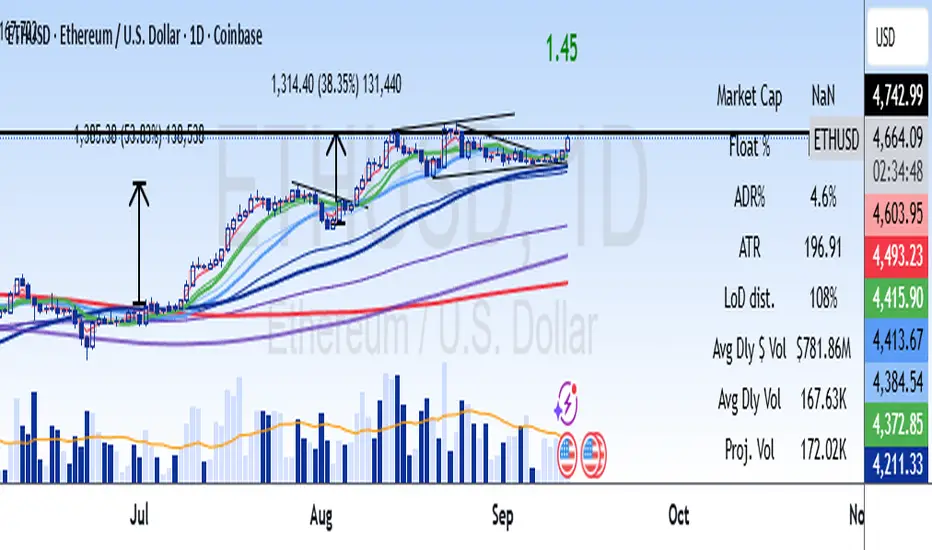
Distance from 50 SMA in ADR TermsIndicator produces a multiple of ADR% from the 50-day simple moving average to determine is a stock or etf is extended.