RSI 30-50-70 moving averageDescription:
The RSI 30-50-70 Moving Average indicator plots three distinct moving averages based on different RSI ranges (30%, 50%, and 70%). Each moving average corresponds to different market conditions and provides potential entry and exit signals. Here's how it works:
• RSI_30 Range (25%-35%): The moving average of closing prices when the RSI is between 25% and 35%, representing potential oversold conditions.
• RSI_50 Range (45%-55%): The moving average of closing prices when the RSI is between 45% and 55%, providing a balanced perspective for trend-following strategies.
• RSI_70 Range (65%-75%): The moving average of closing prices when the RSI is between 65% and 75%, representing potential overbought conditions.
This indicator offers flexibility, as users can adjust key parameters such as RSI ranges, periods, and time frames to fine-tune the signals for their trading strategies.
How it Works:
Like traditional moving averages, the RSI 30-50-70 Moving Averages can highlight dynamic levels of support and resistance. They offer additional insight by focusing on specific RSI ranges, providing early signals for trend reversals or continuation. The default settings can be used across various assets but should be optimized via backtesting.
Default Settings:
• RSI_30: 25% to 35% (Oversold Zone, yellow line)
• RSI_50: 45% to 55% (Neutral/Trend Zone, green line)
• RSI_70: 65% to 75% (Overbought Zone, red line)
• RSI Period: 14
Buy Conditions:
• Use the 5- or 15-minute time frame.
• Wait for the price to move below the RSI_30 line, indicating potential oversold conditions.
• Enter a buy order when the price closes above the RSI_30 line, signaling a recovery from the oversold zone.
• For a more conservative approach, use the RSI_50 line as the buy signal to confirm a trend reversal.
• Important: Before entering, ensure that the RSI_30 moving average has flattened or started to level off, signaling that the oversold momentum has slowed.
Sell Conditions:
• Use the 5- or 15-minute time frame.
• Wait for the price to close above the RSI_70 line, indicating potential overbought conditions.
• Enter a sell order when the price closes below the RSI_70 line, signaling a decline from the overbought zone.
• Important: Similar to buying, wait for the RSI_70 moving average to flatten or level off before selling, indicating the overbought conditions are stalling.
Key Features:
1. Dynamic Range Customization: The indicator allows users to modify the RSI ranges and periods, tailoring the moving averages to fit different market conditions or asset classes.
2. Trend-Following and Reversal Signals: The RSI 30-50-70 moving averages provide both reversal and trend-following signals, making it a versatile tool for short-term traders.
3. Visual Representation of Market Strength: By plotting moving averages based on RSI levels, traders can visually interpret the market’s strength and potential turning points.
4. Risk Management: The built-in flexibility allows traders to choose lower-risk entries by adjusting which RSI level (e.g., RSI_30 vs. RSI_50) they rely on for signals.
Practical Use:
Different assets respond uniquely to RSI-based moving averages, so it's recommended to backtest and adjust ranges for specific instruments. For example, volatile assets may require wider RSI ranges, while more stable assets could benefit from tighter ranges.
Checking for Buy conditions:
1st: Wait for current price to go below the RSI_30 (yellow line)
2nd: Wait and observe for bullish divergence
3rd: RSI_30 has flattened indicating potential gain of momentum after a bullish divergence.
4th: Enter a buy order when the price closed above the RSI_30, preferably when a green candle appeared.
Wyszukaj w skryptach "北证50+股票+新浪财经"

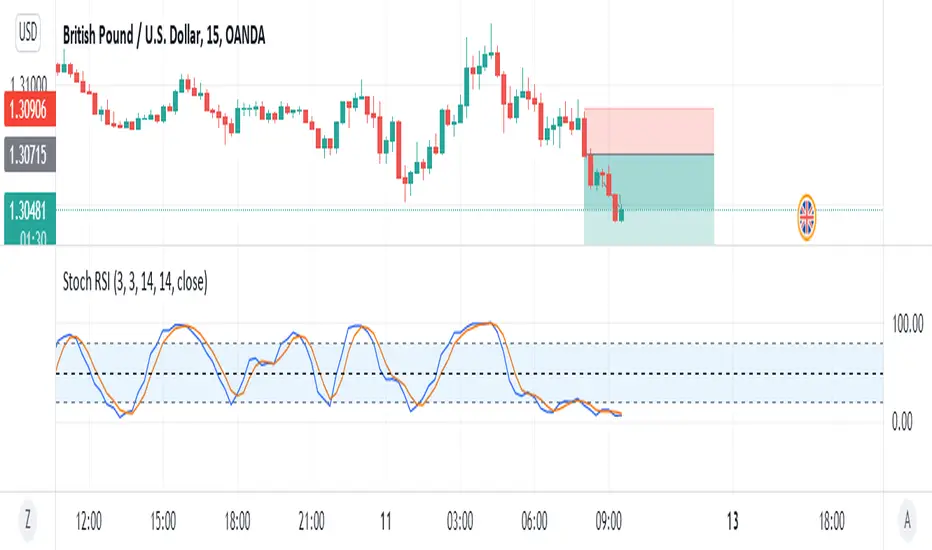
Stochastic RSI (50 Line)This Stoch RSI has a 50 line to help determine if the momentum is going up or down. Under 50, down and above 50 is up.
MultipSMMA 5-9-13-21-35-50-100 @trueenight //@version=4
study("MultipSMMA 5-9-13-21-35-50-100", overlay = true)
getSma(src, len) =>
float smma = 0.0000000
// len = input(7, minval=1, title="Length")
// src = input(close, title="Source")
smma := na(smma ) ? sma(src, len) : (smma * (len - 1) + src) / len
//plot(smma, color=color.red)
smma
plot(getSma(close, input(5, "Sma 5 ")),"sma5", color=#ff0000)
plot(getSma(close, input(9, "Sma 9 ")),"sma9", color=#ff4d00)
plot(getSma(close, input(13, "Sma 13 ")),"sma13", color=#ff9800)
// plot(sma18,"sma18", color=color.green)
plot(getSma(close, input(21, "Sma 21 ")),"sma21", color=#c27ba0, linewidth=3)
plot(getSma(close, input(35, "Sma 35 ")),"sma35", color=#00ffff)
plot(getSma(close, input(50, "Sma 50 ")),"sma50", color=#ff00ff, linewidth=3)
plot(getSma(close, input(100, "Sma 100 ")),"sma100", color=color.yellow, linewidth=3)
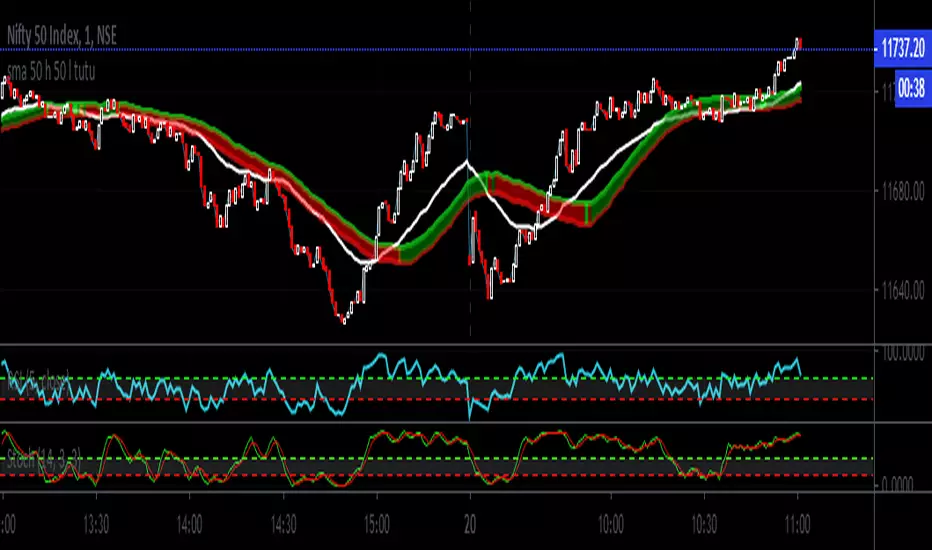
Simple Moving Average 20,50,100This SMA Script is modified and is based on 3 bands which are of 20 days, 50 days, 100 days average line.
This is a very appropriate for Indian Markets.
**How to Use :**
***BUY***
When the chart pattern is as follows :-
- SMA 200 (Black)
- SMA 50 (Red)
- SMA 20 (Green)
- "Last Traded Price"
***SELL***
When the chart pattern is as follows :-
- "Last Traded Price"
- SMA 20 (Green)
- SMA 50 (Red)
- SMA 200 (Black)
And Book Good Profits!!!

EMA 5/10/21 SMA 50/100/200The Script is mixture of both EMAs and SMAs. EMA 5/10/21 are powerful indicators for short term providing more weightage to the recent prices. SMA 50/100/200 provide the long term view.
5 Day EMA: This is a sign of strong momentum. It tracks the trend in the short term time frame. This is support in the strongest up trends. This line can only be used in low volatility trends with strong momentum. A break back above this line is a sign for me that an uptrend may be resuming. I primarily use it as an end of day trailing stop. It is rare that this line does not break intraday, even in the strongest trending markets.
• 10 day EMA: The 10 day EMA is a great moving average to use to keep you on the right side of the major market trend. It is usually the first line to be lost before any real trouble begins. It can be used as a standalone signal in some stocks and markets that tend to trend strongly in one direction for long periods.
• 21 day EMA: This is the intermediate term moving average. It is generally the last line of support in a volatile uptrend. To me, it is the inevitable reversion to the mean in a market when it finally pulls back after an extended trend.
• 50 day SMA: This is the line that strong leading stocks typically pull back to. This is usually the support level for strong uptrends. It is normal for uptrending markets to pull back to this line and find support. Most bull markets and uptrends will pull back to this level. It is generally a great “Buy the dip” level.
• 100 day SMA: This is the line that provides the support between the 50 day and the 200 day. If it does not hold as support, there is a high probability that the 200 day SMA is the next stop. This is the deeper pullback level in bull markets and uptrends. It usually presents a great risk/reward ratio in bull markets.
• 200 day SMA: Bulls like to buy dips when markets are trading above the 200 day moving average, while bears sell rallies short below it. Bears usually win below this line, as the 200 day becomes longer term resistance, and bulls buy pullbacks to the 200 day as long as the price stays above it. This line is one of the biggest signals in the market telling you which side to be on. Bull above, Bear below. Bad things happen to stocks and markets when this line is lost.

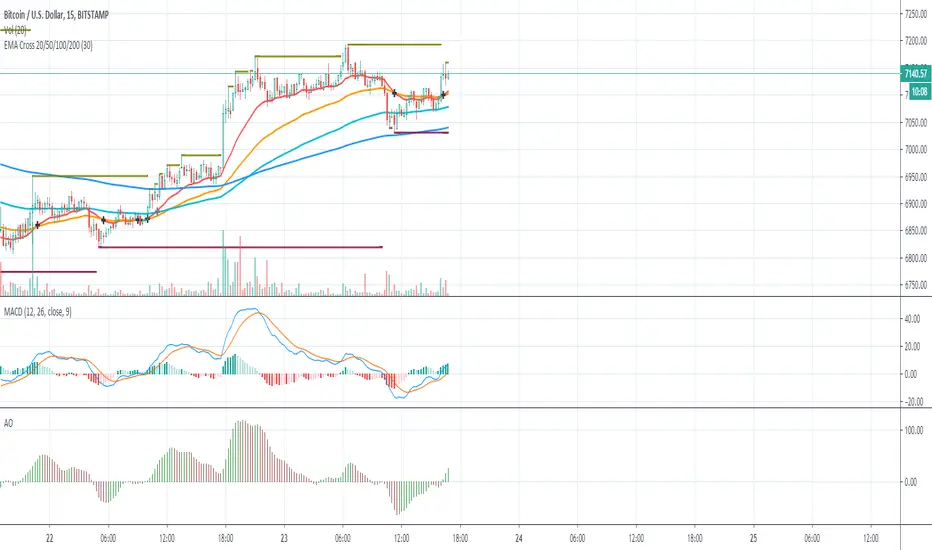
EMA Cross 20/50/100/200EMA Cross 20 50 100 200
Easy identify cross between 20 and 50
Easy identify cross between 20 and 100
Cross between 20 and 50 is good signal for buy and sell.
Cross between 20 and 100 is confirmation signal for buy and sell.
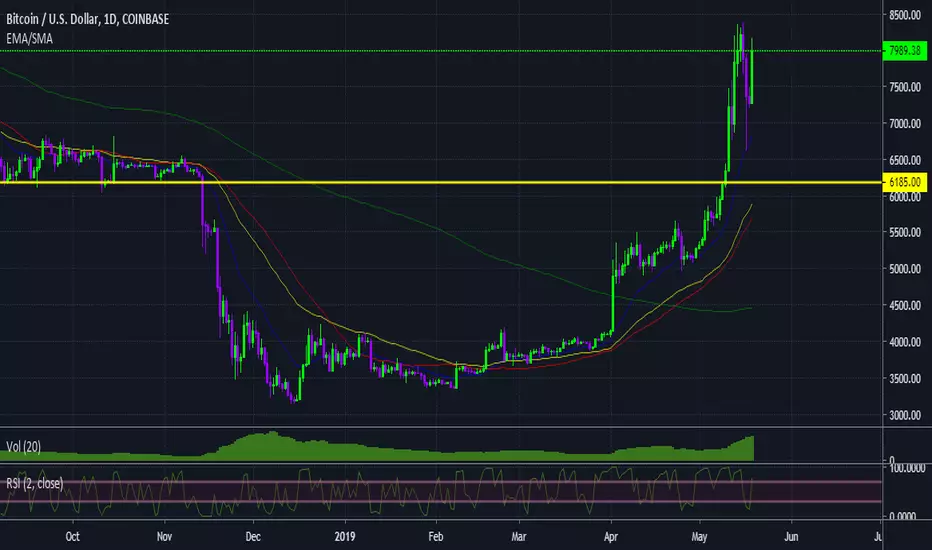
boot2thrill - EMA 20/50 & SMA 50/200//Notes:
//Version by boot2thrill on 05-20-2019.
//Version includes combined Exponential Moving Averages EMA 20/50 and Simple Moving Averages SMA 50/200.
//***Recommended use on BTCUSD 1h/4h/1d chart.***

boot2thrill - EMA 20/50 & SMA 50/200//Notes:
//Version by boot2thrill on 05-20-2019.
//Version includes combined Exponential Moving Averages (EMA) for 20/50 periods and Simple Moving Averages (SMA) for 50/200 periods.
//***Recommended use on BTCUSD 1h/4h/1d chart.***
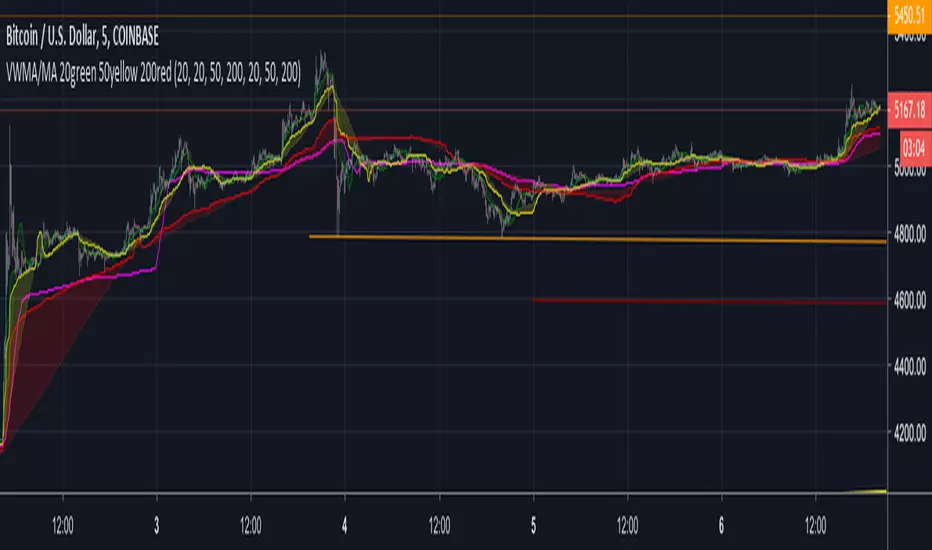
VWMA : 20 50 200Plots 20, 50 and 200 tick Volume Weighted MA and Simple MA.
The Volume Weighted MA tends to move before the SMA. I am seeing significant price movements on crypto charts near 50 VWMA crosses. As well, the 20-50 VWMA crosses. When the thicker lines ( VWMA ) are above or below the same color SMA, this divergence can also signal changes in trends.
This is my first script and likely be updated. Feedback is welcome.
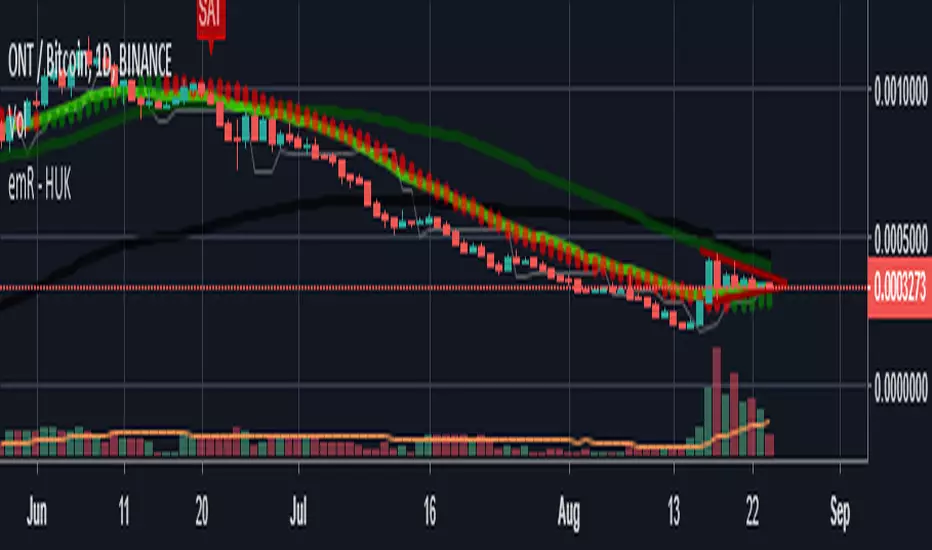
HUK ElasticVolume/50 MOVING AVERAGE e 50/200/20 Coral TrendElastic Volume Default Settings : 50 lenght!
Moving Average Default Settings:50 / 200
EMA Default Settings :20
Coral Trend Default Settings :21/0,4
Thank you ! emR Huk ..
Daily EMA 20/50/100/200 MTF + ContextDaily EMA 20/50/100/200 MTF + Context is a multi–timeframe trend and structure tool that projects classic higher-timeframe EMAs (20, 50, 100, 200) onto any lower timeframe and adds rich contextual analysis.
The goal of the script is not just to draw moving averages, but to explain what their relative position means in terms of trend strength, direction, and market phase.

Pivot HL+50 EMA Hariss 369A simple indicator detects pivot highs and lows. Buy signal is fired when pivot high crosses and closes over previous pivot high and price is above 50 EMA in order to trade with trend.
Sell signal is fired when pivot low crosses and closes below the previous pivot low and price is below 50 EMA.
It is very simple to use this and one can visualize the trend with this indicator. It can be used for any type of asset and in any time frame.

Today Low ± 50 LevelsThis script plots two dynamic horizontal lines based on today’s daily low. One line is placed 50 points above the low and the other 50 points below it. The lines update automatically each new day and appear on any timeframe

SMAs (10,50,100,200) by BenderDescription:
Multi-timeframe Simple Moving Average indicator displaying four popular SMAs (10, 50, 100, 200) commonly used for trend analysis and support/resistance levels. Each SMA is fully customizable with individual settings for period length, data source, timeframe, and color. Perfect for traders who want to view higher timeframe SMAs on lower timeframe charts or combine multiple timeframe analyses in one view.
Key Features:
Four independent SMAs with default periods of 10, 50, 100, and 200
Multi-timeframe capability - view daily SMAs on any chart timeframe
Fully customizable: length, source (close, open, high, low, etc.), timeframe, and color
Toggle each SMA on/off individually
Clean, organized settings menu with grouped parameters
Semi-transparent lines for better chart visibility

EMA 9/20/50/100/200This script plots the five most commonly used Exponential Moving Averages (EMAs): 9, 20, 50, 100, and 200. These EMAs help traders quickly identify short-term momentum, medium-term trends, and long-term market direction.
It is useful for:
Trend identification
Momentum confirmation
Pullback entries
Reversal detection
Multi-timeframe confluence trading
What’s Included
EMA 9 → short-term momentum
EMA 20 → near-term trend guide
EMA 50 → medium-term trend
EMA 100 → broad trend structure
EMA 200 → long-term direction
Each EMA is color-coded for clarity, making it easy to read and visually track trend shifts.
How to Use
When shorter EMAs cross above longer EMAs → bullish trend strengthening
When shorter EMAs cross below longer EMAs → bearish trend strengthening
Wide spacing between EMAs indicates a strong trend
Compression or clustering often signals potential reversals or breakout conditions
This indicator is simple, clean, and effective for all timeframes and asset classes.

BHUVANA Fib 50–61.8 • Turn Alerts when FIB directions change
Detects step-up / step-down on both Fib 50 & 61.8 (your “stairs” logic).
Triggers BUY/SELL on that slope change (optionally also requires price to be above/below the line).Spot volatility compression around the 50%–61.8% Fibonacci mid-band of the current swing, then trade the first expansion with clean, rules-based entries and auto SL references.
Swing mapping: Finds the active high/low over a user-defined lookback and computes Fib 50% and Fib 61.8%.
Squeeze detection: Measures the distance between 50% and 61.8%. If the band width is ≤ (ATR × multiplier), the zone is flagged as a Squeeze.
Breakout entries (on close):
Long when price crosses up through 50% while squeezed.
Short when price crosses down through 61.8% while squeezed.
Risk framework: Auto-plots stop lines from the signal bar:
Long SL = swing low; Short SL = swing high.
Visuals: Fib lines (50/61.8) + optional yellow zone highlight during squeeze.
Signals evaluate on bar close (no forward-looking data).
Works well on XAUUSD / US30 intraday (5–15m) during London/NY sessions.
Add your own alertcondition() lines if you want push alerts on Long/Short entries.

EMA 50/200 Strategy Signals - Axis.BhpEMA 50/200 Strategy
Plots EMA 50 and EMA 200
Displays arrows when a crossover occurs (signals)
Creates alerts for TradingView
Works for crypto, forex, and stocks

20/50/200 EMA with RVOL Filter Hariss 369Understanding to trade with this indicator is very simple. 20 EMA acts as dynamic support and resistance. 50 EMA is best for intraday/short term trend filter and 200 EMA is best for long term trend filter. One should always trade with the trend. Combination of all threes entails safe trading with trend. Undoubtedly, volume plays vital role to move the price up or down. The volume indicator used here is Relative Volume (RVOL) rather simple volume. 1.5 RVOL is considered as strong trend to trade considering other factors intact. You can tick/untick RVOL and you can also change the level of RVOL from input section.
You can also change the color of EMAs and pattern of buy and sell signal. Place this indicator over the chart. You can choose any type of asset and any time frame.
Though buy and sell signals are there. The concept of trading is buy when price closes above 20 ema and 20 ema >50ema>200 ema. Place stop loss below the low of last candle or just below 20 ema. Target 1.5/2 times of stop loss. You can also trail it with 20 ema or 50 ema depending upon your trading style and risk appetite. You can also take positional trade, in that case 200 ema to be considered as stop loss. Sell when price closes below 20 ema, 20 ema<50ema<200 ema. For intraday trading, 20 ema is best to enter and exit. Taking RVOL into consideration is best way in order to trade with high liquidity-safer way to entry and exit.

RSI to 50 (decimal version) - TemujinTradingSimple indicator that shows the price levels required for the RSI to get to the value of 50.
What I observe is 50 rsi often acts as support or resistance and is a fair indication of bullish/bearish sentiment and price action and bounce/rejection levels.
It provides a table showing current time frame, 4 hr, daily, weekly describing the current rsi value and the price needed for that rsi to get to 50. This table is colored red when bearish at the time frame and green when bullish (as per <50 rsi or >50rsi).
Plots historical lines of each previous candle in the series showing how price interacts.
Updated script to allow manual input of price decimals to enable more assets price to be viewable in the table format.

RSI to 50 - TemujinTradingSimple indicator that shows the price levels required for the RSI to get to the value of 50.
What I observe is 50 rsi often acts as support or resistance and is a fair indication of bullish/bearish sentiment and price action and bounce/rejection levels.
It provides a table showing current time frame, 4 hr, daily, weekly describing the current rsi value and the price needed for that rsi to get to 50. This table is colored red when bearish at the time frame and green when bullish (as per <50 rsi or >50rsi).
Plots historical lines of each previous candle in the series showing how price interacts.

EMA Trend Alignment (10/20/50) with MTF & SignalsBullish Crossovers 10>20>50 and Bearish Crossover 10<20<50

EMA 50/200 Pullback + RSI (BTC/USDT 15m - 2 Bar Logic)I recognize that combining indicators requires clear justification on how the components interact Therefore the new scripts description will explicitly detail the strategys operational logic
Objective The strategy is a Trend Following Pullback System designed for high frequency time frames 15m
Synergy The EMA50 EMA200 defines the primary Trend Direction Trend Filter It then utilizes a 2 Bar Pullback Logic to find an entry point where the price has momentarily reversed against the trendline and the RSI 14 serves as a Momentum Filter RSI greater than 50 for Long RSI less than 50 for Short to minimize false signals
