Correlation with Matrix TableCorrelation coefficient is a measure of the strength of the relationship between two values. It can be useful for market analysis, cryptocurrencies, forex and much more.
Since it "describes the degree to which two series tend to deviate from their moving average values" (1), first of all you have to set the length of these moving averages. You can also retrieve the values from another timeframe, and choose whether or not to ignore the gaps.
After selecting the reference ticker, which is not dependent from the chart you are on, you can choose up to eight other tickers to relate to it. The provided matrix table will then give you a deeper insight through all of the correlations between the chosen symbols.
Correlation values are scored on a scale from 1 to -1
A value of 1 means the correlation between the values is perfect.
A value of 0 means that there is no correlation at all.
A value of -1 indicates that the correlation is perfectly opposite.
For a better view at a glance, eight level colors are available and it is possible to modify them at will. You can even change level ranges by setting their threshold values. The background color of the matrix's cells will change accordingly to all of these choices.
The default threshold values, commonly used in statistics, are as follows:
None to weak correlation: 0 - 0.3
Weak to moderate correlation: 0.3 - 0.5
Moderate to high correlation: 0.5 - 0.7
High to perfect correlation: 0.7 - 1
Remember to be careful about spurious correlations, which are strong correlations without a real causal relationship.
(1) www.tradingview.com
Wyszukaj w skryptach " TABLE"

SST Table NewData Table for Update GTT Orders in Stocks....
Updated GTT Order details for SST , also added Relative Strength of Stock compared with NIFTY Index for 55 Days (3 Months) period.
RS line plotted on chart… taken reference of close price of day candle… just a bigger picture of actual RS indicator plotted on chart itself... RS line in red color means below zero line (negative) and green color means above zero line (positive).
Added code for checking RS value on chart for any previous day.

US Stock Market Sectors Overview Table [By MUQWISHI]US Market Overview Table will identify the bullish and bearish sectors of a day by tracking the SPDR sectors funds.
It's possible to add a ticker symbol for correlation compared to each sector.
Overview Indicator

Valuation TableHey folks, I hope you are all doing well!
This is an indicator that you can use to help you to evaluate companies. There are a few things I added to the valuation table that I personally use and I will explain what they are.
I added Joel Greenblatt's ROC% because it takes Earnings before Interest and Taxes to reflect more closely what the company earns from its operations, while including the cost of depreciation/amortization of assets. A high double digit figure often means that the company has a defensible edge versus its competitors (e.g. a strong brand or a unique product). It's good for relative valuation (comparing two companies in the same industry).
I also added Donald Yacktman's forward rate of return. Yacktman defines forward rate of return as the normalized free cash flow yield plus real growth plus inflation . Unlike the Earnings Yield %, the Forward Rate of Return uses the normalized Free Cash Flow of the past seven years, and considers growth. The forward rate of return can be thought of as the return that investors buying the stock today can expect from it in the future. Yacktman’s Forward Rate of Return may or may not be a useful metric. However, it does present new ways to see and think about stocks we may want to buy.
I added a box called "real price" and that is from Peter Lynch's book, "One Up on Wall Street," where he talked about how the real price of the stock is really the current price - Net Cash Per Share.
I would also personally pair this script with TradingView's built in financial indicators that shows the revenue growth, net income, etc.
Note: the script only works on the weekly timeframe and it will take some time to load because it has a lot of data.

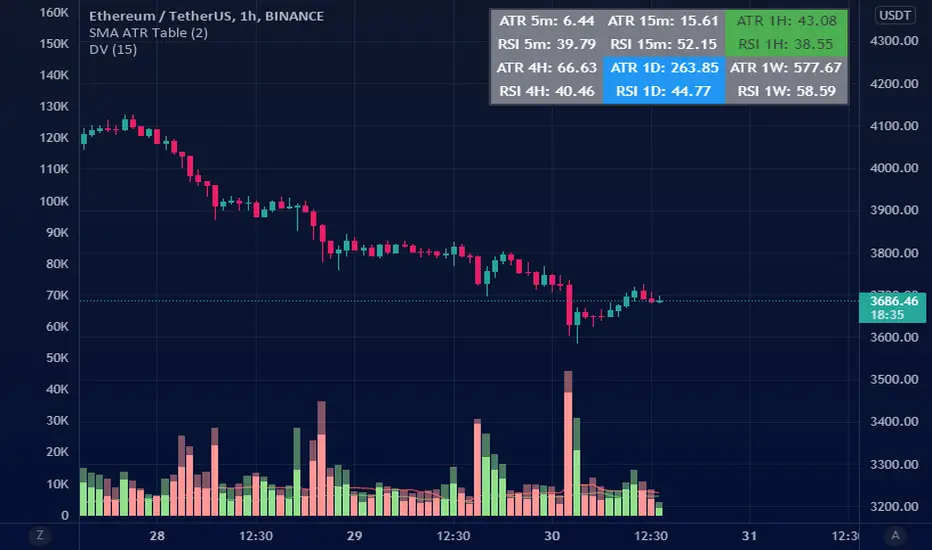
ATR Table (SMA)ATR table for select time frames.
Using Simple Moving Average (SMA) to get ATR.
MA periods is based on numbers suggested by Saeed Khakestar (Trigger Price Action)
You can change them in code
5m => 12
15m => 16
1H => 24
4H => 42
1D => 30
1W => 52
RSI is calculated the same way
Price Range TableThe table shows the ranking of the price as a percentage relative to the past candles.
100 ~ highest price of the time frame
0 ~ lowest price of the time frame

Simple RSI tableThis is a simple RSI table for traders that don't want the graph, only the current value.
Location, thresholds, and colors are all adjustable.
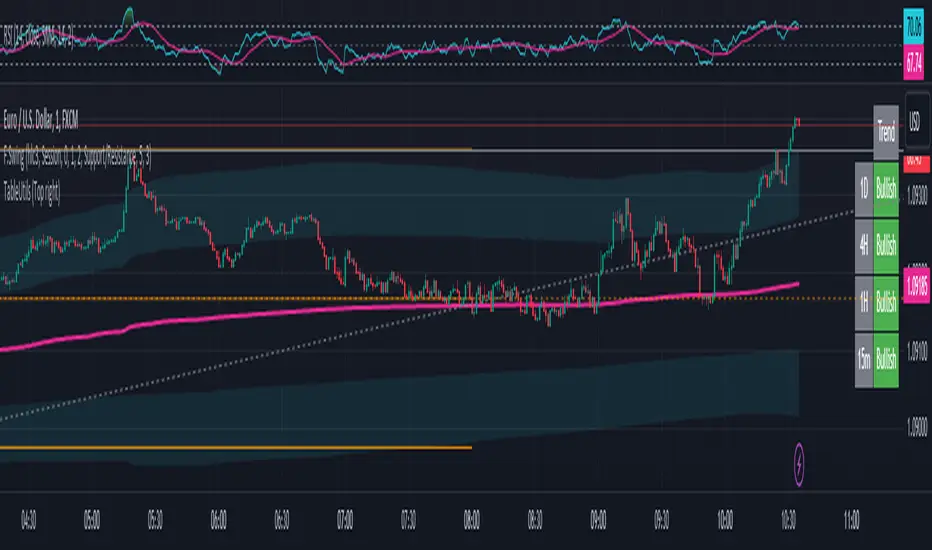
TableUtilsLibrary "TableUtils"
Collection of table utility functions
getTablePositionByLabel(tablePosition)
Return the position for the table by given label. Useful if you want to control the position of the table with a pine script input selector that use a more human friendly labels
Parameters:
tablePosition (string) : (string) Label of the table position. Possible values are: "Top left", "Top right", "Bottom left", "Bottom right", "Middle left", "Middle right"
Returns: the position for the table by given label. Useful if you want to control the position of the table with a pine script input selector that use a more human friendly labels
TableColorThemeLibrary "TableColorTheme"
TODO: This library provides the color for the table.
monokai(name) theme: Provides the colors of monokai.
Parameters:
name : TODO: The name of the color group.
Returns: TODO: Returns an array of colors.
kolormark.com
monokaipro(name) theme: Provides the colors of monokai pro.
Parameters:
name : TODO: The name of the color group.
Returns: TODO: Returns an array of colors.
theme(name) theme This function provides the color for the table.
Parameters:
name : TODO: The name of the color group.
Returns: TODO: Returns an array of colors.
TableRSI and Ichimoku Strength Table
This indicator displays whole-number RSI values (1h, 4h, 1d, 3d, 1w) and Ichimoku strengths (Conversion Line, Base Line, Cloud, Lagging Span) in a customizable table. Toggle between horizontal (9x2) or vertical (2x10) layouts, with adjustable position (e.g., Top Right), text size (Tiny to Large), and colors (border, header, text, RSI: >70 red, <30 green, 30-70 yellow; Ichimoku: >50 green, <50 red). Ichimoku components are plotted on the chart. It offers a clear view of momentum and trend strength for traders.
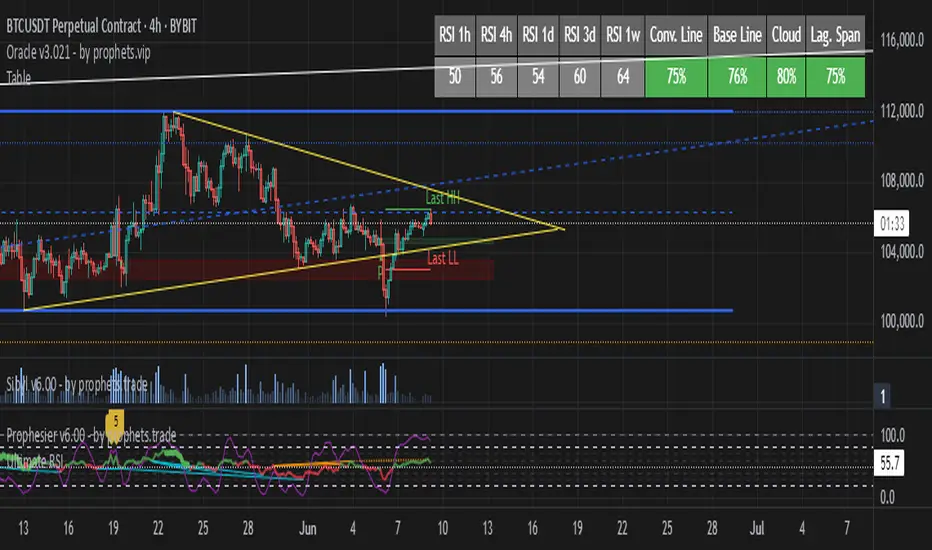

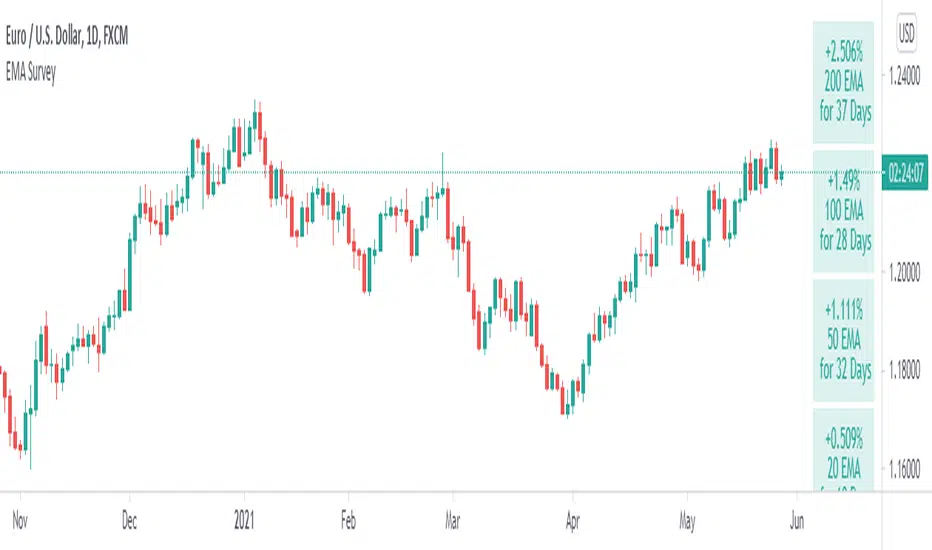
Table: EMA SurveillanceThis script will show information of interest about Moving Averages from the selected timeframe.
The idea is to provide data from higher timeframes (Daily preferably).
The information provided includes:
• selected length and calculation
• a relative position of the close to the average (above, below, and how much)
• how many periods passed since the moving average has been tested - any break counts as a test, it doesn't have to close on the opposite side
Global Settings:
• Timeframe of the moving averages
• Choose to see simple words such as "Above" / "Below" OR the specific percentage OR how much percentage % it moved from the moving average?
• EMA or SMA
Moving Average Settings:
• Up to 6 different lengths
• You can deactivate the averages you don't need
I hope it will be useful. Good luck!
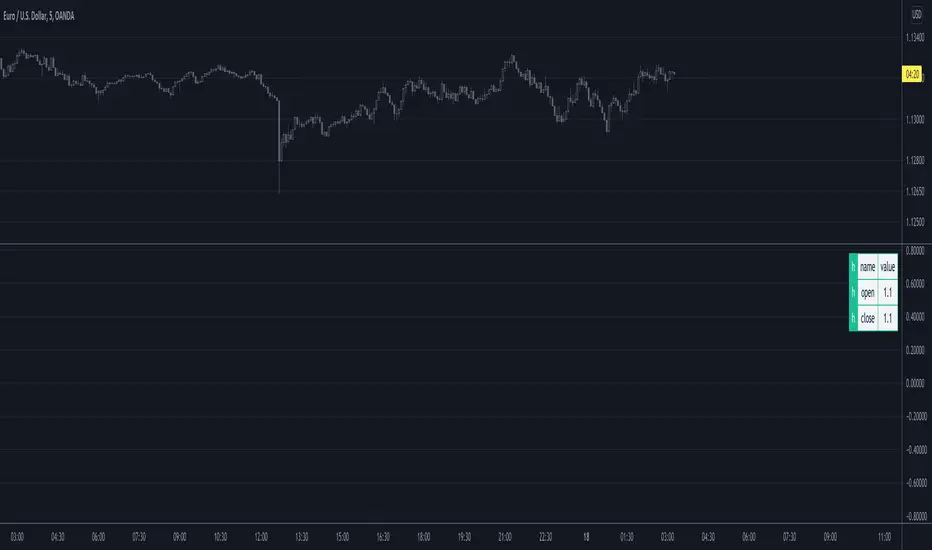
Tables: A Simple NoteA simple note to remind you of what you would otherwise forget. I don't think it needs further explanation.
Comes with three rows each can be enabled independently of others. Can be resized.

Table Logic ExtractorTable Logic Extractor v2.0
Advanced multi-timeframe analysis with intelligent trade recommendations!
Overview:
This sophisticated indicator provides comprehensive market analysis through multiple technical indicators and timeframes. It combines EMA analysis, RSI momentum, MACD signals, Bollinger Bands, volume analysis, divergence detection, and intelligent trade recommendations with support/resistance distance calculations and trading style detection.
Key Features:
✅ Multi-Indicator Analysis - EMA, RSI, MACD, Bollinger Bands, Volume, ATR
✅ Multi-Timeframe Analysis - M1, M5, M15, M30 trend comparison
✅ Divergence Detection - Bullish and bearish divergence with strength calculation
✅ Support/Resistance Analysis - Distance calculations with Fibonacci levels
✅ Trading Style Detection - Trend, Range, Breakout, Scalping identification
✅ Intelligent Trade Signals - Style-based trade recommendations with confidence levels
✅ Risk Management - Stop Loss and Take Profit calculations
✅ Comprehensive Table - Real-time analysis with 14 different metrics
How It Works:
The indicator uses advanced analysis:
• Multi-Timeframe - M1, M5, M15, M30 trend analysis
• Style Detection - Automatic trading style identification
• S/R Analysis - Fibonacci-based support/resistance levels
• Weighted Scoring - EMA (2.0), RSI (1.5), MACD (1.5), BB (1.0), Volume (1.0)
• Intelligent Signals - Style-based trade recommendations
Trading Style Detection:
• TREND TRADING - Strong trend + aligned timeframes (Green)
• RANGE TRADING - Low volatility + sideways movement (Yellow)
• BREAKOUT TRADING - High volume + near levels (Orange)
• SCALPING - High volatility + quick moves (Red)
Information Table (14 Metrics):
Real-time display showing:
• ATR volatility with signal (HIGH/MED/LOW/NORMAL VOL)
• Divergence status with strength percentage
• S/R Distance with Fibonacci levels
• Stop Loss (2.0:1 ratio) and Take Profit 1 (1.5:1 ratio)
• Multi-Timeframe analysis (M1, M5, M15, M30)
• Scalping signals with confidence levels
• Current trend with strength percentage
• Intelligent trade recommendations
Trade Recommendations:
• TREND BUY/SELL - All timeframes aligned (High confidence)
• SHORT-TERM BUY/SELL - M5 signal only (Medium confidence)
• SCALPING BUY/SELL - M5 vs higher timeframes (Low confidence)
• WAIT - No clear signal (No confidence)
Support/Resistance Analysis:
• Fibonacci Levels: 23.6%, 38.2%, 50% retracements
• Distance Categories: Very Near (Red), Near (Orange), Medium (Yellow), Far (Green)
• ATR-based distance measurement
• Real-time proximity alerts
Scalping Detection:
Specialized signals based on:
• High volatility (ATR ratio > 1.5)
• Quick price moves (fast momentum)
• Volume confirmation (high volume spikes)
• RSI extremes (oversold/overbought)
Settings:
• EMA - Fast (9), Slow (21), Trend (50)
• RSI - Length (14), Overbought (70), Oversold (30)
• MACD - Fast (12), Slow (26), Signal (9)
• Bollinger Bands - Length (20), Multiplier (2.0)
• ATR - Length (14) for volatility measurement
• Volume Threshold - 1.5x average volume
• Divergence - Lookback (3), Threshold (0.5)
Best Practices:
🎯 Adapt strategy to detected trading style
📊 Use multi-timeframe analysis for confirmation
⚡ Monitor S/R distances for entry timing
🛡️ Always use calculated Stop Loss levels
🔍 Watch for divergence signals
📈 Follow intelligent trade recommendations
Pro Tips:
• Table provides all essential information in one place
• Trading style detection helps adapt your strategy
• S/R distance shows proximity to key levels
• Confidence levels indicate signal reliability
• Multi-timeframe alignment increases success rate
• Scalping signals work best in high volatility
Alerts:
• Trend Change Alert - "Trend changed across timeframes"
• Divergence Alert - "Divergence detected"
• Scalping Alert - "Scalping opportunity"
• Trade Signal Alert - "Trade recommendation available"
Version 2.0 Improvements:
• Advanced multi-timeframe analysis (M1, M5, M15, M30)
• Intelligent trading style detection
• Comprehensive support/resistance analysis
• Professional trade recommendations with confidence levels
• Scalping detection with specialized signals
• Risk management with calculated SL/TP levels
• 14-metric comprehensive information table
Created with ❤️ for the trading community
This indicator is free to use for both commercial and non-commercial purposes.

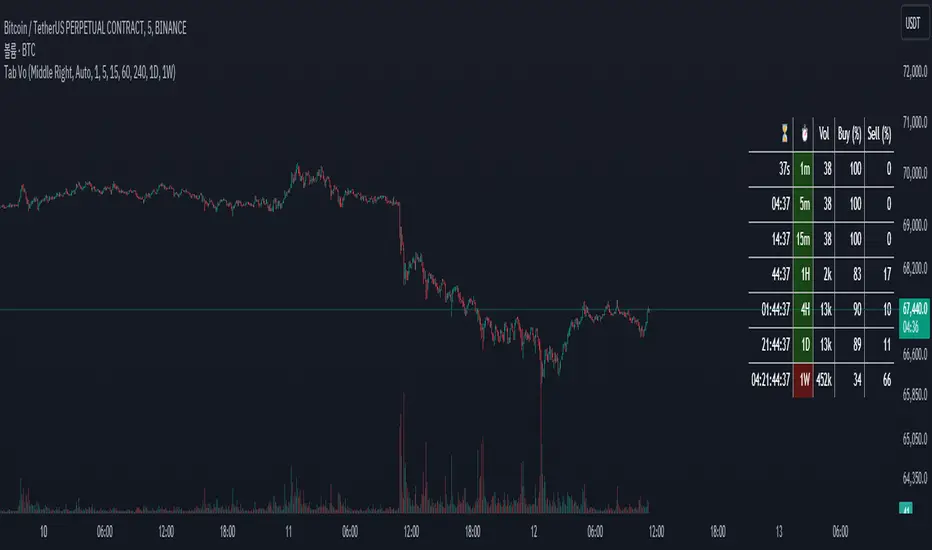
Table Volume MultiframeDescription
The Table Volume Multiframe indicator displays volume information across multiple timeframes in a convenient table format. Users can customize the table's position, size, and the specific timeframes to be displayed. This indicator helps traders analyze volume trends and divergences across different timeframes, providing a comprehensive view of market activity. The table shows the total volume, buy percentage, sell percentage, and a countdown timer for the next bar close for each selected timeframe. The countdown function updates consistently to provide real-time information.
Features
- Customizable table position and size
- Selectable timeframes
- Displays volume, buy percentage, sell percentage
- Countdown timer for next bar close
- Real-time updates
[TABLE] Moving Average Stage Indicator Table📈 MA Stage Indicator Table
🧠 Overview:
This script analyzes market phases based on moving average (MA) crossovers, classifying them into 6 distinct stages and displaying statistical summaries for each.
🔍 Key Features:
• Classifies market condition into Stage 1 to Stage 6 based on the relationship between MA1 (short), MA2 (mid), and MA3 (long)
• Provides detailed stats for each stage:
• Average Duration
• Average Width (MA distance)
• Slope (Angle) - High / Low / Average
• Shows current stage details in real-time
• Supports custom date range filtering
• Choose MA type: SMA or EMA
• Optional background coloring for stages
• Clean summary table displayed on the chart

Multi Ticker Price TableTable showing the current price of up to 7 tickers
- Tickers are user choice
- Table background is customizable
- User has the choice to turn the Daily % column off

MTF-CPR TableTable gives you CPR values based on Camarilla calculation with S&R 3 & 4 Levels...
Highlights the cell green when Price is in range and marks the Pivot Red when we have a Narrow CPR range...
Enjoy!!

ATR/ADX Trend Table - Compact & Positionable (Fixed init)Table to determine qualified ATR & ADX DI for follow trend entry


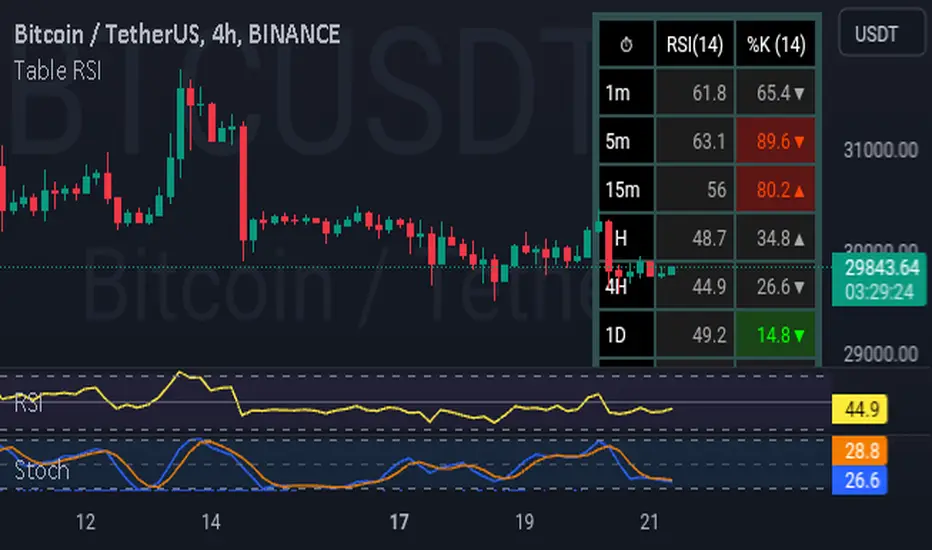
Table rsi multiframes(by Lc_M)- Simultaneous display of RSI values on cells corresponding to each selected timeframe, organized in an intuitive table, adjustable in size and position.
- Color indicator on each cell that presents RSI values within the overbought and oversold levels. example: if the user wants to set the O.S/O.B levels to 20 - 80, the colored cells will only appear at "RSI" => 80 and "RSI" <= 20.
- Free configuration of graphic times, lengths and O.B/O.S, according to user standards
Autotable█ OVERVIEW
The library allows to automatically draw a table based on a string or float matrix (or both) controlling all of the parameters of the table (including merging cells) with parameter matrices (like, e.g. matrix of cell colors).
All things you would normally do with table.new() and table.cell() are now possible using respective parameters of library's main function, autotable() (as explained further below).
Headers can be supplied as arrays.
Merging of the cells is controlled with a special matrix of "L" and "U" values which instruct a cell to merged with the cell to the left or upwards (please see examples in the script and in this description).
█ USAGE EXAMPLES
The simplest and most straightforward:
mxF = matrix.new(3,3, 3.14)
mxF.autotable(bgcolor = color.rgb(249, 209, 29)) // displays float matrix as a table in the top right corner with defalult settings
mxS = matrix.new(3,3,"PI")
// displays string matrix as a table in the top right corner with defalult settings
mxS.autotable(Ypos = "bottom", Xpos = "right", bgcolor = #b4d400)
// displays matrix displaying a string value over a float value in each cell
mxS.autotable(mxF, Ypos = "middle", Xpos = "center", bgcolor = color.gray, text_color = #86f62a)
Draws this:
Tables with headers:
if barstate.islast
mxF = matrix.new(3,3, 3.14)
mxS = matrix.new(3,3,"PI")
arColHeaders = array.from("Col1", "Col2", "Col3")
arRowHeaders = array.from("Row1", "Row2", "Row3")
// float matrix with col headers
mxF.autotable(
bgcolor = #fdfd6b
, arColHeaders = arColHeaders
)
// string matrix with row headers
mxS.autotable(arRowHeaders = arRowHeaders, Ypos = "bottom", Xpos = "right", bgcolor = #b4d400)
// string/float matrix with both row and column headers
mxS.autotable(mxF
, Ypos = "middle", Xpos = "center"
, arRowHeaders = arRowHeaders
, arColHeaders = arColHeaders
, cornerBgClr = #707070, cornerTitle = "Corner\ncell", cornerTxtClr = #ffdc13
, bgcolor = color.gray, text_color = #86f62a
)
Draws this:
█ FUNCTIONS
One main function is autotable() which has only one required argument mxValS, a string matrix.
Please see below the description of all of the function parameters:
The table:
tbl (table) (Optional) If supplied, this table will be deleted.
The data:
mxValS (matrix ) (Required) Cell text values
mxValF (matrix) (Optional) Numerical part of cell text values. Is concatenated to the mxValS values via `string_float_separator` string (default "\n")
Table properties, have same effect as in table.new() :
defaultBgColor (color) (Optional) bgcolor to be used if mxBgColor is not supplied
Ypos (string) (Optional) "top", "bottom" or "center"
Xpos (string) (Optional) "left", "right", or "center"
frame_color (color) (Optional) frame_color like in table.new()
frame_width (int) (Optional) frame_width like in table.new()
border_color (color) (Optional) border_color like in table.new()
border_width (int) (Optional) border_width like in table.new()
force_overlay (simple bool) (Optional) If true draws table on main pane.
Cell parameters, have same effect as in table.cell() ):
mxBgColor (matrix) (Optional) like bgcolor argument in table.cell()
mxTextColor (matrix) (Optional) like text_color argument in table.cell()
mxTt (matrix) (Optional) like tooltip argument in table.cell()
mxWidth (matrix) (Optional) like width argument in table.cell()
mxHeight (matrix) (Optional) like height argument in table.cell()
mxHalign (matrix) (Optional) like text_halign argument in table.cell()
mxValign (matrix) (Optional) like text_valign argument in table.cell()
mxTextSize (matrix) (Optional) like text_size argument in table.cell()
mxFontFamily (matrix) (Optional) like text_font_family argument in table.cell()
Other table properties:
tableWidth (float) (Optional) Overrides table width if cell widths are non zero. E.g. if there are four columns and cell widths are 20 (either as set via cellW or via mxWidth) then if tableWidth is set to e.g. 50 then cell widths will be 50 * (20 / 80), where 80 is 20*4 = total width of all cells. Works simialar for widths set via mxWidth - determines max sum of widths across all cloumns of mxWidth and adjusts cell widths proportionally to it. If cell widths are 0 (i.e. auto-adjust) tableWidth has no effect.
tableHeight (float) (Optional) Overrides table height if cell heights are non zero. E.g. if there are four rows and cell heights are 20 (either as set via cellH or via mxHeight) then if tableHeigh is set to e.g. 50 then cell heights will be 50 * (20 / 80), where 80 is 20*4 = total height of all cells. Works simialar for heights set via mxHeight - determines max sum of heights across all cloumns of mxHeight and adjusts cell heights proportionally to it. If cell heights are 0 (i.e. auto-adjust) tableHeight has no effect.
defaultTxtColor (color) (Optional) text_color to be used if mxTextColor is not supplied
text_size (string) (Optional) text_size to be used if mxTextSize is not supplied
font_family (string) (Optional) cell text_font_family value to be used if a value in mxFontFamily is no supplied
cellW (float) (Optional) cell width to be used if a value in mxWidth is no supplied
cellH (float) (Optional) cell height to be used if a value in mxHeight is no supplied
halign (string) (Optional) cell text_halign value to be used if a value in mxHalign is no supplied
valign (string) (Optional) cell text_valign value to be used if a value in mxValign is no supplied
Headers parameters:
arColTitles (array) (Optional) Array of column titles. If not na a header row is added.
arRowTitles (array) (Optional) Array of row titles. If not na a header column is added.
cornerTitle (string) (Optional) If both row and column titles are supplied allows to set the value of the corner cell.
colTitlesBgColor (color) (Optional) bgcolor for header row
colTitlesTxtColor (color) (Optional) text_color for header row
rowTitlesBgColor (color) (Optional) bgcolor for header column
rowTitlesTxtColor (color) (Optional) text_color for header column
cornerBgClr (color) (Optional) bgcolor for the corner cell
cornerTxtClr (color) (Optional) text_color for the corner cell
Cell merge parameters:
mxMerge (matrix) (Optional) A matrix determining how cells will be merged. "L" - cell merges to the left, "U" - upwards.
mergeAllColTitles (bool) (Optional) Allows to print a table title instead of column headers, merging all header row cells and leaving just the value of the first cell. For more flexible options use matrix arguments leaving header/row arguments na.
mergeAllRowTitles (bool) (Optional) Allows to print one text value merging all header row cells and leaving just the value of the first cell. For more flexible options use matrix arguments leaving header/row arguments na.
Format:
string_float_separator (string) (Optional) A string used to separate string and float parts of cell values (mxValS and mxValF). Default is "\n"
format (string) (Optional) format string like in str.format() used to format numerical values
nz (string) (Optional) Determines how na numerical values are displayed.
The only other available function is autotable(string,... ) with a string parameter instead of string and float matrices which draws a one cell table.
█ SAMPLE USE
E.g., CSVParser library demo uses Autotable's for generating complex tables with merged cells.
█ CREDITS
The library was inspired by @kaigouthro's matrixautotable . A true master. Many thanks to him for his creative, beautiful and very helpful libraries.

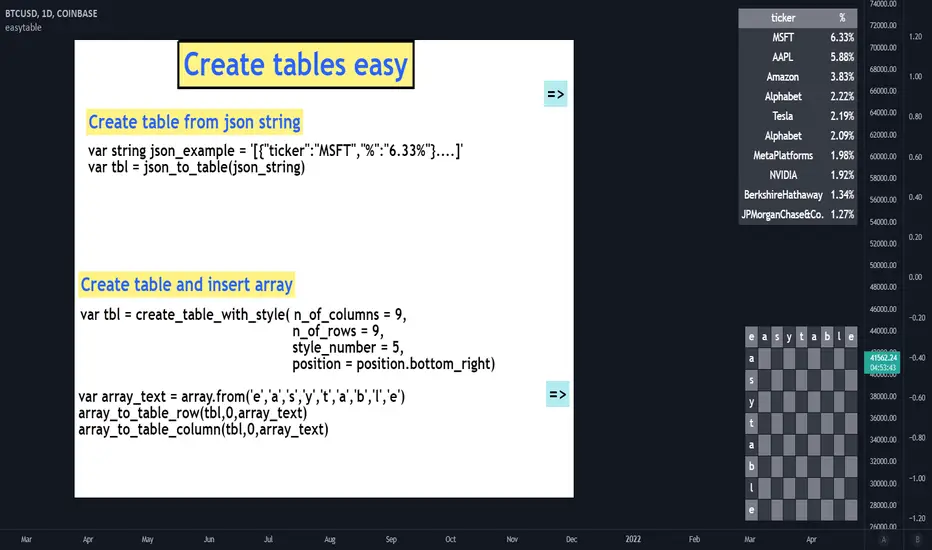
easytableLibrary "easytable"
Create tables easily, with minimal code
▦ FEATURES ▦
█ Create tables █ JSON To Table █ Change Colors █ Array to Rows/Columns █ Pre-Styles █ Change Text Size █ Delete Rows/Columns █ Blink Cells
indentify_table_id() Identifies all tables ID number in each cell(0,0).
get_table_by_id(id_number) Get table object by ID number.
Parameters:
id_number : (int) ID number of the table to fetch.
Returns: table.
change_cells_color(table_object, cells_color, start_column, end_column, start_row, end_row) Change cells background colors.
Parameters:
table_object : (table) table object to be changed.
cells_color : (color) Cells color.
start_column : (int) Start column.
end_column : (int) End column.
start_row : (int) Start Row.
end_row : (int) End Row to change.
Returns: Void.
change_cells_text_color(table_object, text_color, start_column, end_column, start_row, end_row) Change cells text colors.
Parameters:
table_object : (table) table object to be changed.
text_color : (color) Text color.
start_column : (int) Start column.
end_column : (int) End column.
start_row : (int) Start Row.
end_row : (int) End Row.
Returns: Void.
change_all_table_text_color(table_object, text_color, table_column_size, table_row_size) Change All table text color.
Parameters:
table_object : (table) table object to be changed.
text_color : (color) Text color.
table_column_size : (int) Size of the table columns.
table_row_size : (int) Size of the table rows.
Returns: Void.
change_table_size(table_object, n_of_columns, n_of_rows, tbl_size) Change table size.
Parameters:
table_object : (table) table object to be changed.
n_of_columns : (int) Size of the table columns.
n_of_rows : (int) Size of the table rows.
tbl_size : (string) size of the table.
Returns: Void.
change_cells_text_size(text_size, start_column, end_column, start_row, end_row, table_id) Change table cells text size .
Parameters:
text_size : (string) Text size.
start_column : (int) Start column.
end_column : (int)(optional) End column.
start_row : (int)(optional) Start Row.
end_row : (int)(optional) End Row.
table_id : (int)(optional) Number of the ID of the table.
Returns: Void.
table_delete_row(table_object, table_column_size, start_row, end_row) Delete specified rows from table.
Parameters:
table_object : (table) table object to be changed.
table_column_size : (int) Table columns max size.
start_row : (int) Start row to delete.
end_row : (int)(optional) End row to delete (optional — Assumes start_row value).
Returns: Void.
table_delete_column(table_object, table_row_size, start_column, end_column) Delete specified columns from table.
Parameters:
table_object : (table) table object to be changed.
table_row_size : (int) Table rows max size.
start_column : (int) Start column to delete.
end_column : (int)(optional) End column to delete (optional — Assumes start_column value).
Returns: Void.
array_to_table_column_auto(column_to_insert, array_to_insert, table_id) Insert string array to table column without passing table object.
Parameters:
column_to_insert : (int) Column to be inserted.
array_to_insert : (string array) Start column to delete.
table_id : (int)(optional) Number of the ID of the table.
Returns: Void.
array_to_table_row_auto(row_to_insert, array_to_insert, table_id) Insert string array to table row without passing table object.
Parameters:
row_to_insert : (int) Column to be inserted.
array_to_insert : (string array) Start column to delete.
table_id : (int)(optional) Number of the ID of the table.
Returns: Void.
array_to_table_row(table_object, row_to_insert, array_to_insert) Insert string array to table row by passing table object.
Parameters:
table_object : (table) table object to be changed.
row_to_insert : (int) Row to be inserted.
array_to_insert : (string array) Start column to delete.
Returns: Void.
array_to_table_column(table_object, column_to_insert, array_to_insert) Insert string array to table column by passing table object.
Parameters:
table_object : (table) table object to be changed.
column_to_insert : (int) Column to be inserted.
array_to_insert : (string array) Start column to delete.
Returns: Void.
blink_cell(cell_column, cell_row, c_color, blink_interval_ms, table_id) Changes cell color at set intervals (blink).
Parameters:
cell_column : (int) Cell column position.
cell_row : (int) Cell row position.
c_color : (color) Color to blink.
blink_interval_ms : (int)(opt) Interval in milliseconds.
table_id : (int)(opt) Table ID number.
change_table_style(table_object, number_of_columns, number_of_rows, color) Changes table pre-style by selecting a pre-style number.
Parameters:
table_object : (table) table object to be changed.
number_of_columns : (int) Table column size.
number_of_rows : (int) Table row size.
color : 1 (color) Color of .
Returns: Void.
create_table_clean(n_of_columns, n_of_rows, position) Create a simple(blank) table without any styling.
Parameters:
n_of_columns : (int) Numbers of columns in the table.
n_of_rows : (int) Number of rows in the table.
position : (string) table position.
Returns: table object.
create_table_with_style(n_of_columns, n_of_rows, style_number, position) Create table with a pre-set style.
Parameters:
n_of_columns : (int) Numbers of columns in the table.
n_of_rows : (int) Number of rows in the table.
style_number : (int) Style number.
position : (string) table position.
Returns: table object.
json_to_table(raw_json) Create table based on input raw json string.
Parameters:
raw_json : (int) Raw json string.
Returns: table object.
json_example() Example function that display a table based on a json
example_create_table()