Brutal ScalpsThe "Brutal Scalps" indicator is designed for both novice and expert traders looking to take advantage of short-term price movements. This powerful tool provides a multi-timeframe trend analysis along with dynamic Take Profit (TP) and Stop Loss (SL) levels, enhancing your trading decisions and risk management.
Features:
Multi-Timeframe Trend Analysis - You get a bird's eye view of the main oscillators on the selected timeframe
Last trade panel - Overview of the last trade values: TPs, SL and entry along with a quick stat on the performance over the last 10 trades
Baseline - MA based on either volatility or volume . Changes color depending on the angle and the consolidation area threshold that can be modified.
ATR(Average True Range) dynamic take profits and stop losses
Trend color - Can be enabled to highlight local trend start and end
Leverage setting
This setting is used to send a leverage amount with your alerts, this can be useful if you send your alerts though webhooks.
Signalling type - Classic
The original Brutal scalps signal detection mechanism based on order block/ engulfing candle detection only. Conditions in the MTF trend analysis panel must be met.
Signalling type - Breakout
Prioritizes candle formation that break a given number of candle formation(Eg. Highest high in the last x candles) , combined with the baseline entry condition
Signalling type - Trend following
Angled more towards longer direction moves. Uses adx combined with the price relationship to the 200MA
Key levels zone- Plots the liquidity pockets on the chart
Swing detections- uses moving averages that are plotted in regards to the selected number of candles.
Candle colors - The yellow candles are bullish engulfing candles, while the purple candles are bearish engulfing candles. These candles are also highlighted because their volume exceeds that of the previous 10 candles.
Peak profit - shows a label that displays the highest profit level reached after the signal was triggered , multiplied by the leverage in the input.
How to use:
Brutal Scalps is like your battle plan, you prepare for facing the markets with tools and insights.
1. Use the Multi TF Trend settings to set up the Trend Table in the top right (default position) panel. This will give you an overview of the oscillators in the selected timeframe. You should always watch a higher timeframe than the one you are using on the chart.
Ex.: If you are charting 15m , use the 1hr setting on the trend panel.
2. The baseline is one of the key factors in signal identification, use this wisely. The baseline consolidation threshold is the sensitivity of the line to stagnating candles. If the market is static and no trades come out , it might be because the threshold is set too high. The default of 3 should be a good fit for most setups. Just bare in mind that the higher the threshold the more candles will be considered as a consolidation area. Higher threshold also means better confirmation but also less trades coming in.
3. Signalling types can and should be used in regards to the current market formation.
Examples:
- If a market is moving in a stairs pattern, a good way to tackle it would be through the breakout signalling type.
- When the market is clearly trending, the use of the trend following type is most suited.
- If you want an all-rounder setup that is a jack of all trades but master of nothing, then the Classic type would be the most suited.
Additionally, if the market is extremely undecided and the above types don't perform that well on their own, the use of Allow Opposite Signal Only can reduce losses by only posting trades that are in the opposite direction, no more consecutive buys or sells.
Set the key levels zones to have extra manual confirmation. These zones are based on order blocks and highlight important liquidity areas. While these don't have any direct impact on the signal recognition, they can help to visually validate them.
Scalps

Bollinger Bands Scalper + VWAPGet more consistent scalps by trading in-between Bollinger Band Deviations.
FEATURES:
1) 3 Bollinger Bands with default settings to 1, 2, and 3 deviations for more consistent scalps
2) Trendicator: a dynamic color changing moving average that helps you see trend quickly
3) Robust VWAP tool with up to 3 different deviations as well as different anchor points to help you see strong support and resistances
4) Calming "purple cloud" color palette helps you focus on price action
5) Discover new trading strategies with a wide range of customizability

Pre-ScalperHello all,
It is an artificial intelligence indicator that can generate future predictions based on trend tracking and historical data analysis.
It will be in a period of continuous improvement to achieve the highest success rates.
You can use in all market in all time period.
This indicator does not contain any investment advice, it is only a helpful tool in your investments.
BINANCE:AAVEUSDTPERP

YSG Scalper V2Ysg Scalper
A powerful scalping indicator that generates multiple buy and sell signals with a good amount of accuracy
How does it work?
As we all know the markets/scripts are not always in trending, many times it moves in a tight range, ysg scalping indicator helps you in identifying the trading opportunities by giving you trading zones and non-trading zones by paining the candles in three different colors Red, Yellow, and Green. When the candles are red it means the script is in the selling zone and when the candles are green the script is in the buying zone, when the candles in yellow it means the script is in no trading zone.
How to trade?
Trading with ysg scalper is very easy as it gives two zones called the trading zone and non-trading zone. If the candles are green or red the script is in trading zone and if the candles are yellow the script is in the non-trading zone.
Buy: when the candles change color to green wait for the first arrow and enter the trade after closing of the candle.
Sell: when the candles change color to red wait for the first arrow and enter the trade after closing of the candle.
What markets does it work best?
Works on indices, forex, and high beta stocks.
What's the best time frame to use?
3mins or 5mins (for forex and commodities)
How to get access?
Please click on the link in the signature or send me a private message to get access.

Theft Indicator - 5Min Scalping SystemWhat is our indicator?
Theft Indicator - Buy & Sell Alert System is our first published script that shows price action on a certain period of time (We Use ATR indicator). We take pride in enabling trading to become easier for the experienced and the non-experienced traders around the globe. Buy & Sell alerts will be fired once a condition in our algo is met.
Does it Repaint?
Our indicator does NOT re-paint. Although while setting an alert it may pop up the repaint alert, please take into consideration that once a signal is fired on a "CLOSED BAR", our signal will never disappear, they do not repaint.
What Markets is it usable with?
You can use it in any market, Forex, Stocks, Crypto, Indices. All time frames are profitable, not all trades. But the Majority is profitable if you use a stop loss and target price.
How to use:
Simple plug and play it to your chart, in addition to a few other indicators we will recommend to you (we still have not published them yet), and this will confirm your trades. You can also connect TV alerts with a bot and let it run. Please be aware that SLIPPAGE time is important, If you run a bot on this indicator you HAVE to know that the buy/sell price will be on the bar AFTER the Candle close (For example: the BUY/SELL alert is on a candle, the buy/sell your bot or you will execute WILL be in the following candle depending on your trading system. We advise you to not leave the bot to trade on its own, you have to monitor and have a specific syntax that we will help you with creating according to your trading style.
How are the Buy/Sell Alerts fired?
We use the simple ATR (Average True Range) indicator. However we have modified the indicator to serve our trading system. Check below for a definition of what ATR is:
What is Average True Range - ATR?
The average true range (ATR) is a technical analysis indicator that measures market volatility by decomposing the entire range of an asset price for that period. Specifically, ATR is a measure of volatility introduced by market technician J. Welles Wilder Jr. The true range indicator is taken as the greatest of the following: current high less the current low; the absolute value of the current high less the previous close; and the absolute value of the current low less the previous close. The average true range is then a moving average, generally using 14 days, of the true ranges.
Why is our indicator special and different from the normal ATR indicators?
We have modified the mathematical equation and changed it slightly to give more accurate signals, we do not promise all trades are profitable, the use of this indicator is up to your own judgement and liability. We believe that we have an indicator like no other ATR.
P.S: This is not financial advice, we are just sharing our indicator that we know has good results, and it will take time for people in -ve profiles to recover losses and for the profiting to be more profitable. We use a specific trading method that only works with it
You can contact me for more information about the indicator, Goodluck :)

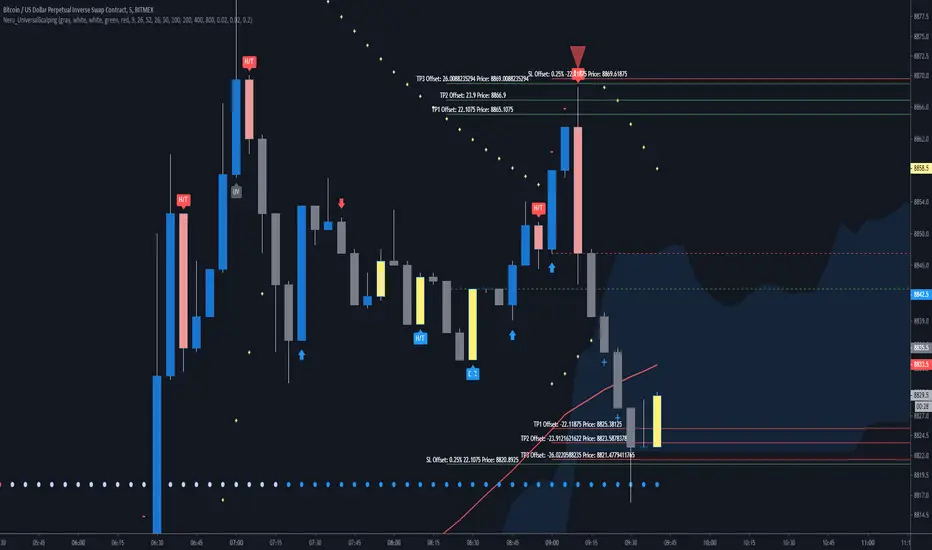
Neru_UniversalScalpingNeru_UniversalScalping - Tool
Markets: All markets, this is a universal tool which is using 100% standard settings for all built-in indicators.
Interval: 3 minutes to maximum 2 hours.
Built-In indicators:
- Basic Candlesticks (E/R as stronger one and H/T as weaker one)
- Stochastic breakups and breakdowns shown in different candle colors (close, 20 and 80)
- Extreme overbought and oversold conditions marked with a + an - (Stochastic >95 and <5)
- Daily and 4H Pivot Points
- Ichimoku Cloud (including Senkou´s, Tenkan + Kijun)
- 5 SMA´s (50,100,200,400 and 800)
- TrendEvaluator at the bottom, showing a basic trend (calculated from the cloud and 3 Moving Averages, 50, 100 and 200)
- Temporary buying + selling pressure labelled as arrows above and below candles
- Standard Parabolic Sar built-in
Risk Management:
You have the option to plot a basic risk calculation into the charts, based on the assumption, you don´t use a leverage and 100% equity.
Shown is a stop loss offset, the % and the price. Same goes for 3 take profits. Fees and spread are NOT included in this calculations.
You can choose between 0.25%, 0.5%, 1% and 1.5%, obviously the smaller the timeframe, the smaller risk you need to consider.
General Information:
All settings are adjustable, also in color and position.
This is not an automated system, that is generating entries and exits. With help of the built-in alarms you will have always to consider
the environment such as the trend, the relative position to the Pivot Points, the relative position to the Moving Averages and for example
conditions such as oversold / overbought and key-levels. It´s not replacing a human.
Please always be aware that counter trades on pullbacks are always more risky than trend-follow trades and a beginner should stick to less risk.
Warm regards, Neru
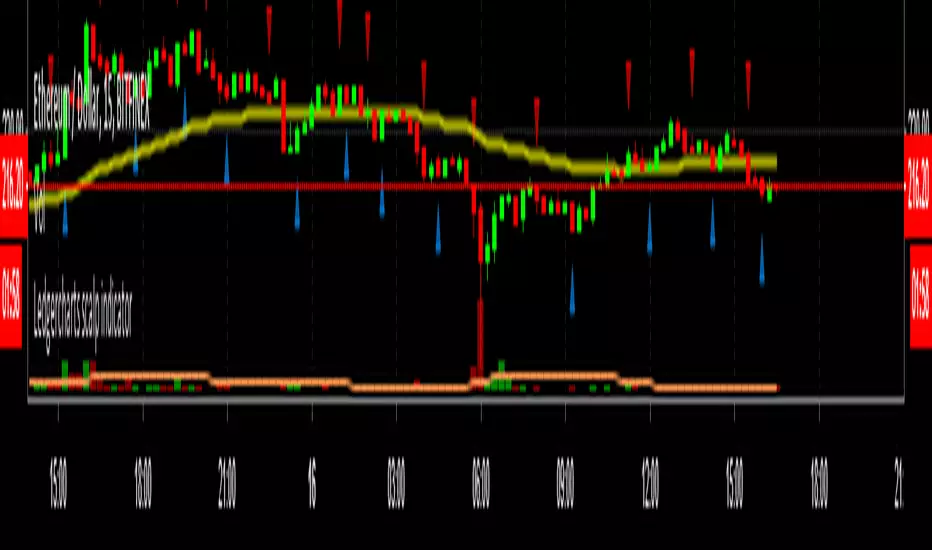
Ledgercharts scalp indicatorI'm using this indicator for finding scalp opportunities with high volume crypto coins. To be used in combination with support & resistance levels and/or other indicators.
Works best on a 15-minute timeframe.
DISCLAIMER:
This script is not intended as financial advice and is for educational purposes only. Do your own research by verifying the accuracy of the information and know that your decisions are your own.