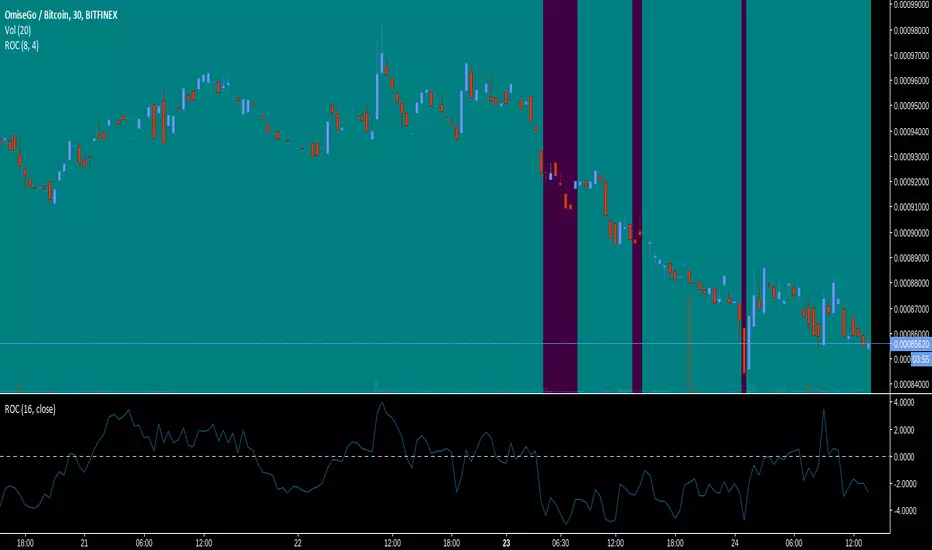
Rate Of Change Background (Sideways market)Colors the background of the chart aqua when the market is going sideways and purple when it's moving.Wskaźnik Pine Script®od kiasaki33130
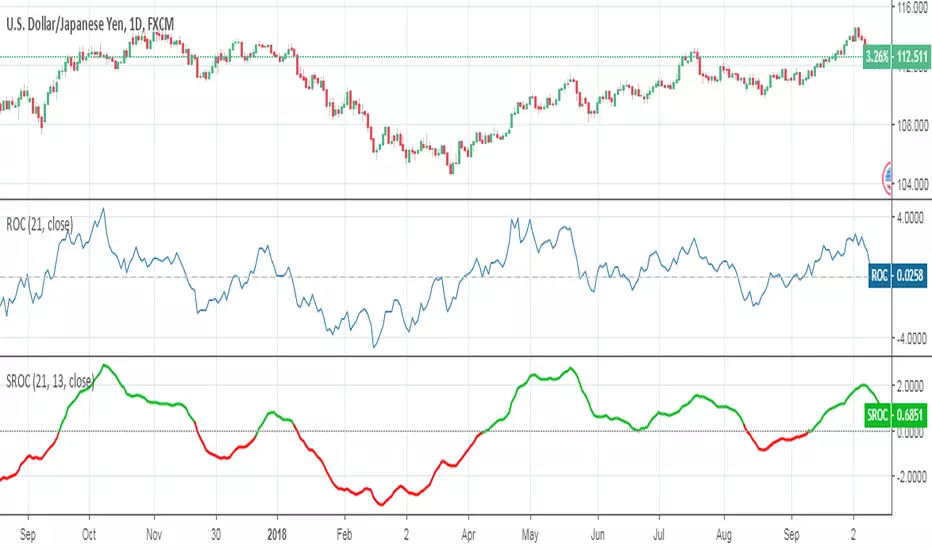
Smoothed Rate of ChangeSmoothed Rate of Change indicator script. This indicator was originally developed by Fred G. Schutzman.Wskaźnik Pine Script®od evergetZaktualizowano 11634
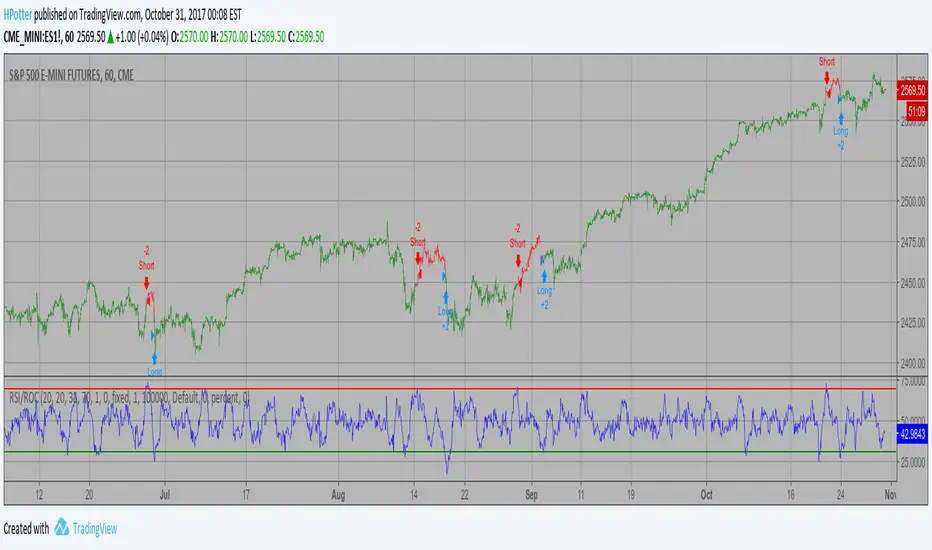
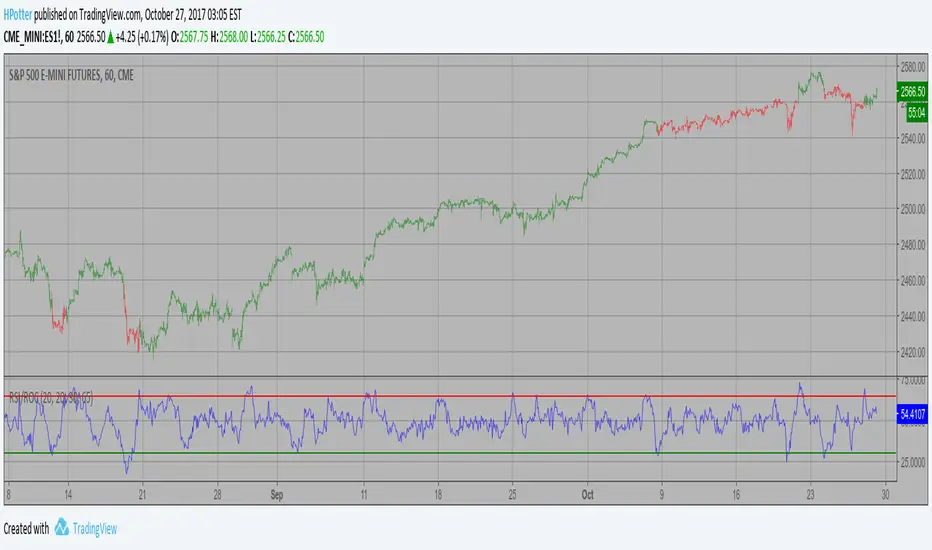
RSI based on ROC Backtest This is the new-age indicator which is version of RSI calculated upon the Rate-of-change indicator. The name "Relative Strength Index" is slightly misleading as the RSI does not compare the relative strength of two securities, but rather the internal strength of a single security. A more appropriate name might be "Internal Strength Index." Relative strength charts that compare two market indices, which are often referred to as Comparative Relative Strength. And in its turn, the Rate-of-Change ("ROC") indicator displays the difference between the current price and the price x-time periods ago. The difference can be displayed in either points or as a percentage. The Momentum indicator displays the same information, but expresses it as a ratio. You can change long to short in the Input Settings WARNING: - For purpose educate only - This script to change bars colors.Strategia Pine Script®od HPotter133
RSI based on ROC Strategy This is the new-age indicator which is version of RSI calculated upon the Rate-of-change indicator. The name "Relative Strength Index" is slightly misleading as the RSI does not compare the relative strength of two securities, but rather the internal strength of a single security. A more appropriate name might be "Internal Strength Index." Relative strength charts that compare two market indices, which are often referred to as Comparative Relative Strength. And in its turn, the Rate-of-Change ("ROC") indicator displays the difference between the current price and the price x-time periods ago. The difference can be displayed in either points or as a percentage. The Momentum indicator displays the same information, but expresses it as a ratio. WARNING: - This script to change bars colors.Wskaźnik Pine Script®od HPotter96
Forex strength meterCalculates the strength of a particular currency taking into account it's rate of change (% price change in a period) in all correlated and anti-correlated pairs. For instance, when looking for USD strength we will add ROC for USDCAD, USDCHF and USDJPY while subtract AUDUSD, EURUSD, GBPUSD and NZDUSD. After ROC step, one can smooth the result using EMA, or MACD. As the script needs to fetch values from multiple currencies it isn't the fastest one, but it gets its job done. Important: Only major currencies (AUD, CAD, CHF, EUR, GBP, JPY, NZD and USD) are considered.Wskaźnik Pine Script®od red193911204
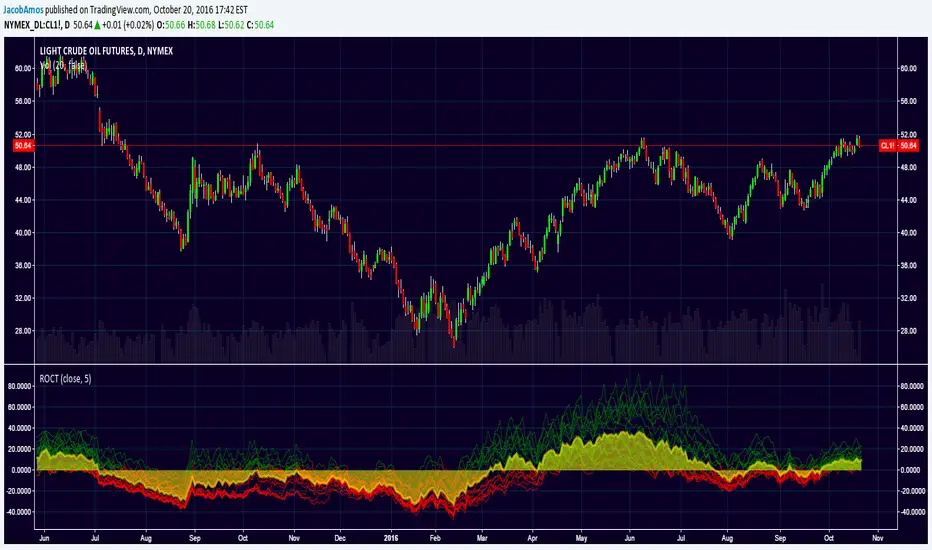
ROC TideAdds some depth to the traditional rate of change (ROC) indicator. Instead of just having one ROC line with a single lookback period, this takes a minimum lookback period, n , and plots 20 ROC lines with lookback periods of n, 2n, 3n, ..., 20n . These lines will appear green when greater than zero, red when less than zero, and yellow when equal to zero by default. Then it plots the average of those 20 ROC's as a yellow filled area so as to make it easier to see where the balance (or "tide") of the ROC waves are located.Wskaźnik Pine Script®od JacobAmos44400
GBPNZD ROC RF count strategyCode takes six pairs that are highly correlated to GBPNZD and determines if their ROC's are increasing or decreasing. If a pair has an increasing ROC it is given a 1, if decreasing a -1. The numbers are all added up (this is similar to a count for counting cards in blackjack). If the count goes positive the strategy enters a long position, if negative a short position. Code is tuned for GBPNZD for 1HR chart. Returns $97 on an initial balance of $100 (if I am reading Tradingview Tester correctly) *** Should work for GBPJPY, its has the same correlated pairs Comments welcomedStrategia Pine Script®od forexpirate2288
JPY GBP ROCsRate of change of most volatile JPY and GBP pairs. All pairs ending in JPY are red except GBPJPY (colored yellow --currently most volatile 7/2016). GBPNZD is blue, the other GBP pairs are green, lime and teal. GBPJPY and GBPNZD are my favorite day trading / swing trading pairs. This script allows me to see the action of the most volatile and liquid pairs on one screen. JPY pairs (ex-GBPJPY) are all red so that I see the flow of JPY not so much each pair and its name. Global movement of JPY is what I am after. Same for the coloring of GBP pairs as green expect GBPNZD as blue. ***** EURGBP is plotted as an opposite (with a negative in front of its sma. EURGBP is extremely correlated to GBPNZD, I decided to plot it also.Wskaźnik Pine Script®od forexpirate2296
FRAMA Rate of ChangeFractal Adaptive Moving Average Rate of Change. Use it with FRAMAWskaźnik Pine Script®od Shizaru22424
Weighted ROCWEIGHTED Rate of change for momentum rotation strategyWskaźnik Pine Script®od jivasmax22113
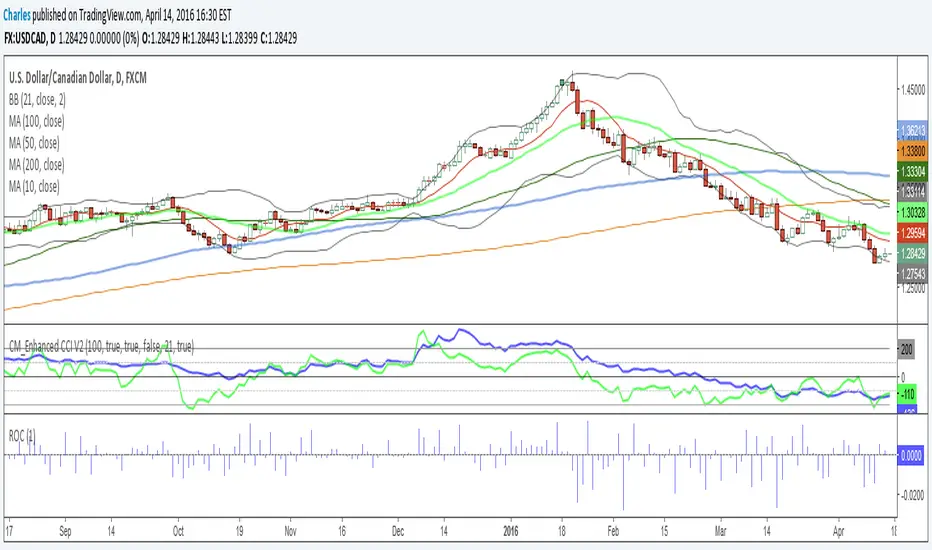
Rate Of Change - Absolute ValueMeasures the period's change in terms of the instrument's value (e.g. pip, dollar, etc) instead of as a percentage. I generally use it on a daily time frame with a period=1 to see how the current day's move compares with prior days' moves in order to gain a perspective into how this move ranks historically.Wskaźnik Pine Script®od Charles22198
BUY & SELL PRESSURE by RegressionBUY & SELL PRESSURE by Regression Analysis at candle price/volume (Rate-Of-Change) Ver. 3 By Ricardo M Arjona @XeL_Arjona DISCLAIMER: The Following indicator/code IS NOT intended to be a formal investment advice or recommendation by the author, nor should be construed as such. Users will be fully responsible by their use regarding their own trading vehicles/assets. The embedded code and ideas within this work are FREELY AND PUBLICLY available on the Web for NON LUCRATIVE ACTIVITIES and must remain as is. WHAT'S THIS? This is my 3rd. revision of the original implementation for AmiBroker by Karthik Marar's of it's BUY AND SELL PRESSURE INDICATORS but this time, constructed under a complete REGRESSIVE ANALYSIS premise based in Rate Of Change (A kind of Slope but measured in % Performance). Some minimal adaptation's (and cleaning) have been made: Instead of simple Range calculation at price, Rate Of Change (Regressive) is used. Oscillator of Pressure can be deactivated in favor of a simple RoC Cumulative Pressures at candle. Oscillator can read Volume data from external tickers for accurate Index calculation. ( NYA can use TVOL as example.) Code is small, cleaner and faster =) ! Cheers! Any feedback will be welcome... @XeL_ArjonaWskaźnik Pine Script®od xel_arjona22241
DecisionPoint Price Momentum Oscillator [LazyBear]The DecisionPoint Price Momentum Oscillator (PMO) is an oscillator based on a Rate of Change calculation that is smoothed twice with custom exponential moving averages. Because the PMO is normalized, it can also be used as a relative strength tool. PMO can be used in many ways: - PMO can be used to determine the OB/OS state. While the +2.5 to -2.5 is the usual range for broad stock market indexes, each price index will have its own “signature” range. You may have to tune this for your instrument. - PMO triggers buy/sell on signal crossovers and ZERO crossovers. - Common patterns like BullKiss, BearKiss are useful to track. See the link below for more info. - Divergences. - Histo-only mode that can be used similar to MACD-Histo. I have exposed all params as configurable. Have fun tuning :) Don't forget to share what you found for your instrument. More Info: stockcharts.com List of my public indicators: bit.ly List of my app-store indicators: blog.tradingview.com Some Sample Charts: TWTR: MSFT: GOOGL: Wskaźnik Pine Script®od LazyBear4747 9.1 K
Insync Index [LazyBear]BB Support + Histo mode ------------------------------- Code: pastebin.com Show enclosing BB Show Insync as Histo: v02 - Configurable levels --------------------------------- Small update to allow configuring the 95/75/25/5 levels. Latest source code: pastebin.com v01 - orginal description --------------------------------- Insync Index, by Norm North, is a consensus indicator. It uses RSI, MACD, MFI, DPO, ROC, Stoch, CCI and %B to calculate a composite signal. Basically, this index shows that when a majority of underlying indicators is in sync, a turning point is near. There are couple of ways to use this indicator. - Buy when crossing up 5, sell when crossing down 95. - Market is typically bullish when index is above 50, bearish when below 50. This can be a great confirmation signal for price action + trend lines. Also, since this is typical oscillator, look for divergences between price and index. Levels 75/25 are early warning levels. Note that, index > 75 (and less than 95) should be considered very bullish and index below 25 (but above 5) as very bearish. Levels 95/5 are equivalent to traditional OB/OS levels. The various values of the underlying components can be tuned via options page. I have also provided an option to color bars based on the index value. More info: The Insync Index by Norm North, TASC Jan 1995 drive.google.com List of my free indicators: bit.ly List of my app-store indicators: blog.tradingview.com (Support doc: bit.ly) Wskaźnik Pine Script®od LazyBear3535 2.2 K