Reversal Buy and Sell SignalsThis indicator is fast and minimalistic reversal-detection indicator designed to capture high-probability turning points in the market. It combines engulfing candlestick patterns, a strong candle body filter, and RSI momentum analysis to generate precise BUY and SELL signals with minimal noise.
Reversalsignal

BT Delta AbsorptionBT Absorption detects aggressive counterflow volume—moments where one side
of the market (buyers or sellers) attacks aggressively, yet price fails to move
proportionally.
This is the classic definition of absorption:
"Large market orders are being absorbed by strong passive limit orders."
Absorption is one of the most reliable early signals for:
Reversals
Trap conditions
Failed breakouts
Liquidity grabs
Fake displacement moves
---
■ What BT Absorption Measures
1. Delta Imbalance
Identifies when buying or selling pressure becomes unusually one-sided.
2. Volatility Mismatch
Shows when large delta does NOT translate into meaningful price movement.
3. Absorption Strength Score
A normalized reading (often 0–100) showing the intensity of counterflow activity.
4. Wick & Structure Absorption
Wick-driven absorption helps identify:
Failed sweeps
Stop hunts
Rejection zones
Trapped traders
---
■ Why Absorption Matters
Absorption almost always precedes:
Reversals
Failed breakout moves
SMC/ICT-style displacement
Order block formation
Trend continuation after a trap
When aggressive traders cannot move price toward their desired direction,
the move typically reverses quickly—and with force.
---
■ Visual Elements
• Bull Absorption Marker
Often appears near lows—signals seller aggression failing to push price down.
• Bear Absorption Marker
Often appears near highs—signals buyer aggression failing to break higher.
• Absorption Score Heatmap (optional)
Shows intensity of absorption per candle.
• Threshold Levels
Identify when absorption becomes statistically significant.
---
■ How to Use BT Absorption in Trading
1. Reversal Detection
Look for absorption after:
Equal highs/lows
Sweeps
Stop runs
Breakout failures
This is often the earliest possible signal that a reversal is coming.
2. Filter Breakouts
A breakout without absorption is usually weak.
A breakout with absorption against it is likely a fakeout.
3. Confirm SMC/ICT Concepts
The indicator pairs perfectly with:
Fair Value Gaps
Order Blocks
Liquidity sweeps
Displacement legs
If your setup triggers and absorption confirms → high confidence.
4. Identify Trap Conditions
Absorption often marks:
Trapped breakout chasers
Trapped trend shorts
Imbalanced orderflow
These create ideal high-R trades.
5. Alert-Driven Market Monitoring
Use alerts for:
Bull Absorption
Bear Absorption
High-strength absorption
Absorption clusters
This allows traders to step away from charts while still catching
high-probability reversals.
---
■ High-Probability Absorption Setups
A) Sweep + Absorption
Swept level → absorption → enter opposite direction.
B) Failed Breakout Absorption
Breaks structure → delta fails → absorption prints → strong reversal.
C) Trend Continuation Absorption
Absorption against the correction often precedes continuation.
D) Absorption Clusters
Multiple absorption signals indicate a structural market shift.
---
■ Final Summary
BT Absorption provides:
Early reversal signals
Counterflow pressure detection
Confirmation for existing setups
Identification of liquidity traps
Alert-based monitoring across multiple markets
BT Absorption is the perfect complement to BT Spike:
• BT Spike = detects volatility ignition
• BT Absorption = detects failed aggression + reversals
Combined, they form a complete liquidity and orderflow toolkit.

ReqoverAI Indicator Zero Lag🔑 Overview
ReqoverAI Indicator ZeroLag is a precision-engineered advanced AI detection tool for multi-asset trading strategies. This tool is designed to work for all time frames and asset classes (like Stocks, Commodities, Forex, Crypto and other Digital Assets). It uses advanced detection techniques that reduces lag and adapts to volatility. It combines a smoothing technique with adaptive reversal logic to highlight meaningful trend shifts earlier than conventional methods. It provides clear signals with built-in alerts, helping traders identify meaningful trend shifts earlier and with greater clarity.
⚙️Core Concepts
Smoothing Technique
Reduces the delay found in traditional moving averages, allowing faster response to price changes.
Adaptive Reversal Detection
Uses volatility- or percentage-based thresholds to identify potential pivots, helping filter out insignificant moves.
Signals
* Green “Buy” labels mark potential upward pivots.
* Red “Sell” labels mark potential downward pivots.
* Optional guideline plotted for trend visualization.
Alerts
Built-in TradingView alerts for Buy/Sell pivots, ready for automation or notifications.
📘 How to Use
Apply to chart: Works directly on price charts with Buy/Sell labels.
Select reversal mode:
* ATR-based (default, recommended for volatile assets).
* Percent-based (for more stable assets).
Interpret signals:
* Green “Buy” → potential upward movement.
* Red “Sell” → potential downward movement.
Combine with your strategy: Use ReqoverAI as a confirmation tool alongside your existing methods.
🧩 Originality & Value
Unique Approach: Integrates smoothing with a proprietary detection framework.
Not Just Another Indicator: Goes beyond standard moving averages or ATR scripts by dynamically managing pivots and reversals.
Vendor Justification: While it uses familiar elements, the hybrid detection logic is proprietary and unavailable in public domain scripts, making it valuable for traders seeking earlier and cleaner signals.
⚠️ Disclaimer
This indicator is a technical analysis tool. It does not guarantee profits or predict the future. Past performance does not ensure future results. Use responsibly and in combination with your own trading plan.

Volume-Confirmed Reversal Engine [AlgoPoint]Volume-Confirmed Reversal Engine v2.0
Overview
A price pattern alone is not enough to signal a high-probability reversal. True market turning points—moments of capitulation or euphoria—are almost always confirmed by a significant spike in volume.
The Volume-Confirmed Reversal Engine is designed to identify these exact moments. It filters out low-conviction price movements and focuses only on reversal patterns that are backed by meaningful volume activity.
How It Works
The indicator's logic is based on a sequential confirmation process:
- High-Volume Anchor Candle: The engine first scans for an "Anchor Candle"—a candle that makes a new high or low over a user-defined look_back period. Critically, this candle's volume must also be significantly higher than the recent average. Low-volume breakouts are ignored.
- Setup Activation & Visualization: When a valid Anchor Candle is detected, the indicator enters a "setup" phase. It visually marks this on your chart by drawing a Setup Box around the high and low of the Anchor Candle, extending it forward for the duration of the confirm_in window.
- Confirmation & Signal: A final signal is only triggered if the price breaks out of the opposite side of the Setup Box within the confirmation window. This action, combined with the initial volume spike, confirms the reversal.
- Setup Box Visualization: See exactly which candle the indicator is watching and the key price levels (the box boundaries) that need to be broken for a signal.
Signal Strength Score (1-4): Every signal now comes with a score, providing insight into its quality based on four factors:
- The base price pattern is met.
- The initial Anchor Candle had high volume.
- The final Confirmation Candle also had high volume.
- The signal is aligned with the long-term macro trend (e.g., a BUY signal above the 200 EMA).
Status Dashboard: A simple panel on your chart tells you what the indicator is doing in real-time ("Scanning for Setups," "Watching Bullish Setup," etc.) and displays a countdown for how many bars are left for a confirmation.
How to Interpret & Use
- The Box: When a colored box appears, it's an early warning that a reversal setup is active. Watch the boundaries of the box for a potential breakout.
- The Score: Use the score to gauge the quality of a signal. A 3/4 or 4/4 score represents a very high-conviction setup where multiple technical factors are aligned.
- The Dashboard: Use the panel to understand the indicator's current state and the time-sensitivity of an active setup.
- The BUY/SELL Labels: These are the final, actionable triggers, appearing only after the full price and volume confirmation process is complete.

LBR 3/10 'Sardine' Oscillator (ATR-Normalized)LBR 3/10 Oscillator - Short-Term Momentum Indicator
The LBR 3/10 "Sardine" Oscillator is a short-term momentum indicator developed by Linda Bradford Raschke. This ATR-normalized version provides cross-market comparability and consistent extreme levels across all timeframes and asset classes.
What is the LBR 3/10 Oscillator?
The LBR 3/10 is designed to capture very short-term momentum shifts by measuring the difference between a 3-period and 10-period moving average. Named after Linda Bradford Raschke's "Trading Sardines" book, this oscillator excels at identifying rapid momentum changes and potential reversal points.
Formula: / ATR(10) × 100
Where MA can be either Simple Moving Average (SMA) or Exponential Moving Average (EMA).
Why ATR Normalization?
Problem with Traditional Oscillators:
Traditional momentum oscillators produce values that vary dramatically across different markets and time periods. A reading of 5 might be extreme for one asset but insignificant for another.
Solution:
ATR normalization divides the raw momentum value by the Average True Range, creating standardized readings that are:
Comparable Across Markets: Same interpretation whether analyzing stocks, forex, commodities, or crypto
Comparable Across Time: Readings maintain consistent meaning regardless of price levels
Universal Extreme Levels: The ±125 levels work consistently across all assets and timeframes
Statistical Research
Extensive statistical analysis across multiple markets identified the ±125 extreme levels:
+125 Level: Reached approximately 4% of the time (extreme bullish momentum)
-125 Level: Reached approximately 2% of the time (extreme bearish momentum)
These statistically-validated levels provide objective definitions for overbought and oversold conditions, eliminating subjective interpretation.
Key Features
Core Components
LBR 3/10 Line: Main oscillator showing normalized short-term momentum
Signal Line: Smoothed moving average of the oscillator (default: 9-period)
Extreme Levels: Horizontal lines at ±125 marking statistical extremes
Zero Line: Separates bullish and bearish momentum regimes
Visual Elements
Blue Line: LBR 3/10 oscillator (main momentum line)
Red Line: Signal line (smoothed moving average of oscillator)
Fill Area: Light blue shaded region between oscillator and signal line
Background Zones: Light red (overbought above +125) or light green (oversold below -125)
Horizontal Lines: Gray dashed lines at +125, -125, and 0 (zero line solid)
Divergence Markers: Green/red circles marking price/oscillator divergences
Signal Crosses: Small green/red triangles marking oscillator/signal line crossovers
Pullback Markers: Yellow diamond shapes with white "↑PB" or "↓PB" text for first pullback signals
Std Dev Bands: Orange circles marking statistical extreme levels (optional, disabled by default)
Advanced Features
MA Type Selection: Choose between SMA or EMA for both oscillator and signal line
Standard Deviation Bands: Optional adaptive extreme levels based on statistical volatility
Pullback Detection: Identifies high-probability counter-trend entries during established trends
First Pullback Filter: Noise reduction system that highlights initial pullback after trend change
Trading Applications
1. Extreme Level Reversals
When the oscillator reaches ±125, it indicates stretched momentum conditions:
Above +125: Overbought - watch for bearish reversal signals
Below -125: Oversold - watch for bullish reversal signals
2. Signal Line Crossovers
Bullish Cross: Oscillator crosses above signal line (momentum shift up)
Bearish Cross: Oscillator crosses below signal line (momentum shift down)
3. Zero Line Crosses
Signal line crossing zero indicates trend regime changes:
Cross Above 0: Transition to bullish trend
Cross Below 0: Transition to bearish trend
4. Divergence Trading
Bullish Divergence: Price makes lower low, oscillator makes higher low
Bearish Divergence: Price makes higher high, oscillator makes lower high
Best used in combination with other momentum indicators for confirmation
5. Pullback Strategy (High-Probability Setup)
Uptrend Pullback: Signal line positive + oscillator crosses below (buy opportunity)
Downtrend Pullback: Signal line negative + oscillator crosses above (sell opportunity)
First Pullback: Initial counter-trend signal after trend change (highest probability)
6. "Anti" Setup
Linda Bradford Raschke's classic setup:
Wait for extreme reading (±125)
Enter on first pullback signal in opposite direction
Captures momentum exhaustion reversals
Comprehensive Alert System
Extreme Level Alerts
Crossed above +125 (overbought)
Crossed below -125 (oversold)
Divergence Alerts
Bullish divergence detected
Bearish divergence detected
Signal Cross Alerts
Bullish cross (oscillator above signal)
Bearish cross (oscillator below signal)
Trend Change Alerts
Signal line crossed above zero (trend change to bullish)
Signal line crossed below zero (trend change to bearish)
Pullback Alerts
Pullback in uptrend (potential buy)
Pullback in downtrend (potential sell)
FIRST pullback in uptrend (high-probability buy)
FIRST pullback in downtrend (high-probability sell)
Settings & Parameters
LBR 3/10 Settings
Fast MA Length: Short-term period (default: 3)
Slow MA Length: Baseline period (default: 10)
ATR Length: Volatility normalization period (default: 10)
MA Type: SMA or EMA selection
Extreme High Level: Overbought threshold (default: 125)
Extreme Low Level: Oversold threshold (default: -125)
Signal Line
Show Signal Line: Enable/disable display (default: true)
Signal Line Length: Smoothing period (default: 9)
Divergence Detection
Show Divergences: Enable/disable detection (default: true)
Divergence Lookback: Pivot detection period (default: 5)
Standard Deviation Bands
Show Std Dev Bands: Enable/disable adaptive levels (default: false)
Std Dev Multiplier: Band width adjustment (default: 1.5)
Std Dev Length: Calculation period (default: 100)
Best Practices
Trending Markets
Focus on pullback signals in direction of trend
Use first pullback filter for highest-probability entries
Watch for extreme levels as profit-taking zones
Ranging Markets
Trade reversals at extreme levels (±125)
Use divergences with additional momentum indicator confirmation
Avoid signal line crosses near zero (low-quality signals)
Multi-Timeframe Analysis
Higher timeframe: Identify trend direction (signal line above/below zero)
Lower timeframe: Time precise entries using pullback signals
Confirmation: Use additional momentum indicators for signal validation
Risk Management
Reduce position size at extreme levels (increased reversal risk)
Use ATR-based stops (e.g., 2× ATR from entry)
Exit on opposite extreme level or signal line zero cross
Chart Legend - Visual Signal Guide
Lines and Fills
🔵 Blue Line: LBR 3/10 oscillator value
🔴 Red Line: Signal line (9-period MA of oscillator)
💠 Light Blue Fill: Area between oscillator and signal line (visual momentum gauge)
Background Colors
🟥 Light Red Background: Extreme overbought zone (LBR > +125)
🟩 Light Green Background: Extreme oversold zone (LBR < -125)
Horizontal Reference Lines
➖ +125 (Gray Dashed): Overbought extreme level
➖ 0 (Gray Solid): Zero line - trend separator
➖ -125 (Gray Dashed): Oversold extreme level
Signal Markers
🟢 Green Circle: Bullish divergence detected (price lower low, oscillator higher low)
🔴 Red Circle: Bearish divergence detected (price higher high, oscillator lower high)
▲ Green Triangle Up: Bullish signal cross (oscillator crosses above signal line)
▼ Red Triangle Down: Bearish signal cross (oscillator crosses below signal line)
Yellow Diamond "↑PB": First pullback in uptrend (high-probability buy setup)
Yellow Diamond "↓PB": First pullback in downtrend (high-probability sell setup)
Combining with MACD-V+ Indicator
LBR 3/10 and MACD-V+ work together as a powerful two-timeframe momentum system:
Indicator Roles
MACD-V+: Strategic direction (12-26 period) - identifies market regime and lifecycle state
LBR 3/10: Tactical timing (3-10 period) - pinpoints precise entry and exit moments
Key Principles
Strategic Filter: MACD-V+ determines IF you should trade (market regime)
Tactical Timing: LBR 3/10 determines WHEN to enter (precise timing)
Confirmation Reduces Risk: Trade only when both indicators agree
Respect Lifecycle Changes: Exit when MACD-V+ state changes against your position
Methodology
The LBR 3/10 indicator implements statistical analysis and volatility normalization techniques to create a universal short-term momentum tool. This approach enables consistent interpretation across all markets and timeframes.
The indicator implements:
ATR-based normalization for cross-market comparability
Statistical extreme level validation (±125 levels)
Noise reduction through first pullback filtering
Dual MA type support (SMA/EMA) for flexibility
Standard deviation bands for adaptive threshold levels
LBR 3/10 provides traders with a precise tool for short-term momentum analysis and tactical entry timing. Combined with proper risk management and multi-timeframe analysis, it offers objective signals for both trend-following and reversal trading strategies.
This indicator is designed for educational and analytical purposes. Past performance does not guarantee future results. Always conduct thorough research and consider consulting with financial professionals before making investment decisions.

Triple Trend v2 [DLL]Triple Trend v2 is a multi-layer trend detection tool using three customizable Supertrend calculations.
Plots three trend lines (short, medium, long) with independent ATR settings.
Highlights trend flips with labels (1, 2, 3) showing which trend(s) changed.
Integrates RSI reversal detection (fixed or dynamic) with optional reversal lines and labels.
Includes a bar-size filter to ignore insignificant flips.
Displays a multi-timeframe trend table for higher-timeframe confirmation.
Provides built-in alerts for flips, RSI thresholds, and reversals.

Vix_Fix Enhanced MTF [Cometreon]The VIX Fix Enhanced is designed to detect market bottoms and spikes in volatility, helping traders anticipate major reversals with precision. Unlike standard VIX Fix tools, this version allows you to control the standard deviation logic, switch between chart styles, customize visual outputs, and set up advanced alerts — all with no repainting.
🧠 Logic and Calculation
This indicator is based on Larry Williams' VIX Fix and integrates features derived from community requests/advice, such as inverse VIX logic.
It calculates volatility spikes using a customizable standard deviation of the lows and compares it to a moving high to identify potential reversal points.
All moving average logic is based on Cometreon's proprietary library, ensuring accurate and optimized calculations on all 15 moving average types.
🔷 New Features and Improvements
🟩 Custom Visual Styles
Choose how you want your VIX data displayed:
Line
Step Line
Histogram
Area
Column
You can also flip the orientation (bottom-up or top-down), change the source ticker, and tailor the display to match your charting preferences.
🟩 Multi-MA Standard Deviation Calculation
Customize the standard deviation formula by selecting from 15 different moving averages:
SMA (Simple Moving Average)
EMA (Exponential Moving Average)
WMA (Weighted Moving Average)
RMA (Smoothed Moving Average)
HMA (Hull Moving Average)
JMA (Jurik Moving Average)
DEMA (Double Exponential Moving Average)
TEMA (Triple Exponential Moving Average)
LSMA (Least Squares Moving Average)
VWMA (Volume-Weighted Moving Average)
SMMA (Smoothed Moving Average)
KAMA (Kaufman’s Adaptive Moving Average)
ALMA (Arnaud Legoux Moving Average)
FRAMA (Fractal Adaptive Moving Average)
VIDYA (Variable Index Dynamic Average)
This gives you fine control over how volatility is measured and allows tuning the sensitivity for different market conditions.
🟩 Full Control Over Percentile and Deviation Conditions
You can enable or disable lines for standard deviation and percentile conditions, and define whether you want to trigger on over or under levels — adapting the indicator to your exact logic and style.
🟩 Chart Type Selection
You're no longer limited to candlestick charts! Now you can use Vix_Fix with different chart formats, including:
Candlestick
Heikin Ashi
Renko
Kagi
Line Break
Point & Figure
🟩 Multi-Timeframe Compatibility Without Repainting
Use a different timeframe from your chart with confidence. Signals remain stable and do not repaint. Perfect for spotting long-term reversal setups on lower timeframes.
🟩 Alert System Ready
Configure alerts directly from the indicator’s panel when conditions for over/under signals are met. Stay informed without needing to monitor the chart constantly.
🔷 Technical Details and Customizable Inputs
This indicator includes full control over the logic and appearance:
1️⃣ Length Deviation High - Adjusts the lookback period used to calculate the high deviation level of the VIX logic. Shorter values make it more reactive; longer values smooth out the signal.
2️⃣ Ticker - Choose a different chart type for the calculation, including Heikin Ashi, Renko, Kagi, Line Break, and Point & Figure.
3️⃣ Style VIX - Change the visual style (Line, Histogram, Column, etc.), adjust line width, and optionally invert the display (bottom-to-top).
📌 Fill zones for deviation and percentile are active only in Line and Step Line modes
4️⃣ Use Standard Deviation Up / Down - Enable the overbought and oversold zone logic based on upper and lower standard deviation bands.
5️⃣ Different Type MA (for StdDev) - Choose from 15 different moving averages to define the calculation method for standard deviation (SMA, EMA, HMA, JMA, etc.), with dedicated parameters like Phase, Sigma, and Offset for optimized responsiveness.
6️⃣ BB Length & Multiplier - Adjust the period and multiplier for the standard deviation bands, similar to how Bollinger Bands work.
7️⃣ Show StdDev Up / Down Line - Enable or disable the visibility of upper and lower standard deviation boundaries.
8️⃣ Use Percentile & Length High - Activate the percentile-based logic to detect extreme values in historical volatility using a customizable lookback length.
9️⃣ Highest % / Lowest % - Set the high and low percentile thresholds (e.g., 85 for high, 99 for low) that will be used to trigger over/under signals.
🔟 Show High / Low Percentile Line - Toggle the visual display of the percentile boundaries directly on the chart for clearer signal reference.
1️⃣1️⃣ Ticker Settings – Customize parameters for special chart types such as Renko, Heikin Ashi, Kagi, Line Break, and Point & Figure, adjusting reversal, number of lines, ATR length, etc.
1️⃣2️⃣ Timeframe – Enables using SuperTrend on a higher timeframe.
1️⃣3️⃣ Wait for Timeframe Closes -
✅ Enabled – Displays Vix_Fix smoothly with interruptions.
❌ Disabled – Displays Vix_Fix smoothly without interruptions.
☄️ If you find this indicator useful, leave a Boost to support its development!
Every feedback helps to continuously improve the tool, offering an even more effective trading experience. Share your thoughts in the comments! 🚀🔥

3 Bar Reversal3 Bar Reversal
This pattern is described in John Carter's "Mastering the Trade"
The 3 Bar Reversal indicator is a simple but effective price action tool designed to highlight potential short-term reversals in market direction. It monitors consecutive bar behavior and identifies turning points based on a three-bar pattern. This tool can assist traders in spotting trend exhaustion or early signs of a reversal, particularly in scalping or short-term trading strategies.
How It Works
This indicator analyzes the relationship between consecutive bar closes:
It counts how many bars have passed since the price closed higher than the previous close (barssince(close >= close )) — referred to as an "up streak".
It also counts how many bars have passed since the price closed lower than the previous close (barssince(close <= close )) — known as a "down streak".
A reversal condition is met when:
There have been exactly 3 bars in a row moving in one direction (up or down), and
The 4th bar closes in the opposite direction.
When this condition is detected, the script performs two actions:
Plots a triangle on the chart to signal the potential reversal:
A green triangle below the bar for a possible long (buy) opportunity.
A red triangle above the bar for a possible short (sell) opportunity.
Triggers an alert condition so users can set notifications for when a reversal is detected.
Interpretation
Long Signal: The market has printed 3 consecutive lower closes, followed by a higher close — suggesting bullish momentum may be emerging.
Short Signal: The market has printed 3 consecutive higher closes, followed by a lower close — indicating possible bearish momentum.
These patterns are common in market retracements and can act as confirmation signals when used with other indicators such as RSI, MACD, support/resistance, or volume analysis.
Usage Examples
Scalping: Use the reversal signal to quickly enter short-term trades after a short-term exhaustion move.
Swing Trading: Combine this with trend indicators (e.g., moving averages) to time pullbacks within larger trends.
Confirmation Tool: Use this indicator alongside candlestick patterns or support/resistance zones to validate entry or exit points.
Alert Setup: Enable alerts based on the built-in alertcondition to receive instant notifications for potential trade setups.
Limitations
The 3-bar reversal logic does not guarantee a trend change; it signals potential reversals, which may need confirmation.
Best used in conjunction with broader context such as trend direction, market structure, or other technical indicators.

Momentum Nexus Oscillator [UAlgo]The "Momentum Nexus Oscillator " indicator is a comprehensive momentum-based tool designed to provide traders with visual cues on market conditions using multiple oscillators. By combining four popular technical indicators—RSI (Relative Strength Index), VZO (Volume Zone Oscillator), MFI (Money Flow Index), and CCI (Commodity Channel Index)—this heatmap offers a holistic view of the market's momentum.
The indicator plots two lines: one representing the current chart’s combined momentum score and the other representing a higher timeframe’s (HTF) score, if enabled. Through smooth gradient color transitions and easy-to-read signals, the Momentum Nexus Heatmap allows traders to easily identify potential trend reversals or continuation patterns.
Traders can use this tool to detect overbought or oversold conditions, helping them anticipate possible long or short trade opportunities. The option to use a higher timeframe enhances the flexibility of the indicator for longer-term trend analysis.
🔶 Key Features
Multi-Oscillator Approach: Combines four popular momentum oscillators (RSI, VZO, MFI, and CCI) to generate a weighted score, providing a comprehensive picture of market momentum.
Dynamic Color Heatmap: Utilizes a smooth gradient transition between bullish and bearish colors, reflecting market momentum across different thresholds.
Higher Timeframe (HTF) Compatibility: Includes an optional higher timeframe input that displays a separate score line based on the same momentum metrics, allowing for multi-timeframe analysis.
Customizable Parameters: Adjustable RSI, VZO, MFI, and CCI lengths, as well as overbought and oversold levels, to match the trader’s strategy or preference.
Signal Alerts: Built-in alert conditions for both the current chart and higher timeframe scores, notifying traders when long or short entry signals are triggered.
Buy/Sell Signals: Displays visual signals (▲ and ▼) on the chart when combined scores reach overbought or oversold levels, providing clear entry cues.
User-Friendly Visualization: The heatmap is separated into four sections representing each indicator, providing a transparent view of how each contributes to the overall momentum score.
🔶 Interpreting Indicator:
Combined Score
The indicator generates a combined score by weighing the individual contributions of RSI, VZO, MFI, and CCI. This score ranges from 0 to 100 and is plotted as a line on the chart. Lower values suggest potential oversold conditions, while higher values indicate overbought conditions.
Color Heatmap
The indicator divides the combined score into four distinct sections, each representing one of the underlying momentum oscillators (RSI, VZO, MFI, and CCI). Bullish (greenish) colors indicate upward momentum, while bearish (grayish) colors suggest downward momentum.
Long/Short Signals
When the combined score drops below the oversold threshold (default is 26), a long signal (▲) is displayed on the chart, indicating a potential buying opportunity.
When the combined score exceeds the overbought threshold (default is 74), a short signal (▼) is shown, signaling a potential sell or short opportunity.
Higher Timeframe Analysis
If enabled, the indicator also plots a line representing the combined score for a higher timeframe. This can be used to align lower timeframe trades with the broader trend of a higher timeframe, providing added confirmation.
Signals for long and short entries are also plotted for the higher timeframe when its combined score reaches overbought or oversold levels.
🔶Purpose of Using Multiple Technical Indicators
The combination of RSI, VZO, MFI, and CCI in the Momentum Nexus Heatmap provides a comprehensive approach to analyzing market momentum by leveraging the unique strengths of each indicator. This multi-indicator method minimizes the limitations of using just one tool, resulting in more reliable signals and a clearer understanding of market conditions.
RSI (Relative Strength Index)
RSI contributes by measuring the strength and speed of recent price movements. It helps identify overbought or oversold levels, signaling potential trend reversals or corrections. Its simplicity and effectiveness make it one of the most widely used indicators in technical analysis, contributing to momentum assessment in a straightforward manner.
VZO (Volume Zone Oscillator)
VZO adds the critical element of volume to the analysis. By assessing whether price movements are supported by significant volume, VZO distinguishes between price changes that are driven by real market conviction and those that might be short-lived. It helps validate the strength of a trend or alert the trader to potential weakness when price moves are unsupported by volume.
MFI (Money Flow Index)
MFI enhances the analysis by combining price and volume to gauge money flow into and out of an asset. This indicator provides insight into the participation of large players in the market, showing if money is pouring into or exiting the asset. MFI acts as a volume-weighted version of RSI, giving more weight to volume shifts and helping traders understand the sustainability of price trends.
CCI (Commodity Channel Index)
CCI contributes by measuring how far the price deviates from its statistical average. This helps in identifying extreme conditions where the market might be overextended in either direction. CCI is especially useful for spotting trend reversals or continuations, particularly during market extremes, and for identifying divergence signals.
🔶 Disclaimer
Use with Caution: This indicator is provided for educational and informational purposes only and should not be considered as financial advice. Users should exercise caution and perform their own analysis before making trading decisions based on the indicator's signals.
Not Financial Advice: The information provided by this indicator does not constitute financial advice, and the creator (UAlgo) shall not be held responsible for any trading losses incurred as a result of using this indicator.
Backtesting Recommended: Traders are encouraged to backtest the indicator thoroughly on historical data before using it in live trading to assess its performance and suitability for their trading strategies.
Risk Management: Trading involves inherent risks, and users should implement proper risk management strategies, including but not limited to stop-loss orders and position sizing, to mitigate potential losses.
No Guarantees: The accuracy and reliability of the indicator's signals cannot be guaranteed, as they are based on historical price data and past performance may not be indicative of future results.

Reversal and Breakout Signals [AlgoAlpha]🚀🌟 Introducing the Reversal and Breakout Signals by AlgoAlpha 🌟🚀
This innovative tool is crafted to enhance your chart analysis by identifying potential reversal and breakout opportunities directly on your charts. It's designed with both novice and experienced traders in mind, providing intuitive visual cues for better decision-making. Let's dive into the key features and how it operates:
### Key Features:
🔶 Dynamic Period Settings: Customize the sensitivity of the indicator with user-defined periods for both the indicator and volume strength.
📊 Volume Threshold: Set a threshold to define what constitutes strong volume, enabling the identification of significant market movements.
💡 Trend Coloring: Option to color candles during trends, making it easier to visualize bullish and bearish market conditions.
🌈 Customizable Visuals: Choose your preferred colors for bullish, bearish, and breakout signals, personalizing the chart to your liking.
🚨 Advanced Alert System: Configure alerts for reversal and breakout signals, ensuring you never miss a potential trading opportunity.
### How to Use:
To maximize the effectiveness of the Reversal and Breakout Signals tool, follow these steps:
1. 🔧 Set Up Your Preferences:
- Adjust the Indicator Period and Volume Strength Period to match the timeframe of your trading strategy. This fine-tuning allows the indicator to better align with your specific market analysis needs.
- Define the Strong Volume Threshold to distinguish between ordinary and significant volume movements. This helps in identifying breakout or reversal signals with higher confidence.
2. 🎨 Customize Visuals:
- Choose colors for Bullish , Bearish , and Breakout Signals to visually differentiate between different types of market activities. This customization facilitates quicker decision-making while scanning charts.
3. 🔍 Reversal Signals:
- Bullish Reversal : Look for a triangle below the bar indicating a potential upward movement. It's identified when the price dips below the lower level but closes above it, suggesting a rejection of lower prices.
- Bearish Reversal : A triangle above the bar signals a potential downward movement. This occurs when the price spikes above the upper level but closes below, indicating a rejection of higher prices.
4. 📈 Trend and Breakout Signals:
- Diamonds represent breakout signals. A bullish breakout is marked below the bar when the price closes above the upper level, suggesting strong buying pressure. Conversely, a bearish breakout above the bar indicates strong selling pressure as the price closes below the lower level.
- The tool also features a Trend Tracker that highlights the current market trend using the Hull Moving Average (HMA). This can help you stay aligned with the overall market direction for your trades.
By integrating these steps into your trading strategy, the Reversal and Breakout Signals tool can provide actionable insights to help identify potential entry and exit points, enhancing your trading decisions with visual cues and alerts for market reversals and breakouts.
### How It Works:
The core logic revolves around calculating weighted moving averages of high and low prices over a user-defined period, identifying the highest and lowest points within this period to establish potential breakout or breakdown levels while reducing the amount of noise, hence the use of moving averages.
1. Weighted Moving Averages Calculation:
sh = ta.wma(high, len)
sl = ta.wma(low, len)
h = ta.highest(sh, len)
l = ta.lowest(sl, len)
2. Breakout and Reversal Detection:
The script then employs logic to detect bullish and bearish breakouts and reversals based on the closing price's position relative to these levels, combined with volume analysis to confirm the strength of the move.
if not (h < h or h > h )
hstore := h
if not (l < l or l > l )
lstore := l
bullishbreakout := (breakout or ((breakout or breakout or breakout or breakout ) and candledir == 1)) and strongvol and not (bullishbreakout or bullishbreakout or bullishbreakout )
bearishbreakout := (breakdown or ((breakdown or breakdown or breakdown or breakdown ) and candledir == -1)) and strongvol and not (bearishbreakout or bearishbreakout or bearishbreakout )
3. Visual Indicators and Alerts:
Visual cues such as triangle shapes for reversals and diamonds for breakouts, along with colored bars, make it easy to spot these opportunities. Additionally, alerts can be set up for these events, ensuring traders can react promptly to potential trading setups.
plotshape(bullishrej and not (state ==- 1) ? low * 0.9995 : na, " Bullish Reversal ", shape.triangleup, location.belowbar, color.new(green, 0), size = size.tiny, text = "𝓡", textcolor = color.gray)
plotshape(bearishrej and not (state == 1) ? high * 1.0005 : na, " Bearish Reversal ", shape.triangledown, location.abovebar, color.new(red, 0), size = size.tiny, text = "𝓡", textcolor = color.gray)
plotshape(bullishbreakout ? low * 0.999 : na, " Bullish Breakout ", shape.diamond, location.belowbar, color.new(yellow, 0), size = size.tiny, text = "𝓑", textcolor = color.gray)
plotshape(bearishbreakout ? high * 1.001 : na, " Bearish Breakout ", shape.diamond, location.abovebar, color.new(yellow, 0), size = size.tiny, text = "𝓑", textcolor = color.gray)
This script is a versatile tool designed to aid in the identification of key reversal and breakout points, helping traders to make informed decisions based on technical analysis. Its customization options allow for a tailored analysis experience, fitting the unique needs and strategies of each trader.

VWAP Divergence | Flux ChartsThe VWAP Divergence indicator aims to find divergences between price action and the VWAP indicator. It uses filters to filter out many of the false divergences and alert high quality, accurate signals.
Red dots above the candle represent bearish divergences, while green dots below the candle represent bullish divergences.
The main filter for divergences focuses on ATR and the price movement in the past candles up to the lookback period. Divergences are determined when a price movement over the lookback period is sharp enough to be greater/less than the ATR multiplier multiplied by the ATR.
Settings
Under "Divergence Settings", both the lookback period and ATR multiplier can be adjusted.
Due to the nature of the calculations, the ATR multiplier and the lookback period should be set lower on higher time frames. As price movements become more averaged, for example on the 15 minute chart, sharp price movements happen less frequently and are often contained in fewer candles as they happen on lower time frames. Less volatile stocks such as KO, CL, or BAC should also use lower ATR multipliers and lower lookback periods.
Under "Visual Settings", you can change the color of the VWAP line, show alternating VWAP colors, adjust divergence signal size, and show the VWAP line.

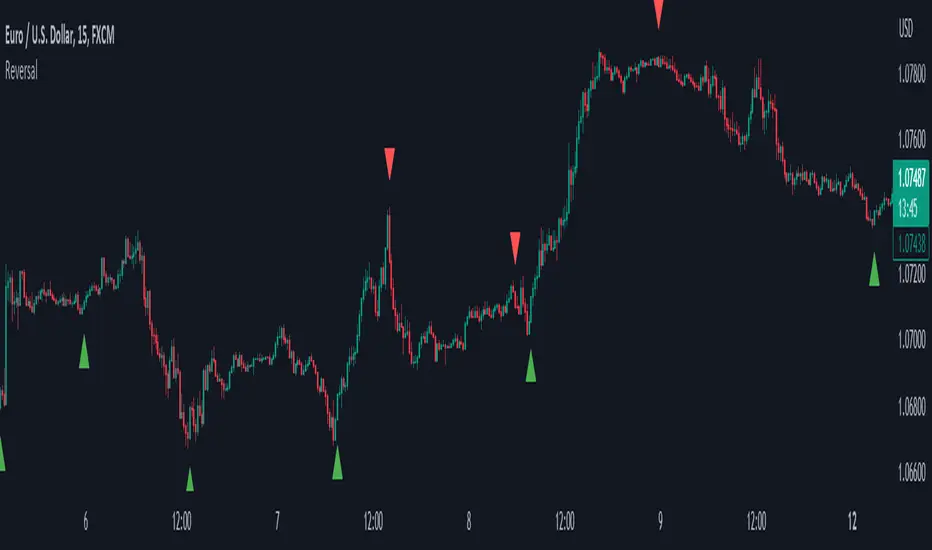
ReversalThe primary objective of this indicator is to discern candles that exhibit characteristics suggestive of potential market reversals through the application of candlestick analysis. Extensive observation across various assets and timeframes has revealed the existence of a recurrent reversal pattern. This pattern typically manifests as a sequence of one to three candles that abruptly diverge from the prevailing price action or trend, offering a distinctive signal indicating a potential reversal.
By leveraging the insights gained from this observation, the indicator aims to assist traders in identifying these noteworthy candle patterns that hold the potential to indicate significant market shifts.
The indicator operates as follows: initially, it identifies the lowest close (in the case of a bullish reversal) or the highest close (in the case of a bearish reversal) within a specified number of previous candles, as determined by user input (referred to as "Candle Lookback").
Next, the indicator examines whether the closing price surpasses the high of the previously identified lowest (bullish reversal) or highest (bearish reversal) closed candle within a designated number of candles, as specified by the user (referred to as "Confirm Within").
Buy/Sell Toolkit (Expo)█ Overview
The Buy/Sell Toolkit is a comprehensive trading tool designed to provide a holistic approach to trading. It brings together essential trading indicators and features in one place, simplifying the trading process and offering valuable insights into the market.
The indicator serves as an all-inclusive solution for traders seeking in-depth technical insights. While the Buy/Sell Toolkit can be utilized alongside other technical analysis methods, it can also be used as a standalone toolkit, adaptable to any trading style. In addition, each feature is thoughtfully integrated because not all technical indicators are suitable for every market condition or trading style.
The Buy/Sell toolkit works in any market and timeframe for discretionary analysis and includes many features:
█ Features
Buy/Sell signals: This feature provides real-time Buy/Sell trading signals for any market and timeframe. These signals are based on the trend.
Contrarian Signals: This feature provides real-time contrarian signals to take a position against the prevailing market trend.
Ultimate Trend: This feature assists in identifying the overall trend of the market, recognizing whether the market is in an uptrend, downtrend, or sideways.
Trend Advisor: The Trend Advisor helps traders understand the trend's strength, duration, and direction.
Trend Reversal: This feature identifies potential points where the current market may reverse within a trend. It's basically a trend-following line based on reversal calculation; it helps traders catch trend continuation setups.
Momentum Average: This indicator measures the rate of change in prices to identify the strength of the current trend. It can be beneficial for spotting potential price breakouts or warning of a market slowdown and pullbacks.
Take Profit Points: This feature suggests optimal points to exit a trade and lock in profits. It determines these points by using various factors such as volatility, support and resistance levels, and historical price movements.
Candle Coloring, Arithmetic Candlesticks, including Arithmetic Heikin Ashi: This feature provides an excellent visual aid to assist traders in recognizing patterns, identifying trends, and optimizing their trading strategies. The Arithmetic Candlesticks help smooth out price volatility and identify market trends more clearly.
Reversal Cloud: This innovative feature provides a graphical representation of potential price reversal zones. The cloud helps traders visualize where the price might reverse its trend.
Trend Cloud: Similar to the Reversal Cloud, this feature visualizes the prevailing market trend, making it easy for traders to understand the direction of the market at a glance.
Signal Optimizer: The Signal Optimizer is a powerful tool that optimizes the Buy/Sell and contrarian signals based on win-rate or performance. It automatically applies the best settings to the signals, freeing traders from the task of constantly adjusting them. This helps traders to get the most reliable signals automatically, enhancing their trading efficiency.
█ How to use the Buy/Sell Toolkit?
Here are a few illustrative examples to provide traders with a better understanding of the Toolkit's practical usage. These examples showcase the combination of features, but it's important to note that they serve as demonstrations, and we encourage traders to explore and adapt the features to align with their unique trading styles.
Buy/Sell Signals & Take Profit
Optimized Buy/Sell signals & Candle Color + Trend Advisor + Reversal Cloud
Contrarian Signals & Take Profit
,with Reversal Cloud
Optimized Contrarian Signals & Ultimate Trend & Reversal Cloud
Trend Cloud
Filter signals with Trend Cloud
█ Why is this Buy/Sell Toolkit Needed?
The Buy/Sell Toolkit is an exceptional tool for traders because it consolidates several critical trading indicators into a single, user-friendly platform. The Toolkit's holistic approach to market analysis can enhance decision-making, reduce guesswork, and improve overall trading performance. Additionally, it allows traders to customize their approach according to the market conditions and their trading style.
The Toolkit's automated features, such as the Signal Optimizer, save time and effort, making it easier for both new and experienced traders. In addition, its comprehensive suite of features ensures traders have all the information they need to make informed trading decisions. All these features make the Buy/Sell Toolkit a powerful ally in any trader's arsenal.
Here's why this Toolkit is essential:
Comprehensive Market Analysis: The Toolkit offers a wide range of indicators and tools for comprehensive market analysis, from trend detection to momentum analysis. This reduces the need for multiple tools and allows for a more efficient trading process. By providing a host of indicators like Buy/Sell signals, Contrarian Signals, Trend Analysis, and Momentum Average, the Toolkit helps traders make well-informed decisions based on comprehensive data and trend analysis.
Automation and Time-Saving: The Signal Optimizer automatically applies the best settings to the signals based on win rate or performance. This saves time and ensures the signals' reliability, reducing, it makes the trading process efficient and hassle-free.
Versatility: The Toolkit is versatile and can be used for various financial markets, including stocks, forex, commodities, or cryptocurrencies. Regardless of the market you trade in, the Buy/Sell Toolkit has something to offer.
Visual Tools: The Toolkit provides visual tools like Reversal Cloud, Trend Cloud, Trend lines, Candle coloring, and much more, which are excellent for visualizing market trends and potential reversal zones. This can make the process of understanding market movements more intuitive and less intimidating, especially for novice traders.
Confirmation: By using multiple indicators in conjunction with each other, traders can confirm signals and improve the accuracy of their trades.
Learning and Development: The Toolkit serves as an excellent resource for both novice and experienced traders to learn about different trading indicators, how they interact, and how to use them effectively.
█ Any Alert Function Call
This function allows traders to combine any feature and create customized alerts. These alerts can be set for various conditions and customized according to the trader's strategy or preferences.
█ How are the features calculated? - Overview
The Toolkit combines many of our existing premium indicators and new technical analysis algorithms to analyze the market. This overview covers how the main features are calculated.
Buy/Sell
The core function calculates the Exponential Weighting for a given time series X over a period T. The time series is based on absolute price changes. It focuses on the magnitude of price changes from one period to the next, irrespective of the direction (up or down). This type of time series can be used to measure the volatility of a price series, as it quantifies the size of price movements. It's useful in scenarios where the direction of the change is not as important as the magnitude of the change.
Contrarian Signals
Our contrarian signals are based on deviation from the expected range value. The algorithm quantifies the amount of variation or dispersion in a set of trading ranges. Non-expected values are the fundamental core of the signal generation process.
Ultimate Trend
The Ultimate trend calculates an adaptive smoothing momentum function by first determining the directional price movement and then applying smoothing to the positive and negative price changes. It then uses these values to calculate a form of Variable Moving Average (VMA), where the smoothing factor is adjusted based on a normalized measure of the relative difference between the Positive and Negative Directional values.
Trend Advisor
It's a form of Moving Averages that are applied to the price chart using three different weighting functions, simple weighting, price volatility smoothing constant weighting, and the traditional EMA weighting function.
Trend Reversal and Cloud
The function uses the information on how much the current price compared to the relative historical price fluctuates over a specific period and automatically updates its equilibrium value at new price changes.
Momentum Average
Essentially, it uses a modified version of the relative rate of change over a certain period.
Take Profit
The take profit uses similar range price functions as the contrarian signals, where a take profit signal is triggered at extremely abnormal values.
Candles
Note, Using and Backtesting on non-standard charts produces unrealistic results since it does not represent the closing price. The candles are based on a smoothing process that finds the best smoothing coefficient for the current data, using close as time series.
█ In conclusion , The Buy/Sell Toolkit serves as a comprehensive, user-friendly, and efficient trading assistant. It brings automation and intelligent data play-by-play to your fingertips, making it an essential tool for anyone serious about trading.
-----------------
Disclaimer
The information contained in my Scripts/Indicators/Ideas/Algos/Systems does not constitute financial advice or a solicitation to buy or sell any securities of any type. I will not accept liability for any loss or damage, including without limitation any loss of profit, which may arise directly or indirectly from the use of or reliance on such information.
All investments involve risk, and the past performance of a security, industry, sector, market, financial product, trading strategy, backtest, or individual's trading does not guarantee future results or returns. Investors are fully responsible for any investment decisions they make. Such decisions should be based solely on an evaluation of their financial circumstances, investment objectives, risk tolerance, and liquidity needs.
My Scripts/Indicators/Ideas/Algos/Systems are only for educational purposes!
Płatny skrypt

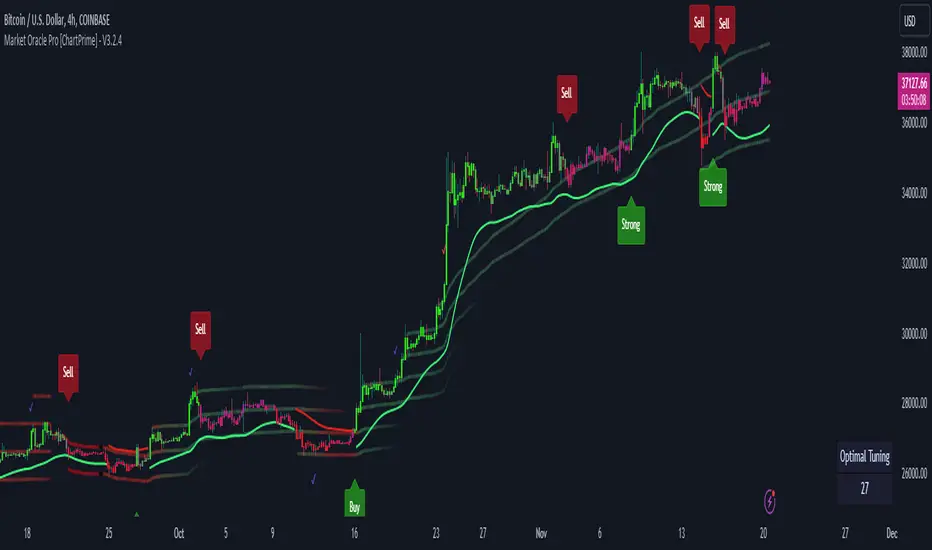
Market Oracle Pro [ChartPrime]ChartPrime Oracle Pro combines actionable, elegant and functional indicators into a single toolkit. Combinations of both trend following and contrarian logic aim to provide traders with a deeper insight into market movements; aiming to assist in better entries and exits.
Designed and created by the ChartPrime team, peacefullizard (digital signal processing expert), Gecko, and ExoMaven, this toolkit takes deeper level theory and expresses it in a useable format for traders. ChartPrime Oracle Pro is designed to satisfy and cover major trading theories allowing the user to pick and select the features that fit them.
When using any indicator suite it is important to understand these tools are there to assist trading rather than to be a single source of truth. Functionality such as Auto Maximization of parameters is there to guide and enhance user experience, however it is important to be aware of overfitting results.
Features included & Use cases:
Signal Mode: Select the type of assistive signals you are requiring. Provided are both trend following signals with self optimization using backtest results as well as reversal signals, aiming to provide real time tops and bottoms in markets. Both these signal modes can be fine tuned using the tuning input to refine signals to a trader's liking. The ChartPrime Auto Maximizer will automatically apply a backtested parameter and display the "best performing signals" on your chart. It is important to note this is not indicative of future results. ChartPrime Trend Signals leverage audio engineering inspired techniques and low-pass filters in order to achieve and attempt to produce lower lag response times and therefore is designed to have a uniqueness when compared to more classical trend following approaches.
Candle Highlighting: Choose between a clean gradient or more classical red/green coloring. These color the candles to assist with trend identification.
ChartPrime Dashboard: This cleanly designed dashboard provides 3 simple to interpret metrics. Firstly, the Optimal Tuning box provides a backtested result giving you the most accurate input. Again, it is important to note this is not indicative of future results. A Prime Score is also provided. This metric is a collection of ChartPrime trend following indicators bundled into a single item. It ranges from 0 (being very bearish trend) to 10 (being a very bullish trend). 5 would indicate a ranging market. A consolidation score is also provided showing how "ranging" the market is. 10 being a low volatility and consolidating market and 0 being a more volatile and trending market which can assist the trader in avoiding ranges (if undesired).
Additional Features:
The Dynamic Reactor provides a simple band passing through the chart. This can provide assistance in support and resistance locations as well as identifying the trend direction expressed via green and red colors. Taking a moving average and applying unique adaptivity calculations gives this plot a unique and fast behaviour.
The Prime Ranges provide VWAP inspired real time actionable ranges on your chart. These ranges provide support and resistance levels as well as coloring, once again, there to aid trend identifcation. By generating a distribution and projecting it we produce real time levels for traders.
Candlestick structures analyze candlestick formation putting a spin on classical candlestick patterns and provide the most relevant formations on the chart. These are not classical and are filtered by further analyzing market activity. A trader's classic with a spin.
The Momentum Wave Bands provide classical areas of high deviation where the price may reverse. It also provides additional insight on trend direction and volatility.
The Prime Trend Assistant provides a trend following dynamic support and resistance level. This makes it perfect to use in confluence or as a filter for other supporting indicators. This is an adaptive trend following system designed to handle volatility leveraging filter kernels as apposed to low pass filters.
Settings:
Signal Mode: Drop down to select the types of signals wanted
Tuning: Integer input to adjust signal's responsiveness. Lower inputs result in more frequent signals being produced.
Auto Maximizer Toggle: Automatically apply a backtested parameter to the signals
Dashboard Size: Drop down to select the size of the dashboard
Dashboard Position: Change the location of the dashboard on your chart
Additional Features: A set of toggles turning on/off these indicators.
Example Usecases:
Trend based confluences:
ChartPrime Oracle Pro provides classical (all be-it self optimizing) trend based signals. When trading, taking into consideration other forms of confluences are crucial. Take the image below: Here we see a *uptrend* where smaller retracements in price action are resulting in sell signals. When identifying a trend, analyzing the macro and micro price action can help the trader deduce how relevant a move in the market may be. We can use the Prime Trend Assistant to help filter out said retracements. We are also able to use the Prime Ranges in a similar way.
Features such as the Prime Ranges have duplicate usecases whereby a trend can be idenfied via the color of the bands as well as providing TP/SL levels. Considering these assisting features is vital before entering a trade.
Contrarian trading methodologies:
Commonly; trading with a trending market is most well known. However; markets are just as susceptible to ranging behaviors. ChartPrime has designed this toolkit to cater to most market conditions. For example, finding confluence between reversal indicators such as our contrarian signals and the momentum wave band can provide for some very strong confluence that can help a trader attempt to enter at bottoms of retracements and achieve the best possible entries or exits.
Developing confluences as shown above can be key to a trader's success. It is import ant to avoid biases when looking at indicators and view the market as objectively as possible.
ChartPrime believe that there is no magic indicator that is able to print money. Indicator toolkits provide value via their convinience, adaptibility and uniqueness. Combining these items can help a trader make more educated; less messy, more planned trades and in turn hopefully help them succeed.
Risk Disclaimer
All content and developments created by ChartPrime are purely for informational & educational purposes only. Past performance does not guarantee future results.
Płatny skrypt
Z Algo (Expo)█ Overview
Z Algo (Expo) is a sophisticated and user-friendly trading tool designed to meet the needs of both novice and seasoned traders. With its real-time signals, trend analysis, and risk management capabilities, this tool can be a valuable addition to any trader's toolkit.
█ Main Features & How to Use
Buy/Sell signals: Z Algo provides real-time buy and sell signals, which assist traders in identifying the most opportune moments to enter or exit a trade.
Strong Buy/Sell signals: In addition to regular buy and sell signals, the tool also offers strong buy and sell signals. These are generated when the market conditions align with a higher probability of a significant price movement.
Sniper Signals: This feature is specifically designed for contrarian traders who look to exploit temporary market inefficiencies or take advantage of price reversals. When enabled, Sniper Signals identify potential market turning points, offering traders the opportunity to profit from sharp price fluctuations.
Reversal Cloud: The Reversal Cloud is a unique visual representation of the market's potential trend reversals. It offers traders an easy-to-understand display of changing market dynamics, enabling them to quickly identify potential entry and exit points based on trend reversals.
Support and Resistance (S/R) Levels: Z Algo automatically calculates and displays support and resistance levels on the chart. These are crucial price points where buying or selling pressure may change, providing valuable insights for traders looking to enter or exit positions based on these levels.
Trend Tracker: This feature helps traders monitor and analyze the prevailing market trend. Trend Tracker identifies and highlights the direction of the trend, allowing traders to align their strategies accordingly and increase their chances of success.
Trend Background Color: To improve the user experience and simplify the interpretation of market data, Z Algo changes the chart's background color based on the identified trend direction. This visual cue makes it easier for traders to recognize bullish or bearish trends at a glance.
Bar Coloring: In addition to the trend background color, Z Algo also provides bar coloring for both contrarian and trend bars. This feature helps traders visualize price movements and trends more effectively, enabling them to identify potential opportunities for both trend-following and contrarian trading strategies.
Risk Management: The tool incorporates risk management features that help traders to protect their capital and maximize potential returns. Users can set stop-loss and take-profit levels, as well as customize their risk exposure according to their individual preferences and trading style.
█ Calculations
█ What are the Buy/Sell signals based on?
The Buy/Sell signals use volatility and price range with a weighting function that can help reduce lag and respond faster to recent price changes. The function gives more weight to the most recent volatility values and absolute price changes, making the algorithm more responsive to changes in volatility and price moves. Using a model that factors in both price changes and volatility gives a bias toward more recent data. This advanced approach to trading signal generation incorporates the concepts of trend following and mean reversion while accounting for changing market volatility.
Traditional systems often use fixed parameters, which may not adapt quickly to changes in market conditions. This can lead to late entries or exits, potentially reducing profitability or increasing risk. Our algorithm uses a weighting function to give more importance to recent volatility values, and absolute price changes can make these signals more responsive. This is especially useful in dynamic markets where price swings and volatility can change rapidly.
Adapting to Recent Price Changes: Markets can often exhibit trending behavior over certain periods. By weighing recent price changes more heavily, the model can quickly identify and react to the emergence of new trends. This can lead to earlier entries in a new trend, potentially increasing profitability.
Adapting to Recent Volatility Changes: Markets can shift from low to high volatility regimes (and vice versa) quite rapidly. A model that gives more weight to recent volatility can adapt its signals to these changing conditions. For example, in high volatility conditions, the model might generate fewer signals to reduce the risk of false breakouts. Conversely, in low volatility conditions, the model might generate more signals to capitalize on trending behavior.
Adaptive Trading: The approach inherently leads to an adaptive trading system. Rather than using fixed parameters, the system can adjust its behavior based on recent market activity. This can lead to a more robust system that performs well across different market conditions.
█ What are the Sniper signals (contrarian signals) based on?
Our contrarian signals are based on deviation from the expected value. The algorithm quantifies the amount of variation or dispersion in a set of values. Non-expected values are the fundamental core of the signal generation process.
█ Reversal Cloud Calculation
The cloud uses the information of how much the price fluctuates over a specific time period and updates its equilibrium value automatically at new price changes. The price changes are used to predict what will happen next, and the band adapts accordingly. The algorithm assumes that past price changes can predict future market behavior.
█ Support and Resistance (S/R) Levels Calculation
The support and resistance levels use historical overbought and oversold levels combined with a weighted atr function to predict future support and resistance areas. This calculation can potentially give traders a great heads-up on where the price may find support and resistance at.
█ Trend & Bar coloring Calculation
Trend calculations with dynamic events are key in ever-changing markets. The main idea of the calculation method is to find the mathematical function that best fits the data points, by minimizing the sum of the squares of the vertical distances of each data point from the equilibrium. The outcome is a function that finds the best mathematical description of that data. Hence the trend output may vary depending on the asset and timeframe. A unique approach where the same settings can give different results.
█ Risk Management Calculation
The risk management system is not unique in itself and contains everything that can help traders to manage their risk, such as different types of stop losses, Take Profits calculations.
-----------------
Disclaimer
The information contained in my Scripts/Indicators/Ideas/Algos/Systems does not constitute financial advice or a solicitation to buy or sell any securities of any type. I will not accept liability for any loss or damage, including without limitation any loss of profit, which may arise directly or indirectly from the use of or reliance on such information.
All investments involve risk, and the past performance of a security, industry, sector, market, financial product, trading strategy, backtest, or individual's trading does not guarantee future results or returns. Investors are fully responsible for any investment decisions they make. Such decisions should be based solely on an evaluation of their financial circumstances, investment objectives, risk tolerance, and liquidity needs.
My Scripts/Indicators/Ideas/Algos/Systems are only for educational purposes!
Płatny skrypt

Esqvair's Neural Reversal Probability IndicatorIntroduction
Esqvair's Neural Reversal Probability Indicator is the indicator that shows probability of reversal.
Warning: This script should only be used on 1 minute chart.
How to use
When a signal appears (by default it is a green bar), a reversal should be expected.
The signal appears when the indicator value >= Threshold.
If you want more signals, you must lower the threshold, if less, you must increase the threshold.
For some assets, like Forex pairs, you have to optimize the threshold yourself, but for most stocks, the default threshold works well.
How well a threshold fits an asset depends on the volatility of the asset.
For most assets, the indicator ranges from 35 to 75.
Settings
Smoothing - The default is 1, which means no smoothing. Indicator smoothing by SMA.
Threshold - default 71.0 is responsible for the occurrence of signals, read "How to use" part to learn more
The Indicator
This indicator is a pre-trained neural network that was trained outside of TradingView and then its structure and weights values were converted to PineScript.
Warning: A neural network is a black box in the sense that although it can approximate any function, studying its structure will not give you any idea about the structure of the function being approximated.
Possible questions
Why does the indicator value most time range from 35 to 75 when the probability should ranges from 0 to 100?
-Due to some randomness in the markets, a neural network can never be 100% sure.
What data was used to train the neural network?
-This was BTCUSD 1 minute chart data from 02/05/2020 to 02/05/2022.
Where did you train the neural network and convert it to PineScript?
-I used a programming language that I know.

QFLOW SUITE QFLOW SUITE is a signal-based comprehensive trading suite for trading across all timeframes. It is designed to be a tool for discretionary traders and there are numerous ways to utilize this trading suite.
INCLUDES :
Buy / Sell Signals
Candle Coloring
Automatic Level Plotting
Trend Following System
Stop Loss Management System
Trend Reversal Mechanisms
Volatility Breakout Algorithm
Mean Reversion Algorithm
Buy / Sell Signals
There are multiple conditions detected by QFLOW Algorithm which are constantly worked on and improved
Candle Coloring
Color coding allows information compression and helps traders analyze the charts in a simple and intuitive manner. The base coloring is meant for trend following and consists of 3 colors :
Green - Trend up
Grey - Rangebound Consolidation
Red - Trend down
The second type of candle coloring is for the special conditions like buy / sell signals or divergences.
Volatility Breakout Algorithm
This part of the algorithm identifies a volatility breakout before it happens by showing a colored shaded squeeze which happens during consolidation. When a potential breakout is detected, an arrow is printed below or above that candle depending on the direction. Most times a second arrow is needed to signal a confirmed breakout. This arrow will be plotted with a 'B' or 'S' in the same color as the arrow.
False Breakout Detection
The algorithm is taught to detect these kind of false breakouts and prints a signal as an arrow with an 'F' below or above the candle.
Mean Reversion Algorithm
A hybrid algorithm that takes both momentum and mean reversion into account for high accuracy.
Automatic Level Plotting
Stop Loss Management System
QFLOW SUITE contains an adaptive trailing ATR system that can be used for stop loss management. It is plotted as a line below the price when the trend is up and above the price when the trend is down. It is highly effective because it is designed to adapt both to the true range ( a measure of the degree of price volatility ) as well as to the average direction change.
Extreme Background Highlighting
The algorithm is taught to analyze multiple technical components. When this option is turned on it will highlight the background when these extreme conditions are met. These highlights will often occur at the tops or bottoms and during times of high volatility. A trader can use this option as extra confluence when making certain trading decisions like taking profits or closing out trades.
