RSI Screener Multi Timeframe [5ema]This indicator is the simple version of my indicator: RSI Screener and Divergence .
Only show table with values, signals at 5 custom timeframes.
-----
I reused some functions, made by (i believe that):
©paaax: The table position function.
@kingthies: The RSI divergence function.
@QuantNomad: The function calculated value and array screener for 40+ instruments.
I have commented in my code. Thanks so much!
-----
How it works:
1. Input :
Length of RSI => calculate RSI.
Upper/lower => checking RSI overbought/oversold.
Right bars / left bars => returns price of the pivot low & high point => checking divergence.
Range upper / lower bars => compare the low & high point => checking divergence.
Timeframe => request.security another time frame.
Table position => display screener table.
2. Input bool:
Regular Bearish divergence.
Hidden Bullish divergence .
Hidden Bearish divergence.
3. Basic calculated:
Make function for RSI , pivot low & high point of RSI and price.
Request.security that function for earch time frame.
Result RSI, Divergence.
4. Condition of signal:
Buy condition:
RSI oversold (1)
Bullish divergence (2).
=> Buy if (1) and (2), review buy (1) or (2).
Sell condition:
RSI overbought (3).
Bearish divergence (4).
=> Sell if (3) and (4), review sell (3) or (4).
-----
Table screener:
Time frame.
RSI (green - oversold, red - overbought)
Divergence (>> - regular bullish , << regular bearish , > - hidden bullish , < - hidden bearish ).
Signal (green ⦿ - Buy, red ⦿ - Sell, green 〇 - review buy, red 〇 - review sell).
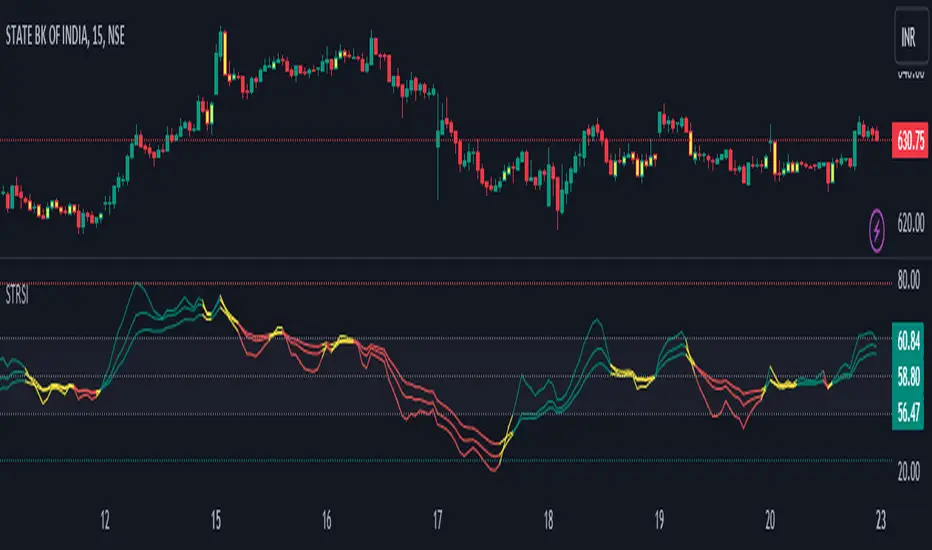
- Regular Bearish divergence:
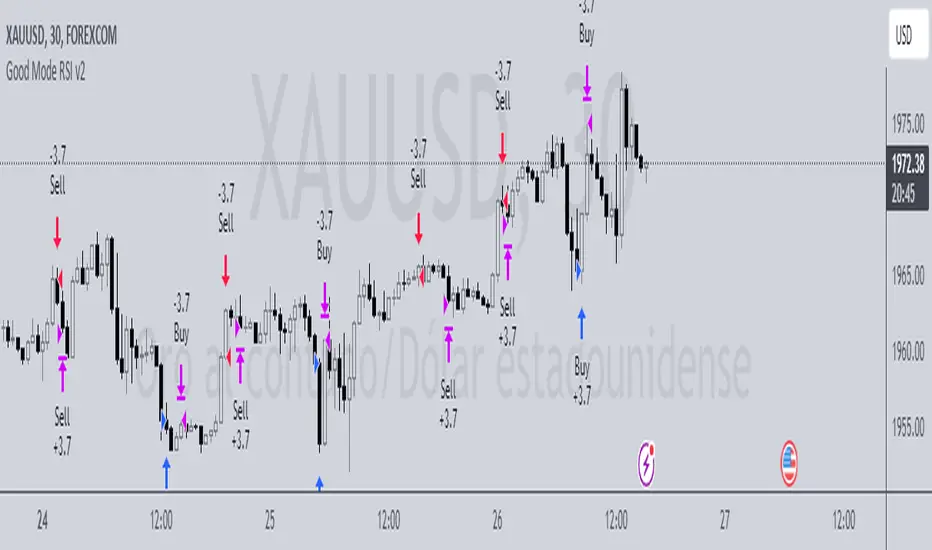
- Regular Bullish divergence:
- Regular Bullish divergence + RSI overSold
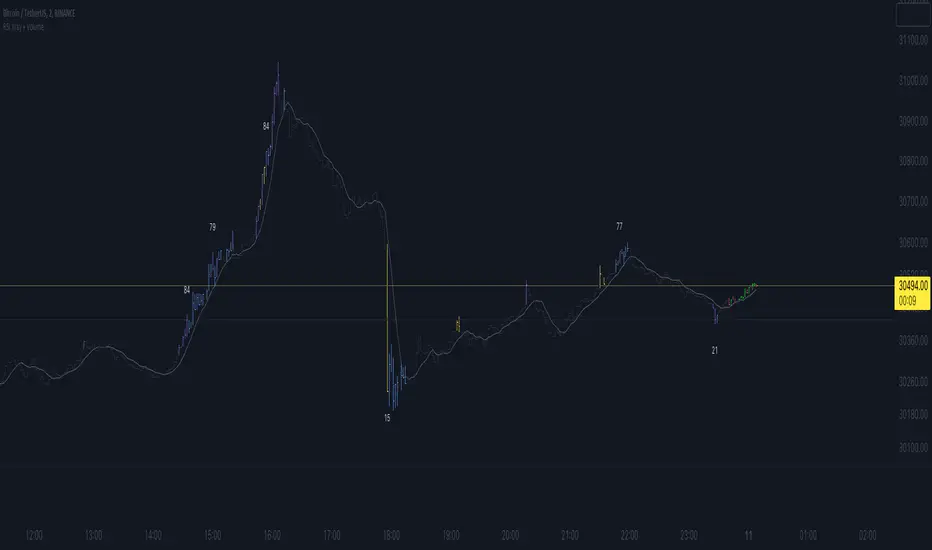
- Regular Bearish divergence + RSI overBought
-----
This indicator is for reference only, you need your own method and strategy.
If you have any questions, please let me know in the comments.
Wskaźnik Pine Script®