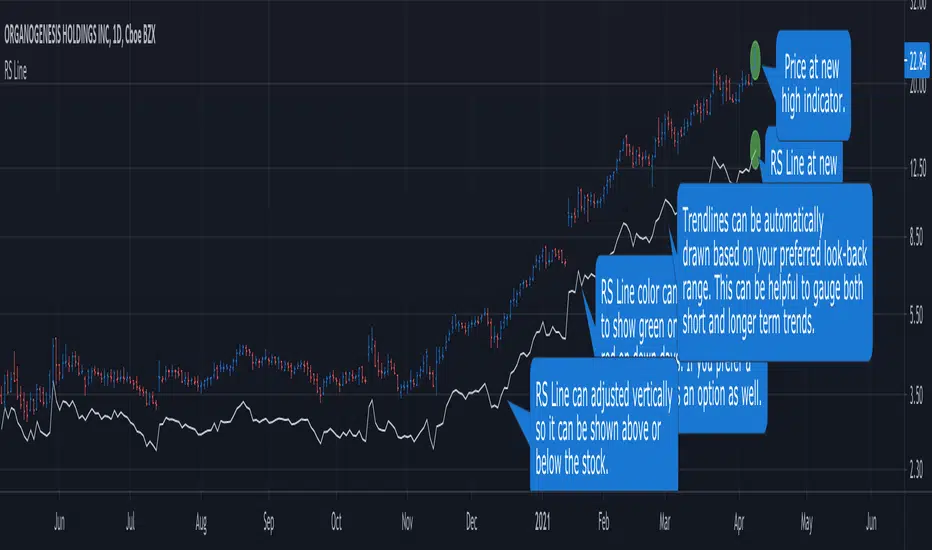
RS Line - Relative Strength Line [LevelUp]Overview:
This implementation of the RS Line mimics how Investor's Business Daily and CANSLIM investors measure growth stock performance versus the S&P 500.
If you are looking at a weekly chart, the RS Line is the performance of the stock over the past week versus the S&P 500 over that same time frame. The same logic applies to the daily and monthly charts, only the time frames are different.
If a stock moves up for the day/week/month and the S&P 500 does not, the RS Line will move up. If a stock ends the day/week/month flat, yet the S&P 500 moves up, the RS Line will go down.
Usage:
- Look for an upward sloping line.
- The steeper the line, the better.
- Can be used for viewing long-term trend.
Relativestrength
Non-Rescaled RSI█ OVERVIEW
Relative Strength Index is a momentum oscillator developed by J. Wilder. The original version of RSI rescaled the relative strength measurement to range. While the rescaling is useful for readability, This non-rescaled version tells the exact average relative strength of the movement for the past period, and give another way to put the relative strength reading into context of current market condition.
█ Description & How To Use
1. The (+/-) in relative strength value indicates the direction
Example 1: Relative Strength of 2.33 means average gain is 2.33 bigger than average loss for the past period (Equivalent to RSI 70)
Example 2: Relative Strength of -2.33 means average loss is 2.33 bigger than average gain for the past period (Equivalent to RSI 30)
Example 3: Relative Strength of 0 means average gain is equal to average loss for the past period (Equivalent to RSI 50)
Look at comparison below:
2. You can use it exactly how you would use RSI: Overbought/Oversold state, Divergence, Trend identification, Failure Swings etc..
█ Features
- Overbought/Oversold line still maintainable as standard RSI level (70,30) in user input screen. The script will recalculate and plot the ob/os level accordingly
- Value Label to indicate the RSI and RS value
- Custom Gradient Color Scheme
█ Limitation
The Relative Strength absolute value is capped at 20 to avoid ratio value too big(or too small). This is enough to get accurate equivalent of RSI reading between 5-95
█ Disclaimer
Past performance is not an indicator of future results.
My opinions and research are my own and do not constitute financial advice in any way whatsoever.
Nothing published by me constitutes an investment/trading recommendation, nor should any data or Content published by me be relied upon for any investment/trading activities.
I strongly recommends that you perform your own independent research and/or speak with a qualified investment professional before making any financial decisions.

RSI HistogramThis an experiment to visualise the famous RSI indicator within a Histogram.
Opposed to regular RSI this RSI is plotted into a Histogram and uses different scales (100 to -100), in addition it has the ability to smooth the RSI with various moving averages like HMA, JMA and KAMA.
About RSI:
The RSI measures recent performance of a given stock against its own price history performance, by combining the average gain or loss a particular security owns over a predetermined time period.
Bars can be colored in Settings (Disabled by default)
Enjoy and like if you like :)

Percentage Relative StrengthA relative strength indicator that compares your main symbol (one on your chart) strength to another symbol by percentage.
The result is plotted as a histogram showing which symbol is rising or falling more in percentage.
In case your chart symbol is TSLA (Tesla) and the indicator 'Symbol to compare' is SPX:
GREEN area (above zero) means TSLA is rising more than the SPX.
RED area (below zero) means TSLA is falling more than the SPX.
To these who wants to understand calculation, it's pretty straightforward.
For each asset we calculate everyday percentage change based on previous close and current close.
We take main asset (chart symbol) percentage and subtract it from percent of change of the symbol we want to compare to.
Result are smoothed by SMA (Simple Moving Average)
You can select different indexes or cfds such as S&P500 (SPX), NASDAQ 100 (NSX), RUSSELL 2000 (RUT) and NASDAQ (IXIC).
Default is S&P 500 (SPX).
Enjoy and Like if you like.

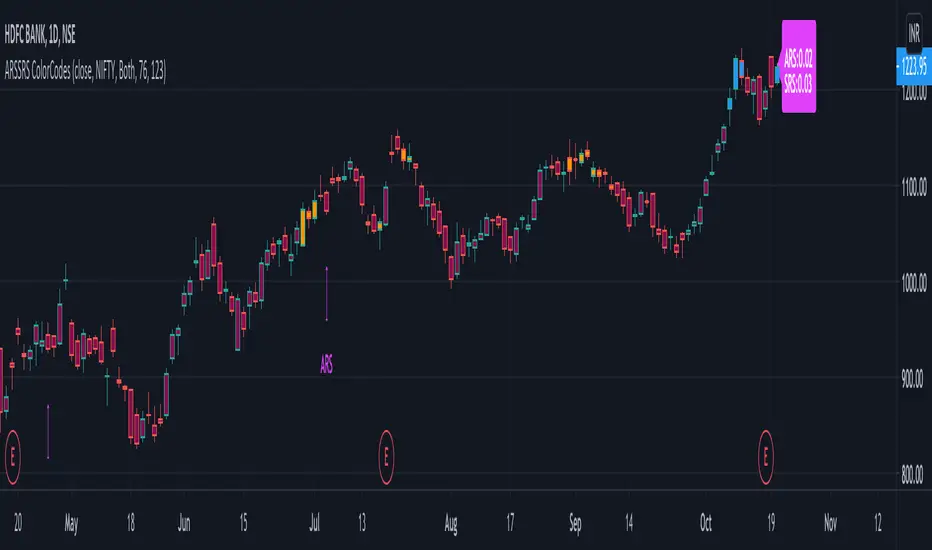
Adaptive and Static Relative Strength OverlayThis indictor combines adaptive and static relative strengths and displays the strength in a unique colour coding on the bars.
With this the one can view the performance of both the relative strengths in one indicator and overlay-ed on the price chart.
Adaptive Relative Strength - Date is identified based on market scenarios. It will change based on how the market trends in the future.
Static Relative Strength - Date is fixed (123 sessions). Roughly corresponds to 6 months.
The (default) colour coding is:
If "Both" is selected:
ars > 0 and srs > 0 = Blue
ars <=0 and srs <= 0 = Maroon
Orange otherwise (Any of ars or srs is negative)
If "Only ARS" is selected:
ars > 0 = Blue
Maroon otherwise
If "Only SRS" is selected:
srs > 0 = Blue
Maroon otherwise
Additionally the ARS and the SRS will be marked as labels on the bars corresponding to the reference dates.
The current ARS and SRS values will be market as label on the last bar.
Source can be any valid source, close is selected by default.
Default benchmark is "Nifty 50" the NSE Indian benchmark. This can be changed.
Relative Strength OverlayThis is the original script to my other Relative Strength indicator (link below) It provides a graphical overlay of the Relative Strength, compared to the QLD, a Nasdaq x2 ETF.
You can not use the value to compare to other stocks or securities, as it is scaled based on the price (so it can be used as an overlay).
If you want a value which you can use to compare with other stocks, please see my other Relative Strength indicator.
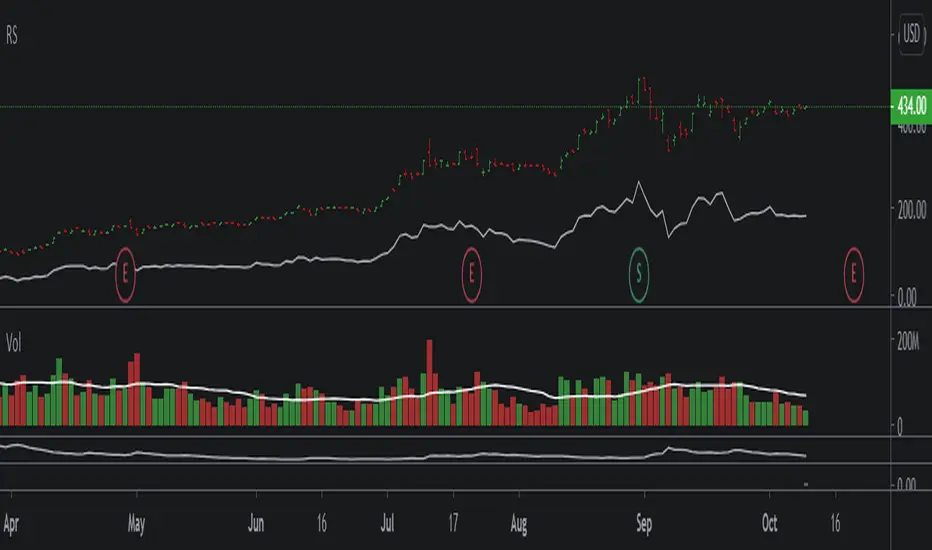
Relative StrengthA relative strength overlay, similar to that of IBD shown on Marketsmith.
The value is not from 0-100, it is compared with the Nasdaq x2 ETF, QLD. Therefore, if greater than zero it will give you a good indication that the stock has a very good relative strength.
Feel free to change the comparison ETF to one of your choosing.

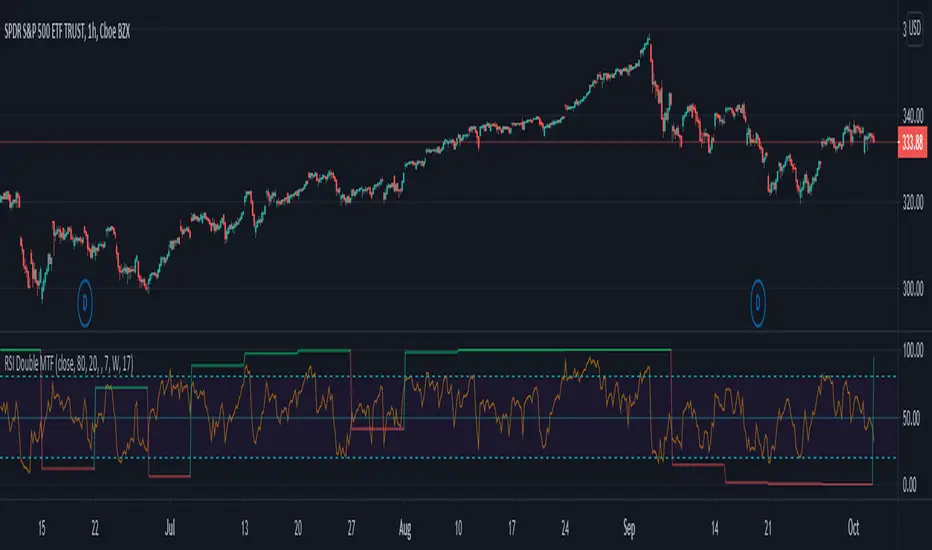
RSI Double MTFCool little gudget of Multi time frame RSI with additional RSI. Both can be set to a different time frames.
Higher time frame (Second RSI) indicates the main trend by different colors - 'red' (down trend) and 'green' (up trend), where the first RSI can act as a normal RSI.
Suggestions/Questions or a thanks below :)
Follow for more updates and new indicators follow: www.tradingview.com
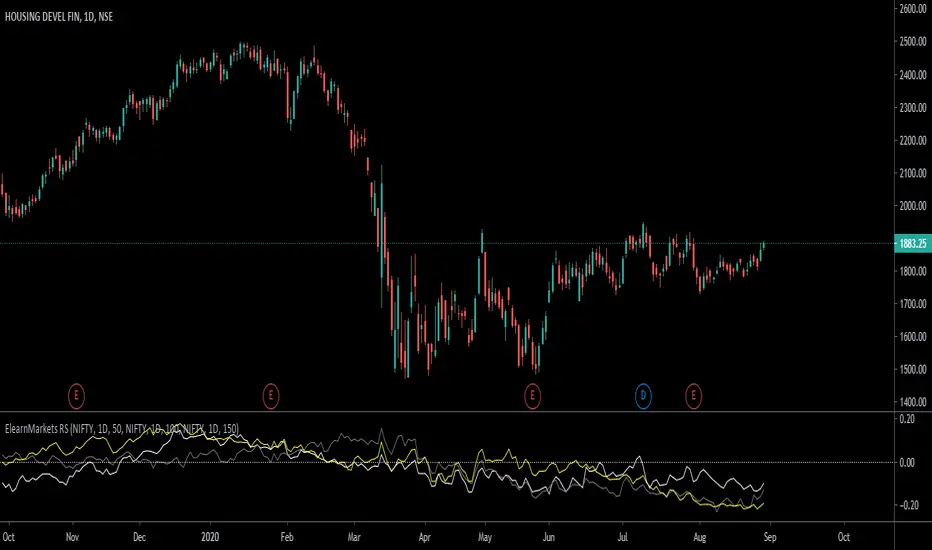
ElearnMarkets CRSHi Everyone,
How it works?
1. With this indicator you can compare any other symbol of index/security with selected symbol.
2. You can compare with three different Indices/symbols.
3. Also you can keep different timeframe to compare with the current symbol.
4. No need to add multiple indicators for same purpose.
Feel free to suggest any changes to the indicator.
I hope this indicatory could help you achieve what you expect.
Thanks,
Yogesh

ElearnMarkets RSHow it works?
1. With this indicator you can compare any other symbol of index/security with selected symbol.
2. You can compare with three different Indices/symbols.
3. Also you can keep different timeframe and length of period to compare with the current symbol.
4. No need to add multiple indicators for same purpose.
Thanks,
Yogesh
Adaptive Relative StrengthAdaptive Relative Strength shows a line of relative strength with a moving period in relative to Nifty 500 for Indian Market,
by default its 45 days but you can change as per your need or change relative symbol as per your need.

Relative CandleThis script visualizes the relative movement of a single OHLC candle compared to an index (or another symbol). The vertical location of the candle indicates the general positive/negative comparison of the bar vs the index. The color of the candle indicates how the candle moved relative to the index. The wick indicates the closing range compared to the index (did the symbol close at lows of the bar while the index closed at highs).
The area graph in the background shows the average relative close over a 10-day simple moving average.
I use this to pop any behavior that is out of line with the market, whether positive or negative. For example, is a red bar day due to the market pullback or something specific to the stock. Or did the market pull back and the stock did the opposite, strong day!

Relative Strength Auto ComparisonRelative Strength Comparison with automatic selection of relevant index
Added support for most european and north american exchanges.
Momenta Relative Strength IndexThe Momenta RSI Indicator was created by William Blau (Stocks & Commodities V. 9:5 (202-205)) and is a variation of the classic RSI using his Momenta Indicator formula. I have color coded everything to make it very easy to determine buy and sell signals.
Let me know if you would like to see me write scripts for other indicators!

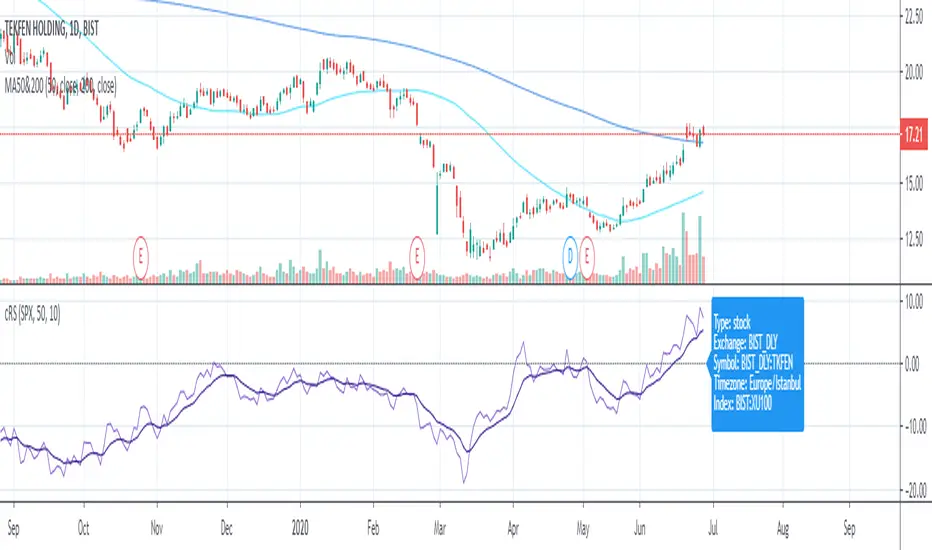
Relative Strength(RSMK) + Perks - Markos KatsanosIf you are desperately looking for a novel RSI, this isn't that. This is another lesser known novel species of indicator. Hot off the press, in multiple stunning color schemes, I present my version of "Relative Strength (RSMK)" employing PSv4.0, originally formulated by Markos Katsanos for TASC - March 2020 Traders Tips. This indicator is used to compare performance of an asset to a market index of your choosing. I included the S&P 500 index along side the Dow Jones and the NASDAQ indices selectively by an input() in "Settings". You may comparatively analyze other global market indices by adapting the code, if you are skilled enough in Pine to do so.
With this contribution to the Tradingview community, also included is MY twin algorithmic formulation of "Comparative Relative Strength" as a supplementary companion indicator. They are eerily similar, so I decided to include it. You may easily disable my algorithm within the indicator "Settings". I do hope you may find both of them useful. Configurations are displayed above in multiple scenarios that should be suitable for most traders.
As always, I have included advanced Pine programming techniques that conform to proper "Pine Etiquette". For those of you who are newcomers to Pine Script, this script may also help you understand advanced programming techniques in Pine and how they may be utilized in a most effective manner. Utilizing the "Power of Pine", I included the maximum amount of features I could surmise in an ultra small yet powerful package, being less than a 60 line implementation at initial release.
Unfortunately, there are so many Pine mastery techniques included, I don't have time to write about all of them. I will have to let you discover them for yourself, excluding the following Pine "Tricks and Tips" described next. Of notable mention with this release, I have "overwritten" the Pine built-in function ema(). You may overwrite other built-in functions too. If you weren't aware of this Pine capability, you now know! Just heed caution when doing so to ensure your replacement algorithms are 100% sound. My ema() will also accept a floating point number for the period having ultimate adjustability. Yep, you heard all of that properly. Pine is becoming more impressive than `impressive` was originally thought of...
Features List Includes:
Dark Background - Easily disabled in indicator Settings->Style for "Light" charts or with Pine commenting
AND much, much more... You have the source!
The comments section below is solely just for commenting and other remarks, ideas, compliments, etc... regarding only this indicator, not others. When available time provides itself, I will consider your inquiries, thoughts, and concepts presented below in the comments section, should you have any questions or comments regarding this indicator. When my indicators achieve more prevalent use by TV members, I may implement more ideas when they present themselves as worthy additions. As always, "Like" it if you simply just like it with a proper thumbs up, and also return to my scripts list occasionally for additional postings. Have a profitable future everyone!
(JS) Ultimate RSISo my goal here was to combine all of my RSI ideas into a single indicator in order to make kind of a "Swiss Army Knife" version of the Relative Strength Index ...
------------------------------------------------------------------------------------------------------------------------------------------------------------------------------------------------------------------------------------------------------------------
So, let's begin with the first RSI indicator I made, which is the RSIDVW (Divergence/Volume Weighted);
To rephrase my original post, the "divergence/volume weighted" portion is meant to expand upon the current RSI format by adding more variables into the equation.
The standard RSI is based off one value that you select (open, close, OHLC4, HLC3, etc.) while this version takes three variables into account.
The default setting is to have RSI normal without anything added to it (Divergence Weight = 0)
1st - it takes the standard variable that RSI normally uses.
2nd - it factors RSI divergence by taking the RSI change % and price change % to form a ratio. Using this ratio, I duplicated the RSI formula and created a divergence RS to be factored in with the standard price RS .
3rd - it takes Relative Volume and amplifies/weakens the move based upon volume confirmation. (So if Relative Volume for a price bar is 1.0, the RSI plot would be the same as it normally would)
So to explain the parameters
- Relative Volume Length: This uses the RV length you specify to determine spikes in volume (or lack of volume ), which then is added into the formula to influence the strength of the RSI move
- RV x Divergence: This is how I calculated the original formula, but you can leave this unchecked to turn Relative Volume off, or apply elsewhere.
- RV x RS: There's two sides, Divergence RS and Standard RS - these check marks allow you to select which part you prefer to be multiplied by Relative Volume .
Checking neither turns off Relative Volume , while checking both amplifies its effects by placing it on both sides of the equation.
-Divergence Weight: This controls how much the DVW portion of the formula influences the RSI plot. As I referred to earlier, default is 0 making RSI normal. The Scale is 0-2, so 1.0 would be the same as 50%.
When I do have DVW on, I generally set it to 0.5
-SMA Divergence: To smooth, or not to smooth, that is the question. UJsing an SMA here is much smoother in my opinon, but leaving it unchecked runs it through an RMA the same way standard RSI is calculated.
-Show Fractal Channel: This allows you to see the whole fractal channel around the RSI (This portion of the code, compliments of the original Ricardo Santos fractal script)
------------------------------------------------------------------------------------------------------------------------------------------------------------------------------------------------------------------------------------------------------------------
The next portion of the script is adding a "Slow RSI"...
This is rather simple really, it allows you to add a second RSI plot so that you can watch for crossovers between fast and slow lines.
-Slow RSI: This turns on the second RSI Plot.
-Slow RSI Length: This determines the length of the second RSI Plot.
------------------------------------------------------------------------------------------------------------------------------------------------------------------------------------------------------------------------------------------------------------------
Pivot Point RSI was something a friend of mine requested I make which turned out pretty cool, I thought... It is also available in this indicator.
-Pivot Points: Selecting this enables the rest of the pivot point related parts of the script
If Pivot Points isn't selected, none of the following things will work
-Plot Pivot: Plots the pivot point .
-Plot S1/R1: Plots S1/R1.
-Plot S2/R2: Plots S2/R2.
-Plot S3/R3: Plots S3/R3.
-Plot S4/R4: Plots S4/R4.
-Plot S5/R5: Plots S5/R5.
-Plot Halfway Points: Plots a line between each pivot .
-Show Pivot Labels: Shows the proper label for each pivot .
When using intraday charts, from a 15 minute interval or less the pivots are calculated based on a single days worth of price action, above that the distance expands.
Here are the current resolutions Pivot Points will work with:
Minutes - 1 , 2, 3, 5, 10, 13, 15, 20, 30, 39, 78, 130, 195
Hours - 1, 2, 3, 4, 5, 6
Daily
Weekly
Currently not available on seconds or monthly
------------------------------------------------------------------------------------------------------------------------------------------------------------------------------------------------------------------------------------------------------------------
Background Colors
Background Colors: I have six color schemes I created for this which can be toggled here (they can be edited).
Gray Background for Dark Mode: Having this on looks much better when using dark mode on your charts.
------------------------------------------------------------------------------------------------------------------------------------------------------------------------------------------------------------------------------------------------------------------
Now finally the last portion, Fibonacci Levels
-Fibonacci Levels: This is off, by default, which then uses the standard levels on RSI (30-50-70). When turned on, it removes these and marks fib levels from 0.146 through 0.886.
------------------------------------------------------------------------------------------------------------------------------------------------------------------------------------------------------------------------------------------------------------------
So the quick rundown:
Ultimate RSI contains "divergence/volume weighted" modifications, a slow RSI plot, pivot points , and Fibonacci levels all while auto-plotting divergence and having the trend illustrated in the background colors.
RSI has always been my "go to" indicator, so I hope you all enjoy this as much as I do!

Price Relative / Relative StrengthThe Price Relative indicator compares the performance of one security to another with a ratio chart. This indicator is also known as the Relative Strength indicator or Relative Strength Comparative. Often, the Price Relative indicator is used to compare the performance of a stock against a benchmark index, S&P 500, BIST:XU100 etc.
Chartists can also use the Price Relative to compare the performance of a stock to its sector or industry group. This makes it possible to determine if a stock is leading or lagging its peers. The Price Relative indicator can also be used to find stocks that are holding up better during a broad market decline or showing weakness during a broad market advance. (Source: stockcharts)
This also can be used for Trend Identification and Bullish/Bearish Divergences.
Good Luck

Combo Backtest 123 Reversal & Comparative Relative Strength This is combo strategies for get a cumulative signal.
First strategy
This System was created from the Book "How I Tripled My Money In The
Futures Market" by Ulf Jensen, Page 183. This is reverse type of strategies.
The strategy buys at market, if close price is higher than the previous close
during 2 days and the meaning of 9-days Stochastic Slow Oscillator is lower than 50.
The strategy sells at market, if close price is lower than the previous close price
during 2 days and the meaning of 9-days Stochastic Fast Oscillator is higher than 50.
Second strategy
Comparative Relative Strength Strategy for ES
WARNING:
- For purpose educate only
- This script to change bars colors.

Combo Strategy 123 Reversal & Comparative Relative Strength This is combo strategies for get a cumulative signal.
First strategy
This System was created from the Book "How I Tripled My Money In The
Futures Market" by Ulf Jensen, Page 183. This is reverse type of strategies.
The strategy buys at market, if close price is higher than the previous close
during 2 days and the meaning of 9-days Stochastic Slow Oscillator is lower than 50.
The strategy sells at market, if close price is lower than the previous close price
during 2 days and the meaning of 9-days Stochastic Fast Oscillator is higher than 50.
Second strategy
Comparative Relative Strength Strategy for ES
WARNING:
- For purpose educate only
- This script to change bars colors.


Relative Strength RankRelative Strength Rank Indicator
( ( Long Term Price Change + Short Term Price Change ) / 2 ) / 10 Day ATR

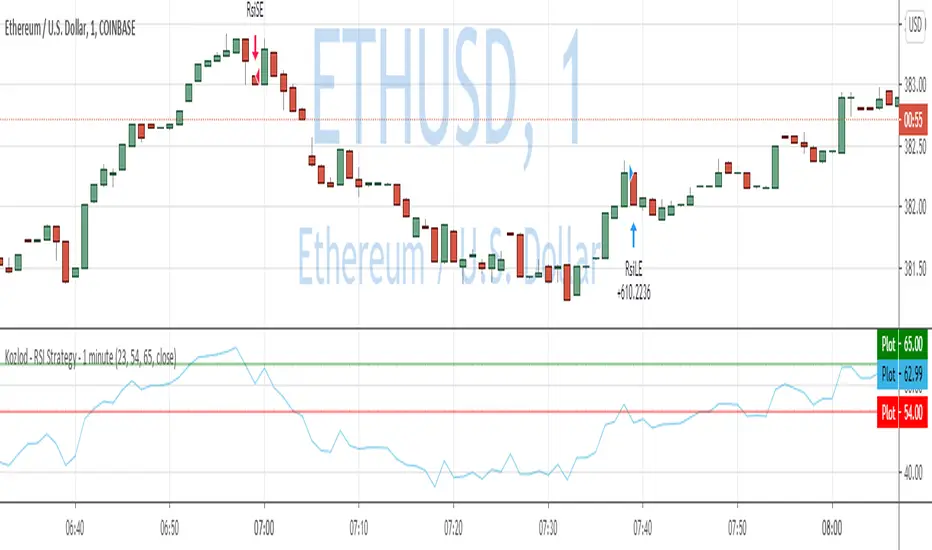
Kozlod - RSI Strategy - 1 minute - ETHUSDTrying to find simple strategies with optimal parameters which work well for certain symbols/timeframe.
Found that basic RSI strategy without any position management works pretty good for 1m chart for BTCUSDT.
It might not work very good on it's not but can give you a pretty good base for more complicated indicators.
Also, some position management as simple as static SL and PT can improve performance quite a lot.
And remember:
Past performance does not guarantee future results.
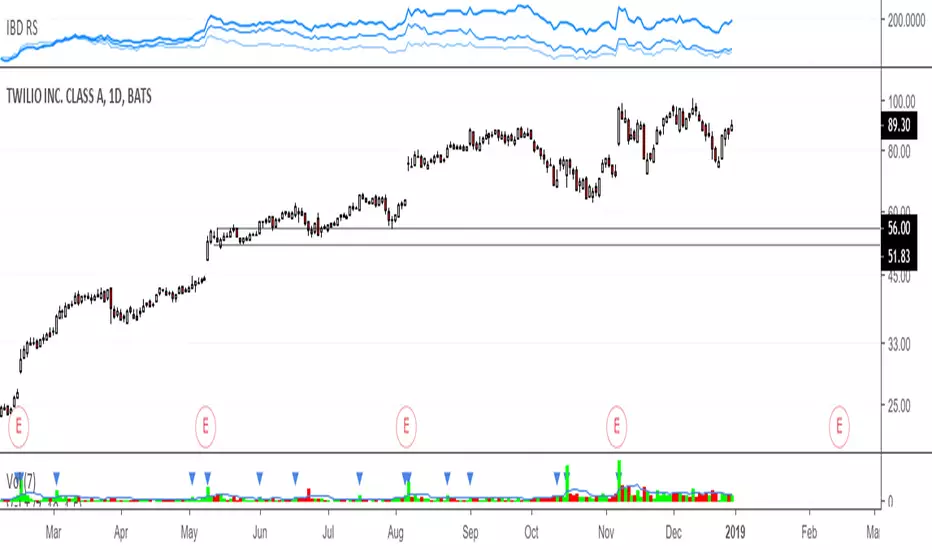
IBD RS, Relative strengthRelative Strength calculation of 3 time periods: 12 months, 6 months and 3 months.