Ultimate RegimeUltimate Regime | MisinkoMaster
Ultimate Regime is an advanced market environment classification tool designed to identify whether an asset is currently operating in a trending or mean-reverting regime. Instead of focusing on entry signals, the indicator concentrates on answering a more fundamental question: what type of market are we trading right now?
By continuously evaluating market structure, volatility behavior, and directional persistence, the script provides a unified regime view that helps traders adapt strategy selection, risk management, and trade expectations to current conditions.
This makes Ultimate Regime particularly valuable for traders using multiple systems, algorithmic frameworks, or discretionary approaches that perform differently depending on market state.
Core Concept
Markets alternate between expansion phases where directional movement dominates and contraction phases where price oscillates around equilibrium. Strategies built for one condition often underperform in the other.
Ultimate Regime solves this by aggregating several environment measurements into a single regime score that expresses whether the market currently favors:
• Trend continuation strategies
• Breakout participation
• Momentum trading
or instead
• Range trading
• Mean reversion strategies
• Oscillation-based setups
The indicator therefore acts as a decision filter rather than a trade trigger.
Key Features
Unified regime classification combining multiple market characteristics
Automatic detection of trending vs mean-reverting environments
Smooth regime transitions to reduce noise and false flips
Visual histogram representing regime strength
Automatic chart candle coloring based on environment
On-chart regime change labeling for clarity
Configurable lookback and smoothing controls
Works across all timeframes and asset classes
Suitable for discretionary and systematic traders
Designed for integration into multi-indicator workflows
How It Works (Conceptual)
Instead of relying on a single measurement, Ultimate Regime evaluates several dimensions of market behavior simultaneously, such as:
• Price expansion versus contraction
• Volatility shifts
• Directional persistence
• Structural movement characteristics
These components are normalized and combined into a composite regime value. The result is then smoothed to ensure regime changes reflect genuine environment shifts rather than short-term fluctuations.
When the combined regime value turns positive, the market is considered to favor directional movement. When it turns negative, price behavior favors oscillation and mean reversion.
The internal weighting and transformation methods remain proprietary in the invite-only version.
Regime States Explained
Trending Regime
Indicates directional dominance where price tends to move persistently in one direction. Momentum and breakout systems typically perform better under these conditions.
Mean Reverting Regime
Indicates oscillatory behavior where price frequently returns toward equilibrium zones. Range strategies and reversal setups often become more effective.
Neutral Transitions
Short transition periods may occur during regime changes as the environment reorganizes before committing to a dominant state.
Visual Components
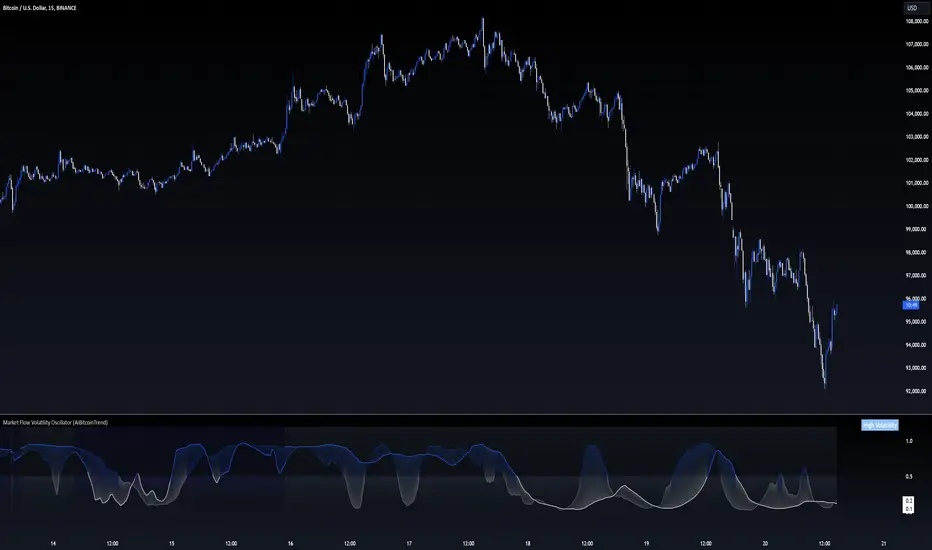
Regime Histogram
A histogram displays regime strength and direction, making it easy to gauge whether trending or reverting behavior dominates.
Colored Candles
Price candles automatically change color according to regime classification, allowing instant environment recognition directly on the chart.
Regime Change Labels
Labels appear when regime shifts occur, helping traders visually track transitions between trending and mean-reverting phases.
Reference Thresholds
Visual guide levels help users understand regime extremes and neutral zones.
Inputs Overview
Source
Selects the price data used for regime analysis.
High-Low Difference Lookback
Controls how far back structural price expansion is evaluated.
ATR Lookback
Adjusts how volatility expansion or contraction is measured.
Standard Deviation Lookback
Defines the evaluation window for statistical price dispersion.
ADX Lookback
Controls directional persistence measurement sensitivity.
Smoothing Period
Applies smoothing to regime calculations, balancing responsiveness and stability.
Higher smoothing reduces noise but delays regime changes. Lower smoothing reacts faster but may increase regime flipping.
Usage Guidelines
Use Ultimate Regime as a strategy filter rather than a direct entry signal.
Trending regime environments generally favor:
• Breakout systems
• Momentum entries
• Trend-following approaches
• Pullback continuation trades
Mean-reverting environments generally favor:
• Range trading
• Support and resistance reversals
• Oscillation strategies
• Counter-trend setups
Regime analysis works best when combined with entry and risk tools rather than used standalone.
Practical Applications
Strategy selection switching between trend and range systems
Position sizing adjustments based on environment strength
Filtering trades that conflict with prevailing market behavior
Algorithmic system optimization
Portfolio regime monitoring
Timeframe alignment analysis
Parameter Tuning Notes
Lower lookback values increase responsiveness but may produce faster regime changes.
Higher lookback values stabilize regime detection for swing or position trading.
Short smoothing periods work better for intraday trading.
Longer smoothing periods help long-term traders avoid noise.
Optimal settings vary by asset volatility and timeframe.
Best Practices
Combine regime detection with price structure and confirmation tools.
Avoid forcing trend systems in reverting environments and vice versa.
Use regime awareness to improve trade selection discipline.
Backtest strategies separately for trending and mean-reverting periods.
Summary
Ultimate Regime provides a structured and adaptive view of market conditions by classifying whether the environment favors trend continuation or mean reversion. By separating environment analysis from trade signals, traders gain clarity in strategy selection and improve consistency across changing market conditions.
The invite-only version preserves proprietary calculation methods while delivering a robust regime detection framework suitable for discretionary traders, system developers, and algorithmic strategies alike.
Wskaźnik Pine Script®