[KF] Multi-Duration Rate Expectations IndicatorAfter last fed cut in Oct then following jump in rates, I was frustrated at not having access to good rate expectations vs actual because the market usually prices in prior to fed action. This indicator was developed to make futures market rate expectations accessible and interpretable without requiring professional bond analytics systems.
Summary
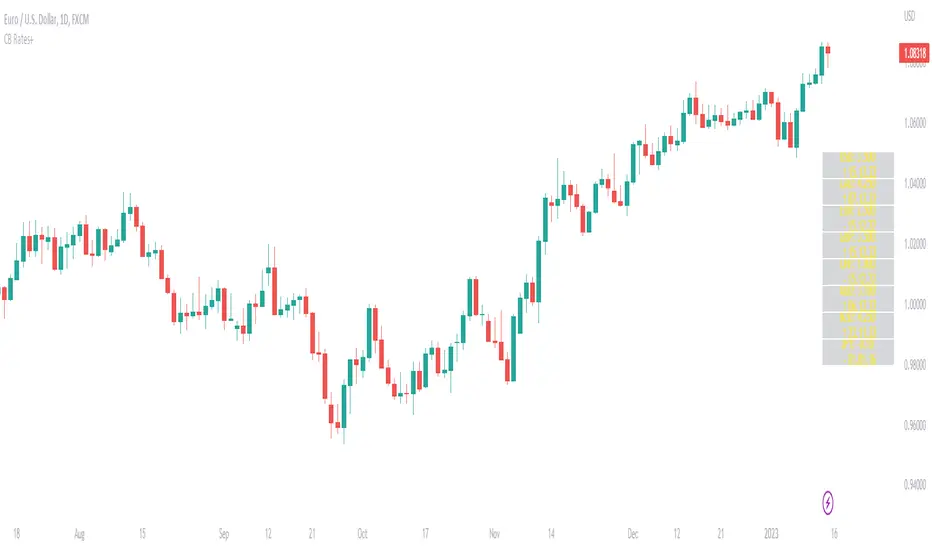
This Pine Script indicator reveals what the futures market expects for interest rates across three key durations: Fed Funds (overnight), 2-Year, and 10-Year Treasury yields. By comparing futures-implied rates against current spot yields, it provides a clear visual signal of whether the market expects rates to rise, fall, or remain steady.
Understanding Rate Futures
Fed Funds futures (ZQ1!) use a simple design where the expected rate equals 100 minus the futures price. If ZQ1! trades at 96.12, the market expects a 3.88% Fed Funds rate. Treasury futures work differently - they trade as bond prices (typically 102-115) that move inversely to yields. Converting Treasury futures to implied yields requires complex bond mathematics involving duration and conversion factors.
This indicator solves the Treasury futures complexity by implementing a self-calibrating sensitivity model. It observes the historical relationship between futures prices and yields, then uses this to project rate expectations. The model also compares front-month to next-month contracts to detect expected rate direction, automatically adapting as market conditions change.
How to Use
Add the indicator to any chart and select your desired duration in the settings. The display shows the futures-implied rate, current yield, and the difference between them. Green indicates the market expects higher rates, red means lower expectations, and gray shows expectations in line with current rates.
The indicator excels at identifying divergences between market expectations and current rates, which often precede rate movements or futures repricing. Comparing expectations across different durations reveals insights about yield curve positioning and Fed policy anticipation.
Technical Note
While Fed Funds futures provide exact rate expectations, Treasury futures conversions are sophisticated approximations that provide reliable directional signals and reasonable magnitude estimates sufficient for most trading applications.
Rates

US/SPY- Financial Regime Index Swing Strategy Credits: concept inspired by EdgeTools Bloomberg Financial Conditions Index (Proxy)
Improvements: eight component basket, inverse volatility weights, winsorization option( statistical technique used to limit the influence of outliers in a dataset by replacing extreme values with less extreme ones, rather than removing them entirely), slope and price gates, exit guards, table and gradients.
Summary in one paragraph
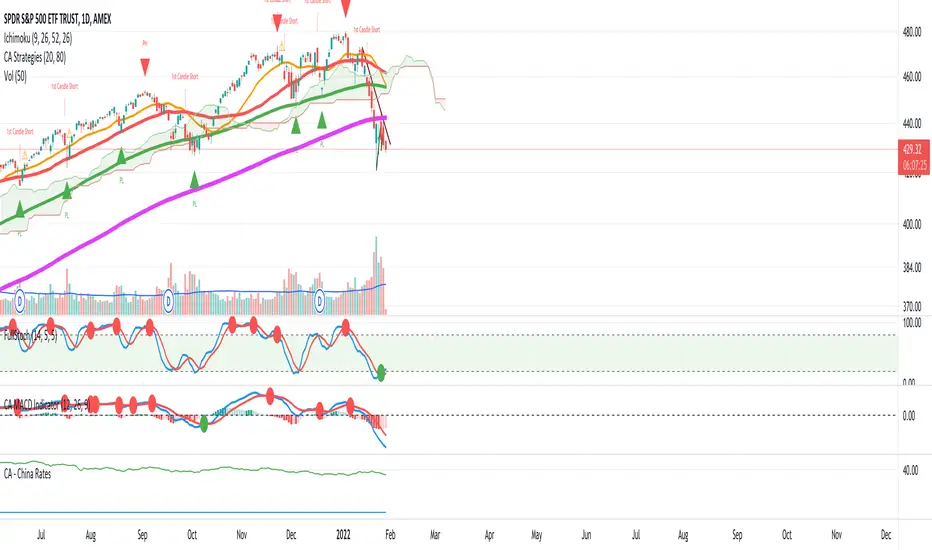
A macro regime swing strategy for index ETFs, futures, FX majors, and large cap equities on daily calculation with optional lower time execution. It acts only when a composite Financial Conditions proxy plus slope and an optional price filter align. Originality comes from an eight component macro basket with inverse volatility weights and winsorized return z scores that produce a portable yardstick.
Scope and intent
Markets: SPY and peers, ES futures, ACWI, liquid FX majors, BTC, large cap equities.
Timeframes: calculation daily by default, trade on any chart.
Default demo: SPY on Daily.
Purpose: convert broad financial conditions into clear swing bias and exits.
Originality and usefulness
Unique fusion: return z scores for eight liquid proxies with inverse volatility weighting and optional winsorization, then slope and price gates.
Failure mode addressed: false starts in chop and early shorts during easy liquidity.
Testability: all knobs are inputs and the table shows components and weights.
Portable yardstick: z scores center at zero so thresholds transfer across symbols.
Method overview in plain language
Base measures
Return basis: natural log return over a configurable window, standardized to a z score. Winsorization optional to cap extremes.
Components
EQ US and EQ GLB measure equity tone.
CREDIT uses LQD over HYG. Higher credit quality outperformance is risk off so sign is flipped after z score.
RATES2Y uses two year yield, sign flipped.
SLOPE uses ten minus two year yield spread.
USD uses DXY, sign flipped.
VOL uses VIX, sign flipped.
LIQ uses BIL over SPY, sign flipped.
Each component is smoothed by the composite EMA.
Fusion rule
Weighted sum where weights are equal or inverse volatility with exponent gamma, normalized to percent so they sum to one.
Signal rule
Long when composite crosses up the long threshold and its slope is positive and price is above the SMA filter, or when composite is above the configured always long floor.
Short when composite crosses down the short threshold and its slope is negative and price is below the SMA filter.
Long exit on cross down of the long exit line or on a fresh short signal.
Short exit on cross up of the short exit line or on a fresh long signal, or when composite falls below the force short exit guard.
What you will see on the chart
Markers on suggestion bars: L for long, S for short, LX and SX for exits.
Reference lines at zero and soft regime bands at plus one and minus one.
Optional background gradient by regime intensity.
Compact table with component z, weight percent, and composite readout.
Table fields and quick reading guide
Component: EQ US, EQ GLB, CREDIT, RATES2Y, SLOPE, USD, VOL, LIQ.
Z: current standardized value, green for positive risk tone where applicable.
Weight: contribution percent after normalization.
Composite: current index value.
Reading tip: a broadly green Z column with slope positive often precedes better long context.
Inputs with guidance
Setup
Calc timeframe: default Daily. Leave blank to inherit chart.
Lookback: 50 to 1500. Larger length stabilizes regimes and delays turns.
EMA smoothing: 1 to 200. Higher smooths noise and delays signals.
Normalization
Winsorize z at ±3: caps extremes to reduce one off shocks.
Return window for equities: 5 to 260. Shorter reacts faster.
Weighting
Weight lookback: 20 to 520.
Weight mode: Equal or InvVol.
InvVol exponent gamma: 0.1 to 3. Higher compresses noisy components more.
Signals
Trade side: Long Short or Both.
Entry threshold long and short: portable z thresholds.
Exit line long and short: soft exits that give back less.
Slope lookback bars: 1 to 20.
Always long floor bfci ≥ X: macro easy mode keep long.
Force short exit when bfci < Y: macro stress guard.
Confirm
Use price trend filter and Price SMA length.
View
Glow line and Show component table.
Symbols
SPY ACWI HYG LQD VIX DXY US02Y US10Y BIL are defaults and can be changed.
Realism and responsible publication
No performance claims. Past is not future.
Shapes can move intrabar and settle on close.
Execution is on standard candles only.
Honest limitations and failure modes
Major economic releases and illiquid sessions can break assumptions.
Very quiet regimes reduce contrast. Use longer windows or higher thresholds.
Component proxies are ETFs and indexes and cannot match a proprietary FCI exactly.
Strategy notice
Orders are simulated on standard candles. All security calls use lookahead off. Nonstandard chart types are not supported for strategies.
Entries and exits
Long rule: bfci cross above long threshold with positive slope and optional price filter OR bfci above the always long floor.
Short rule: bfci cross below short threshold with negative slope and optional price filter.
Exit rules: long exit on bfci cross below long exit or on a short signal. Short exit on bfci cross above short exit or on a long signal or on force close guard.
Position sizing
Percent of equity by default. Keep target risk per trade low. One percent is a sensible starting point. For this example we used 3% of the total capital
Commisions
We used a 0.05% comission and 5 tick slippage
Legal
Education and research only. Not investment advice. Test in simulation first. Use realistic costs.

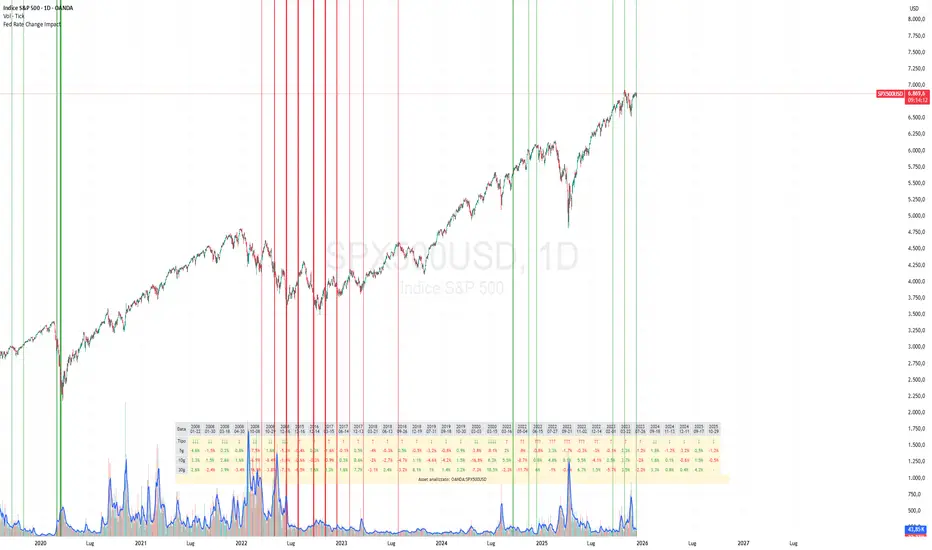
Fed Rate Change Impact📊 Fed Rate Change Impact — Macro Event-Driven Indicator
Fed Rate Change Impact is an advanced indicator designed to analyze the impact of Federal Reserve interest rate changes on financial markets. It integrates event-driven logic with dynamic visualization, percentage diagnostics, and multi-asset selection, offering a clear and customizable view of post-event effects.
🔍 Key Features 📅 Preloaded Fed Events : Includes over 30 historical rate cut (↓) and hike (↑) dates from 2008 to 2024.
📈 Post-Event Analysis : Calculates the percentage change of the selected asset 5, 10, and 30 days after each event.
📌 Vertical Chart Lines : Visually highlights each event directly on the chart, with dynamic coloring (red for hikes, green for cuts).
📋 Diagnostic Table : Displays real-time impact for each event, with color-coded values and a compact layout.
🧠 Interactive Filter: Choose to display only hikes, only cuts, or both.
🧭 Flexible Asset Selection : Analyze the current chart asset, pick from a predefined list, or manually input any ticker via input.symbol().
🎯 Contextual Highlighting : The table highlights the analyzed asset if it matches the active chart symbol.
⚙️ Customizable Parameters lookahead5, lookahead10, lookahead30: Define the time horizon for measuring post-event impact.
eventFilter : Choose which type of events to display.
presetAsset / customAsset : Select or input the asset to analyze.
🧪 Recommended Use Cases Macroeconomic analysis on indices, commodities, crypto, and forex
Studying delayed effects of rate changes on sensitive assets
Building event-driven strategies or diagnostic overlays
Visual backtesting and cross-asset comparison
🧠 Technical Notes The indicator is compatible with overlay=true and works best on Daily timeframe.
The table automatically adapts to the number of events and includes visual padding for improved readability.
All calculations are performed in real time and require no external data.
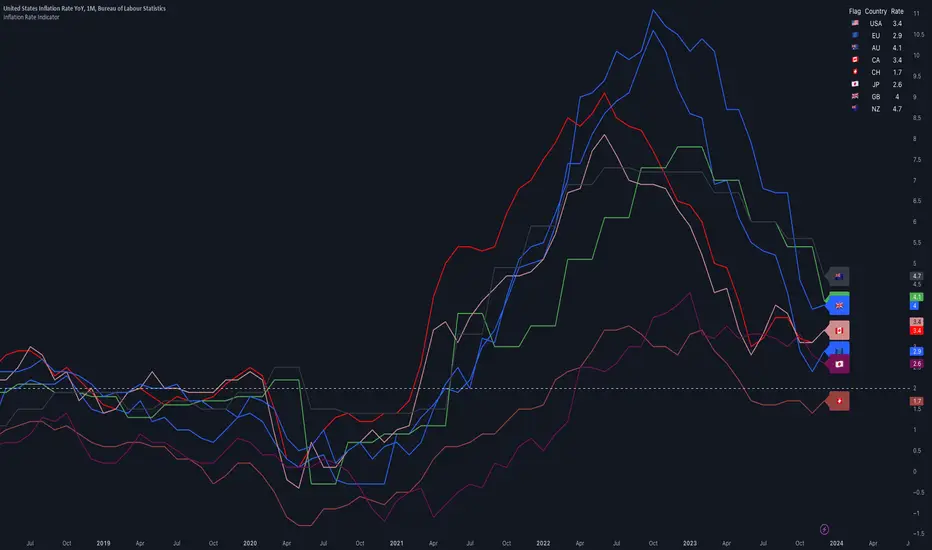
Inflation IndicatorThis script provides a great view of Year-over-Year (YoY) inflation rates for key countries.
The inflation data used per default are TradingView Tickers, but you can change them to anything you want from the settings.
There is no calculation in this script, all it does is providing a overview of inflation rates in a single indicator.
Inflation data for the USA, European Union, Australia, Canada, Switzerland, Japan, United Kingdom, and New Zealand (Inflation Symbols editable in the settings)
Customizable static line to indicate a specific threshold value (default: 2.0).
Table displaying country flags, names, and the latest inflation rates.
Country-representative colors for easy identification.
US Inversions & RecessionsUnderstand when the US yield curve inverted and when recessions took place. Select from Federal Funds Rate, 3 month yield, 2 year yield and 10 year yield.
Default ratio = Federal Funds Rate / 10 year yield
When line goes from white to red = inversion
When line goes from red to white = un-inversion
Yellow shading shows times when the rates are inverted.
Blue shading shows when recessions officially occurred.

Currency ConverterWhat it is?
It's a Currency converter/Exchange rate Viewer.
How it works?
You put the main currency and the other currency in setting then it will show the converted rate in chart.

Yield Curve (1-10yr)Yield curve of the 1-10 year US Treasury Bonds, with over 60 years of history.
The Yield Curve is the interest rate on the 10 year bond minus the 1 year bond.
When it inverts (crosses under 0) a recession usually follows 6-12 months later.
It's a great leading indicator to identify risk in the macroeconomic environment.
Yield curves can be constructed on varying durations. Using a 1-year as the short-term bond provides a slightly faster response than the 2-year bond; and the 1-year has more historical data on TradingView.

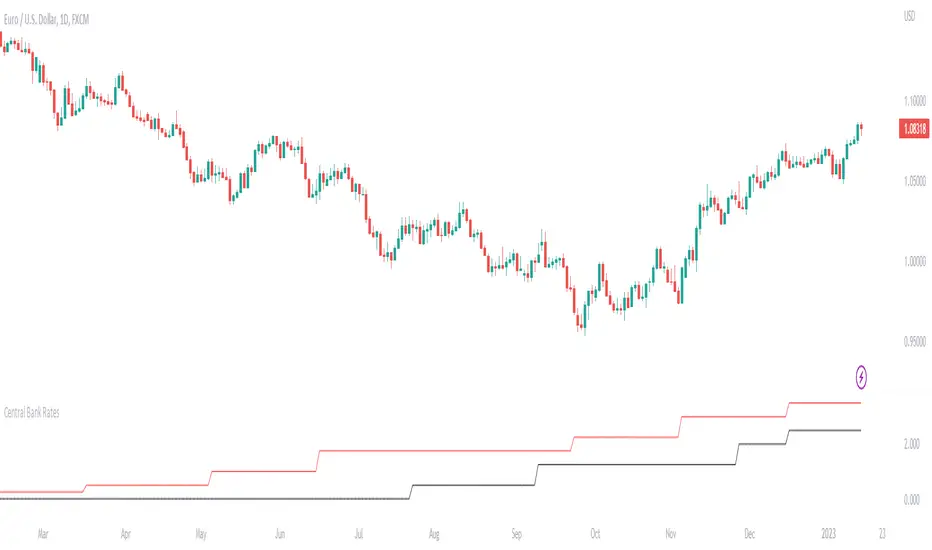
All Central Bank Interest RatesWith another period of mass interest rates manipulation, I created this indicator to show them all. It reveals latest interest ratest (at a time of the last update) and a date when each central bank manipulated the rates.
If you would rather view a single pair data check: and
Interest Rates | USA / EU / UKThis script shows the Interest Rates of the USA, EU and UK.
USA = Red
EU = Blue
UK = White

CA - China RatesScript to include possible rates.
Initial draft pulling data from Nasdaq to plot china rates.
Note:
Will include settings later to compare more rates.
REAL MARKET RATESBased on near and long term eurodollar yield curve. Attempts to indicate, through a spread median, how major players may position themselves in the near future.

Central Bank Interest RatesThis indicator will show central bank interest rates on any major currency pairs.
I included the last 10 values for the study and will update them with future changes.
Major currencies: USD, CAD, NZD, AUD, JPY, EUR, CHF, GBP
I might add CZK, TRY, ZAR, and Yuan in the future.
Rate ConverterThis is a simple rate converter that can convert almost anything into almost anything else. It supports cryptocurrencies, currencies and most commodities.
On the chart we see the following:
USD (US Dollar) into EUR (Euro) as a candle stick chart
WTICO (West Texas Intermediate Crude Oil) into ISK (Icelandic Krona) as a bar chart
ADA (Cardano) into JMD (Jamaican Dollar) as a line chart
XPT (Platinum) into XAG (Silver) as a scatter plot
It supports plotting the rates as japanese candlesticks, bars, lines, or as a scatter plot.

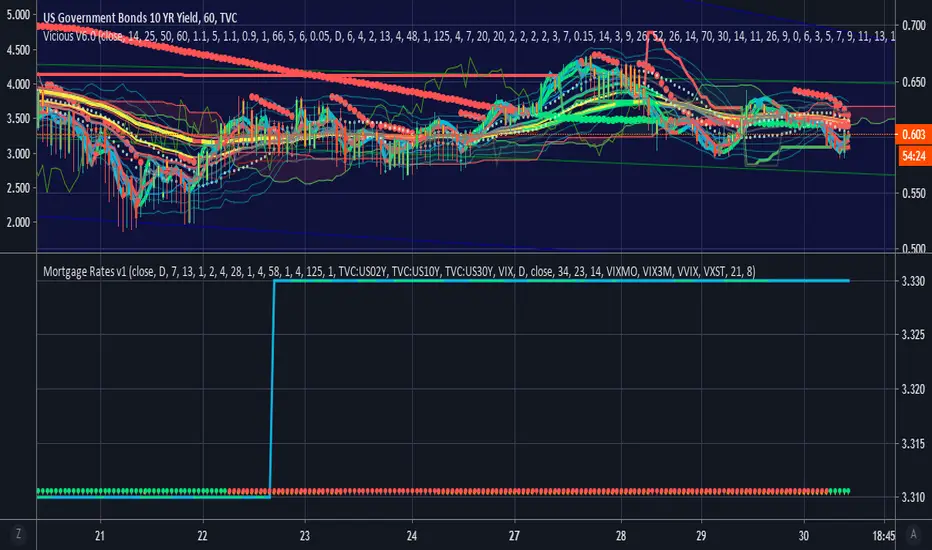
Vicious Mortgage Rates V1.0A script that contains real time mortgage rates from Wells Fargo using the QUANDL data link.
Use this lower indicator with US10Y or others on the top.
VIX will be added as well to help inform and predict.
List of Available Mortgage Interest Rates including APR or IR (Interest Rate)
*NOTE* : Not all indicators are up and running yet but will be very soon.
INDICATOR|CODE
Purchase Rate Conforming Loan 30-Year Fixed Rate Interest Rate|PR_CON_30YFIXED_IR
Purchase Rate Conforming Loan 30-Year Fixed Rate APR|PR_CON_30YFIXED_APR
Purchase Rate Government Loan 30-Year Fixed-Rate FHA Interest Rate|PR_GOV_30YFIXEDFHA_IR
Purchase Rate Government Loan 30-Year Fixed-Rate FHA APR|PR_GOV_30YFIXEDFHA_APR
Purchase Rate Conforming Loan 15-Year Fixed Rate Interest Rate|PR_CON_15YFIXED_IR
Purchase Rate Conforming Loan 15-Year Fixed Rate APR|PR_CON_15YFIXED_APR
*Purchase Rate Conforming Loan 7/1 ARM Interest Rate|PR_CON_71ARM_IR
*Purchase Rate Conforming Loan 7/1 ARM APR|PR_CON_71ARM_APR
*Purchase Rate Conforming Loan 5/1 ARM FHA Interest Rate|PR_CON_51ARM_IR
*Purchase Rate Conforming Loan 5/1 ARM FHA APR|PR_CON_51ARM_APR
Purchase Rate Government Loan 5/1 ARM FHA Interest Rate|PR_GOV_51ARMFHA_IR
Purchase Rate Government Loan 5/1 ARM FHA APR|PR_GOV_51ARMFHA_APR
Purchase Rate Larger Loan Amounts in Eligible Areas (Conforming Loan) 30-Year Fixed Rate Interest Rate|PR_LARGERCON_30YFIXED_IR
Purchase Rate Larger Loan Amounts in Eligible Areas (Conforming Loan) 30-Year Fixed Rate APR|PR_LARGERCON_30YFIXED_APR
Purchase Rate Larger Loan Amounts in Eligible Areas (Government Loan) 30-Year Fixed-Rate FHA Interest Rate|PR_LARGERGOV_30YFIXEDFHA_IR
Purchase Rate Larger Loan Amounts in Eligible Areas (Government Loan) 30-Year Fixed-Rate FHA APR|PR_LARGERGOV_30YFIXEDFHA_APR
Purchase Rate Larger Loan Amounts in Eligible Areas (Conforming Loan) 7/1 ARM Interest Rate|PR_LARGERCON_71ARM_IR
Purchase Rate Larger Loan Amounts in Eligible Areas (Conforming Loan) 7/1 ARM APR|PR_LARGERCON_71ARM_APR
Purchase Rate Jumbo Loan (Amounts that exceed conforming loan limits) 30-Year Fixed Rate Interest Rate|PR_JUMBO_30YFIXED_IR
Purchase Rate Jumbo Loan (Amounts that exceed conforming loan limits) 30-Year Fixed Rate APR|PR_JUMBO_30YFIXED_APR
Purchase Rate Jumbo Loan (Amounts that exceed conforming loan limits) 7/1 ARM Interest Rate|PR_JUMBO_71ARM_IR
Purchase Rate Jumbo Loan (Amounts that exceed conforming loan limits) 7/1 ARM APR|PR_JUMBO_71ARM_APR
Refinance Rate Conforming Loan 30-Year Fixed Rate Interest Rate|RR_CON_30YFIXED_IR
Refinance Rate Conforming Loan 30-Year Fixed Rate APR|RR_CON_30YFIXED_APR
Refinance Rate Government Loan 30-Year Fixed-Rate FHA Interest Rate|RR_GOV_30YFIXEDFHA_IR
Refinance Rate Government Loan 30-Year Fixed-Rate FHA APR|RR_GOV_30YFIXEDFHA_APR
Refinance Rate Conforming Loan 15-Year Fixed Rate Interest Rate|RR_CON_15YFIXED_IR
Refinance Rate Conforming Loan 15-Year Fixed Rate APR|RR_CON_15YFIXED_APR
*Refinance Rate Conforming Loan 7/1 ARM Interest Rate|RR_CON_71ARM_IR
*Refinance Rate Conforming Loan 7/1 ARM APR|RR_CON_71ARM_APR
*Refinance Rate Conforming Loan 5/1 ARM Interest Rate|PR_CON_51ARM_IR
*Refinance Rate Conforming Loan 5/1 ARM APR|PR_CON_51ARM_APR
Refinance Rate Government Loan 5/1 ARM FHA Interest Rate|RR_GOV_51ARMFHA_IR
Refinance Rate Government Loan 5/1 ARM FHA APR|RR_GOV_51ARMFHA_APR
Refinance Rate Larger Loan Amounts in Eligible Areas (Conforming Loan) 30-Year Fixed Rate Interest Rate|RR_LARGERCON_30YFIXED_IR
Refinance Rate Larger Loan Amounts in Eligible Areas (Conforming Loan) 30-Year Fixed Rate APR|RR_LARGERCON_30YFIXED_APR
Refinance Rate Larger Loan Amounts in Eligible Areas (Government Loan) 30-Year Fixed-Rate FHA Interest Rate|RR_LARGERGOV_30YFIXEDFHA_IR
Refinance Rate Larger Loan Amounts in Eligible Areas (Government Loan) 30-Year Fixed-Rate FHA APR|RR_LARGERGOV_30YFIXEDFHA_APR
Refinance Rate Larger Loan Amounts in Eligible Areas (Conforming Loan) 7/1 ARM Interest Rate|RR_LARGERCON_71ARM_IR
Refinance Rate Larger Loan Amounts in Eligible Areas (Conforming Loan) 7/1 ARM APR|RR_LARGERCON_71ARM_APR
Refinance Rate Jumbo Loan (Amounts that exceed conforming loan limits) 30-Year Fixed Rate Interest Rate|RR_JUMBO_30YFIXED_IR
Refinance Rate Jumbo Loan (Amounts that exceed conforming loan limits) 30-Year Fixed Rate APR|RR_JUMBO_30YFIXED_APR
Refinance Rate Jumbo Loan (Amounts that exceed conforming loan limits) 7/1 ARM Interest Rate|RR_JUMBO_71ARM_IR
Refinance Rate Jumbo Loan (Amounts that exceed conforming loan limits) 7/1 ARM APR|RR_JUMBO_71ARM_APR
QUANDL:FRED/MORTG
Feature to be Added:
Trending
Oscillators
Alerts
www.quandl.com