PVSRA Volume Suite with Volume DeltaPVSRA Volume Suite with Volume Delta
🔹 Overview
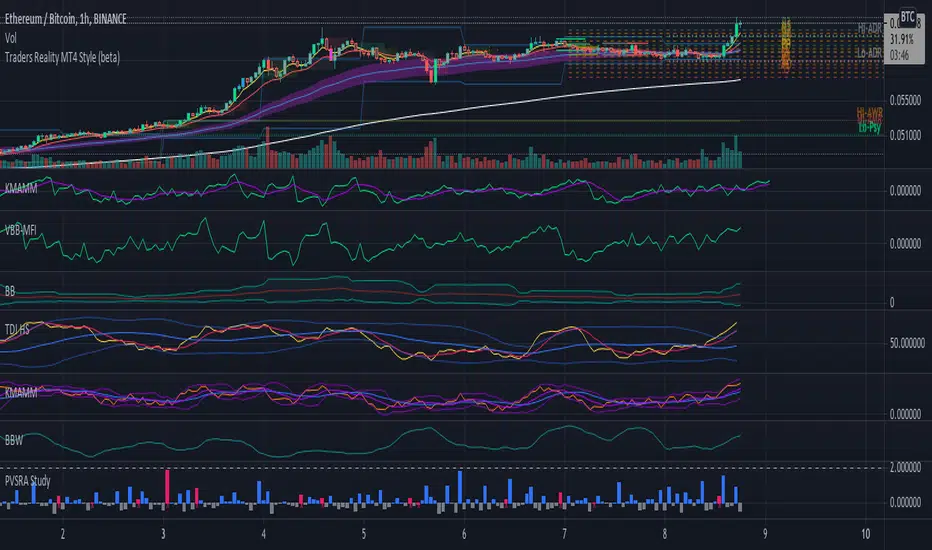
This indicator is a Volume Suite that enhances PVSRA (Price, Volume, Support, Resistance Analysis) by incorporating Volume Delta and AI-driven predictive alerts. It is designed to help traders analyze volume pressure, market trends, and price movements with color-coded visualizations.
📌 Key Features
PVSRA Volume Color Coding – Highlights vector candles based on extreme volume/spread conditions.
Volume Delta Analysis – Tracks buying/selling pressure using up/down volume data.
AI-Powered Predictive Alerts – Identifies potential trend shifts based on volume and trend context.
Volatility-Adjusted Thresholds – Dynamically adapts volume conditions based on ATR (Average True Range).
Customizable MA & Symbol Overrides – Allows traders to tweak settings for personalized market insights.
Debug & Diagnostic Labels – Shows statistical z-scores, thresholds, and volume dynamics.
How It Works
PVSRA Color Coding – The script classifies candles into four categories based on volume and spread analysis:
🔴 Red Vector → Extreme bearish volume/spread
🟢 Green Vector → Extreme bullish volume/spread
🟣 Violet Vector → Above-average bearish volume
🔵 Blue Vector → Above-average bullish volume
Volume Delta Calculation – Uses lower timeframe volume analysis to estimate up/down volume differentials.
Trend & Predictive Alerts – Combines EMA crossovers with statistical volume analysis to detect potential trend shifts.
Volatility Adaptation – Adjusts volume thresholds based on ATR, making signals more reliable in changing market conditions.
Custom Symbol Override – Fetches PVSRA data from a different instrument, useful for index-based volume analysis.
Customizable Inputs
PVSRA Color Settings – Modify candle color schemes for better visual clarity.
Volume Delta Colors – Customize delta volume body, wick, and border colors.
AI Settings – Tune z-score thresholds, lookback periods, and enable predictive alerts.
Symbol Overrides – Analyze volume from a different market or asset.
Moving Average (MA) Settings – Display a volume-based moving average for trend confirmation.
Important Notes
Works best on intraday timeframes where volume data is reliable.
Lower timeframe volume delta estimates might not be precise for all assets.
No guarantees of accuracy – Use alongside other confluence tools for decision-making.
Credits & Open-Source Notice
This script is based on PVSRA methodologies and integrates Volume Delta analysis. Special thanks to Traders Reality and TradingView for their contributions to volume-based analysis.
Pvsravolume

PVSRA StudyThis script will show you the percentage change in volume and also consider stopping volume that is genuine reversal volume.
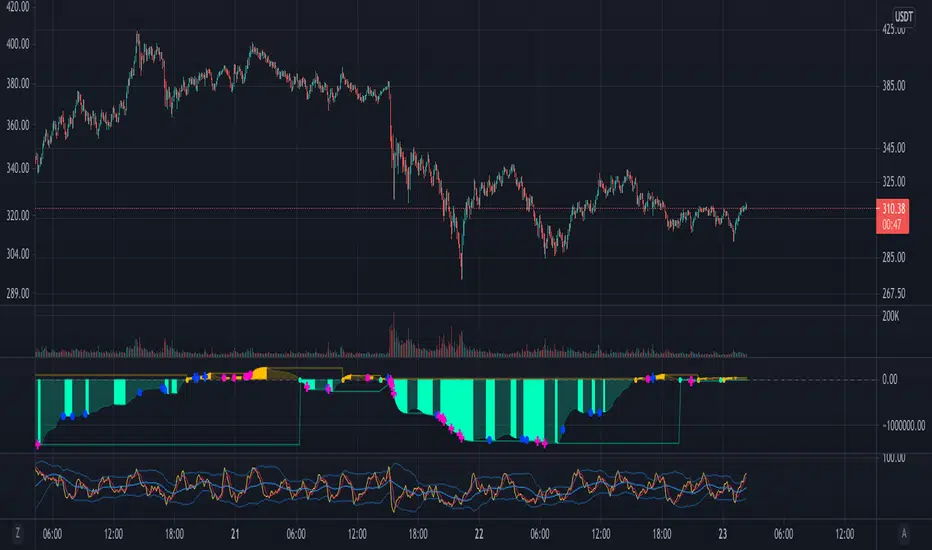
Market Maker BalanceWhere is the market maker in his cycle of building longs or shorts? When is that big drop or big pump coming?
This is a simple and unexpectedly powerful indicator that shows you an estimate of the market maker's position over the last 200 candles. It works on any timeframe.
How does it work?
It combines a simple 10-candle Price Volume Support Resistance Analysis metric of climactic and rising volume. That volume is combined to create a bullish and bearish balance over a period of 200 candles. The curves are smoothed out with a 10 period EMA.
The MMB (Marker Maker Balance) oscillator is the resulting bearish volume - bullish volume, which shows us THEIR position balance.
Indications:
when shorts are increasing (further below 0), we are in a bullish trend -- you should be taking profit on longs
when shorts are flat or decreasing, the trend is due for a reversal -- you should be closing longs and looking to short
when shorts cross 0 to long, the trend is reversing down -- you should be in a short position by now
when longs are increasing, we are in a bearish trend -- you should be taking profits on your shorts
when longs are flat or decreasing, the trend is due for a reversal -- you should be closing your shorts
For extra information, there are also the separate lines for rising and climactic volume to give you early indications of reversal or change in Market Maker behaviour. You can disable them in the Style settings, but they can be a useful early indicator that the current trend is losing strength when rising volume overtakes climax volume (MM's no longer moving out of zones higher/lower).
Ways to use this indicator are quite simple and eerily accurate:
for short term gains, do the opposite of MMs: long when MM are opening more shorts, short when they are opening more longs
for huge positions, mimic the MM position: build long positions / close shorts when MMB is rising, build shorts / close longs when MMB is falling or crosses above 0 (be careful with leverage, begin on 1x leverage)
Note: the results of this indicator will be different for each exchange, because of their different trading volumes per candle. It's advisable to use it for the exchange you're trading on or use a chart that averages all exchanges for that asset, like INDEX:BTCUSD.
For those of you who use the Backtesting & Trading Engine by PineCoders, the BTE Signal plot generates long and short entries as well as filter states. Use this plot as the source for BTE.
Shout out to @infernixx for PVSRA calculations in his awesome Traders Reality indicator, the code of which I shamelessly ripped off and edited for this indicator.
Leave comments below if you want something added.