MIZAN: Fake Out / Inducement HunterDescription
STOP GETTING TRAPPED BY THE MARKET!
Are you tired of getting stopped out right before the market moves in your direction? This is called a Fake Out or Liquidity Sweep. The "MIZAN Fake Out Hunter" is designed to detect these manipulation patterns automatically using Smart Money Concepts (SMC).
💎 How It Works:
Identifies Key Levels: The script automatically detects major Swing Highs and Swing Lows (Key Fractals) where liquidity (Stop Loss orders) is resting.
Detects Inducement: It monitors price action approaching these levels. When price creates "Equal Highs" or "Equal Lows" near a key level without breaking it, it identifies this as Inducement (a trap for retail traders).
Signals the Sweep: The signal fires ONLY when price aggressively breaks the level (sweeping the liquidity) and immediately rejects (closes back inside the range).
🚀 Features:
Bullish Fake Out (Green Signal): Detects when sellers are trapped at support (Stop Hunt Low).
Bearish Fake Out (Red Signal): Detects when buyers are trapped at resistance (Stop Hunt High).
Alerts Included: Never miss a manipulation setup again.
🧠 How to Trade: Use this indicator to confirm entries at Major Support/Resistance or Supply/Demand zones. Wait for the "FAKE OUT" signal to confirm that the Smart Money has finished collecting liquidity before entering the trade.
Prices

Daily O/C Span (Real Values & SMA Comparison)This Pine Script indicator helps you visualize and track the "momentum" or "strength" of each trading day, and compares it to a recent average. It essentially measures the net movement of the price from when the market opens to when it closes.
What the Script Does
The script performs the following actions:
Calculates Daily Movement: For every single trading day, it calculates the difference between the closing price and the opening price (Close - Open).
Plots the "Span": These daily differences are plotted as vertical bars (a histogram) in a separate window below your main price chart.
-Green bars mean the stock closed higher than it opened (a strong day).
-Red bars mean the stock closed lower than it opened (a weak day).
Calculates the Average: It calculates the Simple Moving Average (SMA) of these daily spans over an adjustable period (default is 30 days).
Plots the Average Line: A blue line is plotted over the green/red bars, showing the typical magnitude of daily movement.
Displays Comparison: A table in the top-right corner provides a quick, real-time numerical comparison of today's span versus the 30-day average span.
How It Can Improve Trading
This indicator helps you understand the character and conviction of price action, offering several trading insights:
Gauging Momentum: It clarifies whether the stock's moves are generally strong and sustained within a day (large spans) or hesitant (small spans).
Identifying Trends: During an uptrend, you might expect the average span line to be consistently positive (above zero), and vice versa for a downtrend. A positive average span indicates buyers are consistently closing the day stronger than where they started it.
Spotting Reversals: If a stock is in a strong uptrend but you suddenly see a series of large red bars (large negative spans), it could signal a shift in momentum and potential upcoming reversal.
Volatility Context: By comparing the current day's bar to the blue average line, you can quickly determine if today is an unusually strong/weak day relative to recent history.
In short, it helps you see the underlying buyer/seller conviction within each day, making it easier to gauge the overall market sentiment and anticipate potential shifts.

Price Widget on ScreenSimple yet useful script, to see the PRICE/CHANGE of the chart you are on. I use it in my 6/8 charts screen, so you can see the graph and the price.

Gann Single Square Swing Trading System with Gann AnglesGann Single Square Swing Trading System
This script automatically detects "squares" - geometric patterns where price movement equals time movement. When price moves the same distance as the number of bars (time), it creates powerful support/resistance levels based on Gann theory.
Key Visual Elements
• Box: The detected square pattern
• Dark Blue Line (50%): Most important trading level
• Green Lines: Profit target levels (125%, 150%)
• Red Lines: Stop loss levels (-25%, -50%)
• Colored Angle Lines: Gann angles for trend direction
• Quality Score: Blue label showing setup strength (aim for 70%+)
Simple Trading Rules
LONG Trades (Green 🟢 Square)
1. Entry: Buy when price touches the dark blue 50% line from above
2. Stop Loss: Place below the red -25% line
3. Take Profit: Exit at green 125% line (first target) or 150% line (second target)
SHORT Trades (Red 🔴 Square)
1. Entry: Sell when price touches the dark blue 50% line from below
2. Stop Loss: Place above the red -25% line
3. Take Profit: Exit at green 125% line (first target) or 150% line (second target)
Entry Checklist
✅ Square quality score > 70%
✅ Price touches 50% level (dark blue line)
✅ Volume above average (if volume filter enabled)
✅ Clear square formation visible
Alerts
The script generates automatic alerts when price reaches the 50% trading level. Enable alerts in TradingView to get notified of setups.
Bottom Line: Wait for the alert → Check quality score → Enter at 50% level → Set stop at red line → Take profit at green line.

Angled Gann Time-Price Squares with S/RThis is a Pine Script indicator that implements Angled Gann Time-Price Squares based on W.D. Gann's trading theory. Here's what it does:
Core Functionality
Detects pivot highs and lows using a configurable lookback period
Creates angled squares by connecting pivot points to current price action when specific geometric conditions are met
Validates square formation by checking if the price movement follows proper Gann angles (typically 45°, 135°, etc.) within a tolerance range
Key Features
Real-time square tracking: Shows both completed squares and forming squares in progress
Support/Resistance levels: Automatically generates S/R lines from:
Square edge extensions
Diagonal extensions (pivot centers)
Quarter/half levels within squares (25%, 50%, 75%)
Visual feedback: Color-coded squares (green for up, red for down, orange for forming)
Projection lines: Predicts where squares might complete based on Gann angle theory
Gann Theory Application
The indicator follows Gann's principle that time and price move in geometric harmony. It looks for price movements that form perfect squares when plotted on a chart, where the diagonal of the square represents the natural flow of price and time at specific angles.
The generated support/resistance levels are particularly valuable because they're based on completed geometric patterns rather than just horizontal price levels, making them potentially more significant according to Gann methodology.

TMB LevelsDescription:
Improved "Hourly Midline" indicator. It displays high, middle and low levels of every candle with specified timeframe (can be hourly, daily, or any other timeframe). You can change the source for the levels (either high and low of candle, or open and close of candle). Additionally, you can turn on the "Line chart", which essentially connects every midline, making a line chart of middle prices.
Parameters:
- Timeframe -> use data from this timeframe ("30" would mean 30 minutes, "60" would mean 1 hour, etc.)
- Source -> source for calculating the middle level
- Top -> parameters of the top level lines
- Middle -> parameters of the middle level lines
- Bottom -> parameters of the bottom level lines
- Line chart -> connect every midline, making a line chart

Equilibrium╭━━━╮╱╱╱╱╱╱╭╮╱╭╮
┃╭━━╯╱╱╱╱╱╱┃┃╱┃┃
┃╰━━┳━━┳╮╭┳┫┃╭┫╰━┳━┳┳╮╭┳╮╭╮
┃╭━━┫╭╮┃┃┃┣┫┃┣┫╭╮┃╭╋┫┃┃┃╰╯┃
┃╰━━┫╰╯┃╰╯┃┃╰┫┃╰╯┃┃┃┃╰╯┃┃┃┃
╰━━━┻━╮┣━━┻┻━┻┻━━┻╯╰┻━━┻┻┻╯
╱╱╱╱╱╱┃┃
╱╱╱╱╱╱╰╯
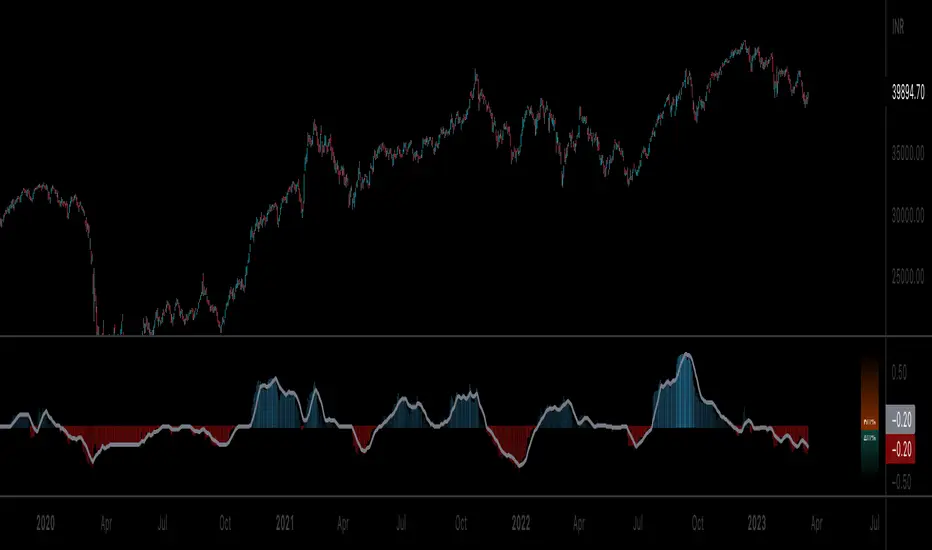
Overview
Equilibrium is a tool designed to measure the buying & selling pressure in the market. It is depicted as a “pressure gauge” that automatically adjusts as new candles are formed, providing a real-time indication of who's on top right now, buyers or sellers?
Background
Supply & demand is considered to be the main driving force of our modern economies, where the interaction between the two parties(sellers & buyers) leads to the determination of the fair price for a given product. Stock markets are no exception, they operate very much based around the idea of supply & demand.
In simple terms, supply refers to the availability of a product, and demand is the willingness of consumers to buy that product at a given price. It is obvious that different vendors may sell the same product at slightly different prices, and similarly, different customers may choose to buy the same product from different vendors at varying prices. The idea is that the price is allowed to fluctuate from time to time, but in a free & fair market, the price will eventually settle down to a value that makes both the parties happy. Such a state is known as the “Price-Equilibrium”, and this process is also referred to as the market mechanism.
This is the basic assumption around which this tool is based, the market is always trying to move towards a state of equilibrium.
Calculations
This tool takes a simplistic approach to estimate the degree of imbalance between buyers & sellers, here’s a brief summary of how the pressure is calculated:
- We compute the total lengths of red & green candles for a given period, i.e. price range multiplied by the volume for that candle.
- Then the distribution of each type of candle is calculated.
- Assuming more red candles denote more selling pressure, and green candles denote buying pressure, the gauge is populated cell by cell.
- As the pressure on one side increases, the intensity of the cell color also increases, signifying the extent to which one side is dominating.
How to use it
- The indicator is designed as a pressure gauge that moves up(vertical alignment) or to the right(horizontal alignment) as the buying pressure increases, and moves down or to the left as the selling pressure increases. How it is to be used & applied, that completely depends on your trading methodology. But, the general idea is that we expect the market to be in a state of equilibrium, and if that is not the case the tool will highlight that, and this is also where the opportunity lies to find suitable trades.
- Just by having an idea about who’s dominating the market currently, a trader can also pick sides wisely. Remember, the market is always striving to come back a state of equilibrium, and a slight imbalance can indicate the current trend, and more importantly, who’s more likely to make the next move.
User Settings
The tool offers some minimal configurations for the end user:
- You can choose to display the actual percentage value in the gauge(Show Text).
- You can adjust colors that denote buyers & sellers.
- You can change the layout of gauge, default is vertical(right side of the screen).
- Last, and most important, you can adjust the number of candles to traverse for calculating the pressure. Default is 50, can go upto 1000.
Multi Oscillators Price LevelsThis script draws price levels corresponding to the highest price reached in overbought situations, and the lowest price reached in oversold situations, depending on the oscillator and the timeframe the user has configured.
These levels correspond, most of time, to good supports and resistances prices.
Price levels drawings can be based on the following indicators:
Stochastic RSI (default)
Stochastic CCI
RSI
CCI
You can customize this indicator with the following options:
Source: The candle source to use in indicators calculation
Source Indicator: The indicator on which you cant to base your levels
Timeframe: The timeframe on which you want to apply the selected indicator, and calculate levels
Show supports/resistances: enable/disable price levels, depending on there status (overbought - resistances) / (oversold - supports)
Lines width: width of price levels. (set to 10 by default in order to draw "zones")
Supports/Resistances source: Select the candle data you cant to use to draw supports and resistances levels
Extend levels: Select the line extension for price levels
Levels color: Select the desired color for price levels
And of course , all parameters corresponding to the supported indicators (Stoch, RSI, CCI)
Here are a few examples of different configurations:
This script will probably be modified in the future, don't hesitate to suggest any improvement.

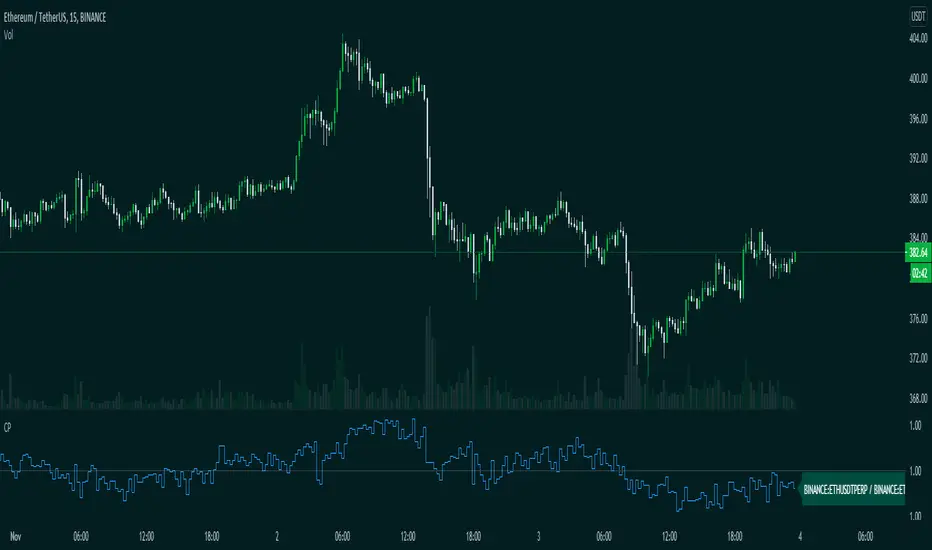
CompareThis indicator compare(Futures Price / Spot Price) futures and spot prices of an asset.
This indicator is made to work with crypto assets mainly.
Inputs:
1. Auto Symbols Selection: Select the symbols for comparision from the selected chart symbol (This option only works with Binance futures symbols)
2. Symbol 1: Symbol 1 for comparison
3. Symbol 2: Symbol 2 for comparison
4. Timeframe: Timeframe for comparison
Happy trading.
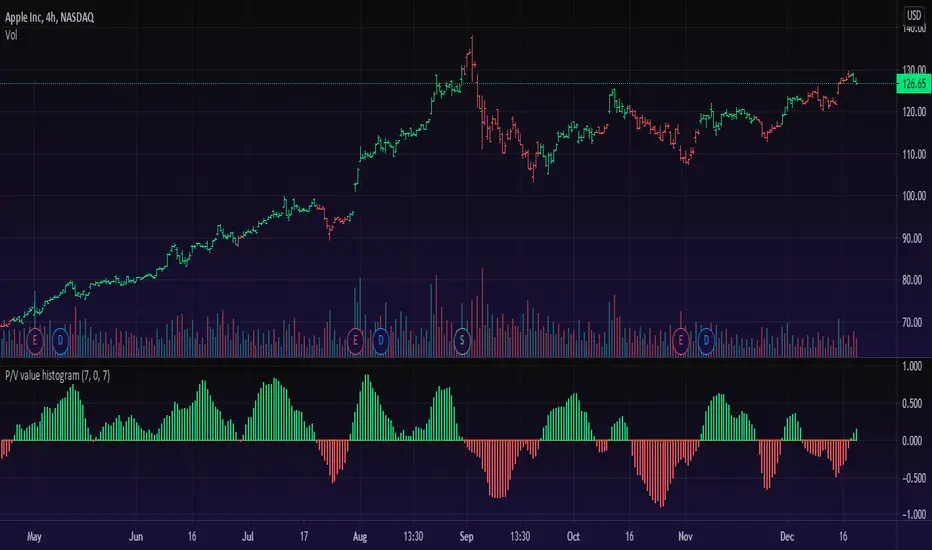
Price/Volume Value HistogramAn interesting implementation of mine to measure an asset changes based on asset price velocity and volume velocity. The indicator acts as asset value calculator. Long and Short.
==Points System Rules==
UPTRENDING
If Current Close is higher than previous Close and Current Volume is bigger than previous Volume: Adds Close Points and Volume Points
Otherwise check
If Current Close is higher than previous Close: Adds Only Close Points
DOWNTRENDING
If Current Close is lower than previous Close and Current Volume is bigger than previous Volume: Reduces Close Points and Volume Points
Otherwise check
If Current Close is lower than previous Close: Reduces Only Close Points
==Plotting==
Result of the values are summed up to a histogram.
Obviously on increasing prices and volume the histogram will be above zero line and on the Bullish side (green color), otherwise, on the Bearish side (red color).
You can't cheat the price movement, it's just what it is.
Optional to smooth it by EMA (set to true by default).
Like if you Like and Enjoy!
Follow for upcoming indicators.
52 Week High/Low52 Week High / Low Indicator
A simple, unobtrusive indicator that can be used on any timeframe to display the 52 week high/low values.
Features
Works on any timeframe.
Unobtrusive: Simple horizontal lines showing only the current 52 week values.
Allows the user to select whether to calculate the 52-week values from candle close values or the respective highs/lows.
For full overview and code commentary - Visit the backtest-rookies website.
