Key Price Levels + Zones"Support and resistance are rarely exact lines; hey are zones where price reacts."
This indicator upgrades standard horizontal levels by visualizing Liquidity Zones around the most critical intraday reference points: Pre-Market, Previous Day, and Previous Week Highs/Lows.
Unlike basic scripts that just draw thin lines, this tool combines the precision of exact price levels with the reality of market volatility. It offers deep customization, allowing you to separate line colors from zone colors, perfect for keeping your charts clean and professional.
Key Features
1. Dual Zone Logic (Dynamic Sizing)
• Price Tier Mode (Default): Zones are sized based on the asset price (e.g., higher-priced stocks get wider zones automatically). This mimics "psychological" levels.
• ATR Volatility Mode: Switches calculation to use the Average True Range (ATR). Zones expand during high volatility and contract during chop, adapting to the market conditions in real-time.
2. Ultimate Customization
• Separate Colors: You can finally set your Line Color (e.g., Bright Green) independently from your Zone Fill (e.g., Faint Grey).
• Individual Toggles: Turn the Line, Zone, or Label on/off individually for every single level.
• Line Styles: Differentiate daily levels (Solid) from weekly levels (Dashed) instantly.
3. The "Smart" Levels
• PM High/Low: Real-time Pre-Market tracking that freezes at the open.
• PD High/Low: Previous Day’s range.
• PW High/Low: Previous Week’s range (Critical for swing points).
---
Settings Guide
• Extension Style:
- Individual: Keeps history of levels for backtesting.
- Most Recent: Keeps the chart minimal by extending only today's levels.
• Zone Thickness Mode: Switch between "Price Tier" and "ATR Volatility".
• ATR Settings: Fully adjustable Length and Multiplier (when in ATR mode).
• Transparency: Global slider to control how subtle or bold the zones appear.
How to Trade This
• The "Trap": If price breaks a Line but fails to close outside the Zone, it is often a liquidity grab (fakeout).
• The Retest: Watch for price to break a level and use the Zone as a cushion for a bounce/retest entry.
Pricerange

Rolling Range Bands by tvigRolling Range Bands
Plots two dynamic price envelopes that track the highest and lowest prices over a Short and Long lookback. Use them to see near-term vs. broader market structure, evolving support/resistance, and volatility changes at a glance.
What it shows
• Short Bands: recent trading range (fast, more reactive).
• Long Bands: broader range (slow, structural).
• Optional step-line style and shaded zones for clarity.
• Option to use completed bar values to avoid intrabar jitter (no repaint).
How to read
• Price pressing the short high while the long band rises → short-term momentum in a larger uptrend.
• Price riding the short low inside a falling long band → weakness with trend alignment.
• Band squeeze (narrowing) → compression; watch for breakout.
• Band expansion (widening) → rising volatility; expect larger swings.
• Repeated touches/rejections of long bands → potential areas of support/resistance.
Inputs
• Short Window, Long Window (bars)
• Use Close only (vs. High/Low)
• Use completed bar values (stability)
• Step-line style and Band shading
Tips
• Works on any symbol/timeframe; tune windows to your market.
• For consistent scaling, pin the indicator to the same right price scale as the chart.
Not financial advice; combine with trend/volume/RSI or your system for entries/exits.

ADR & ATR OverlayADR & ATR Overlay
This indicator will display the following as an overlay on your chart:
ADR
% of ADR
ADR % of Price
ATR
% of ATR
ATR % of Price
Description:
ADR : Average Day Range
% of ADR : Percentage that the current price move has covered its average.
ADR % of Price : The percentage move implied by the average range.
ATR : Average True Range
% of ATR : Percentage that the current price move has covered its average.
ATR % of Price : The percentage move implied by the average true range.
Options:
Time Frame
Length
Smoothing
Enable or Disable each value
Text Color
Background Color
How to use this indicator:
The ADR and ATR can be used to provide information about average price moves to help set targets, stop losses, entries and exits based on the potential average moves.
Example: If the "% of ADR" is reading 100%, then 100% of the asset's average price range has been covered, suggesting that an additional move beyond the range has a lower probability.
Example: "ADR % of Price" provides potential price movement in percentage which can be used to asses R/R for asset.
Example: ADR (D) reading is 100% at market close but ATR (D) is at 70% at close. This suggests that there is a potential move of 30% in Pre/Post market as suggested by averages.
Notes:
These indicators are available as oscillators to place under your chart through trading view but this indicator will place them on the chart in numerical only format.
Please feel free to modify this script if you like but please acknowledge me, I am only a hobby coder so this takes some time & effort.

EMA Price Range by tuanduongEMA Price Range Indicator – Dynamic Range Analysis with Custom EMA (tuanduong2511)
Overview
The EMA Price Range Indicator is designed to help traders visualize the distance between price action and a key Exponential Moving Average (EMA). This indicator dynamically calculates the range from each candle to a user-defined EMA and displays it in a real-time table. By understanding the relationship between price and the EMA, traders can better gauge potential support, resistance, and overextension in the market.
Key Features
✅ Customizable EMA – Allows users to choose the EMA period that best suits their strategy (default: 144).
✅ Real-Time Range Calculation – Computes the absolute difference between the EMA and the price (using the high or low, depending on whether the candle is above or below the EMA).
✅ Minimalist UI – The EMA is plotted directly on the chart, while a small table in the bottom-right corner provides numerical insights, reducing chart clutter.
✅ Versatile Use Cases – Suitable for trend-following traders (identifying pullbacks to EMA) and mean-reversion traders (spotting extended price movements).
How It Works
User-Defined EMA:
The script calculates an Exponential Moving Average (EMA) based on the selected period.
EMA adapts dynamically, giving more weight to recent price movements.
Range Calculation:
If the price is above the EMA, the range is measured from the high point of the candle to the EMA.
If the price is below the EMA, the range is measured from the low point of the candle to the EMA.
This approach ensures that we’re measuring the most relevant distance for price interaction.
Live Table Display:
The current EMA value and the distance (range) from the price are displayed in a small table in the bottom-right corner of the chart.
How to Use It
📌 Trend Traders: Use the indicator to track pullbacks to key EMAs (e.g., EMA 50, 144, or 200). When the price is far from the EMA, it may indicate an overextended trend or potential retracement zone.
📌 Mean Reversion Traders: Look for extreme deviations between price and the EMA. Large distances can signal potential price snapbacks to the mean.
📌 Scalping & Day Trading: Short-term traders can use it with fast EMAs (e.g., EMA 21 or 34) to measure quick price movements relative to short-term momentum.
Why This Indicator?
Unlike traditional EMA indicators, which only plot a moving average, this script provides quantifiable price distance to the EMA, helping traders make data-driven decisions. It allows traders to answer:
✅ Is the price stretched too far from the EMA?
✅ Should I wait for a pullback before entering?
✅ Is the trend strong, or is the price losing momentum?
By integrating EMA-based range analysis, traders gain a clearer understanding of market conditions and can improve their entry, exit, and risk management strategies.
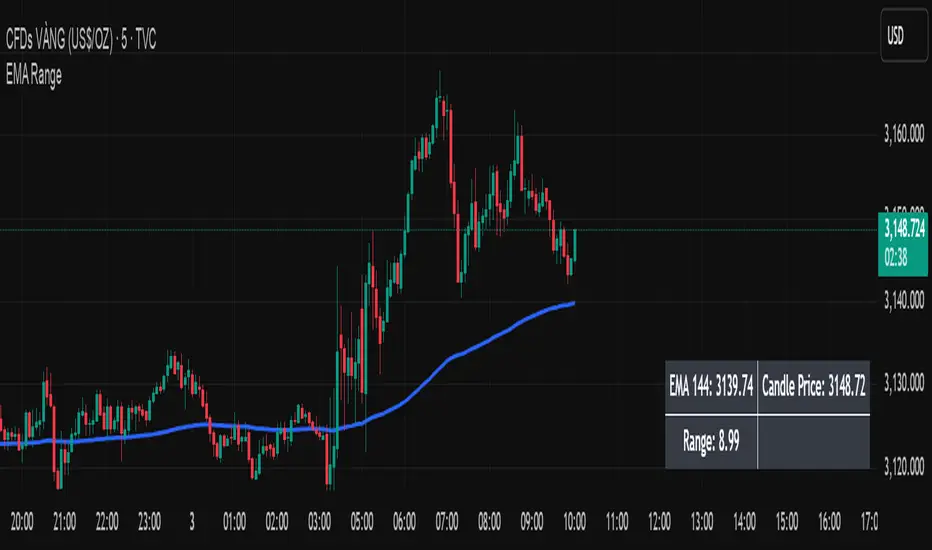
Chart Box Session Indicator [The Quant Science]This indicator allows highlighting specific time sessions within a chart by creating colored boxes to represent the price range of the selected session. Is an advanced and flexible tool for chart segmenting trading sessions. Thanks to its extensive customization options and advanced visualization features, it allows traders to gain a clear representation of key market areas based on chosen time intervals.
The indicator offers two range calculation modes:
Body to Body: considers the range between the opening and closing price.
Wick to Wick: considers the range between the session's low and high.
Body To Body
Wick to Wick
Key Features
1. Session Configuration
- Users can select the time range of the session of interest.
- Option to choose the day of the week for the calculation.
- Supports UTC timezone selection to correctly align data.
2. Customizable Visualization
- Option to display session price lines.
- Ability to show a central price line.
- Extension of session lines beyond the specified duration.
3. Design Display Configuration
- Three different background configurations to suit light and dark themes.
- Two gradient modes for session coloring:
- Centered: the color is evenly distributed.
- Off-Centered: the gradient is asymmetrical.
How It Works
The indicator determines whether the current time falls within the selected session, creating a colored box that highlights the corresponding price range. Depending on user preferences, the indicator draws horizontal lines at the minimum and maximum price levels and, optionally, a central line.
During the session:
- The lowest and highest session prices are dynamically updated.
- The range is divided into 10 bands to create a gradient effect.
- A colored box is generated to visually highlight the chosen session.
If the Extend Lines option is enabled, price lines continue even after the session ends, keeping the range visible for further analysis.
This indicator is useful for traders who want to analyze price behavior in specific timeframes. It is particularly beneficial for strategies based on market sessions (e.g., London or New York open) or for identifying accumulation and distribution zones.

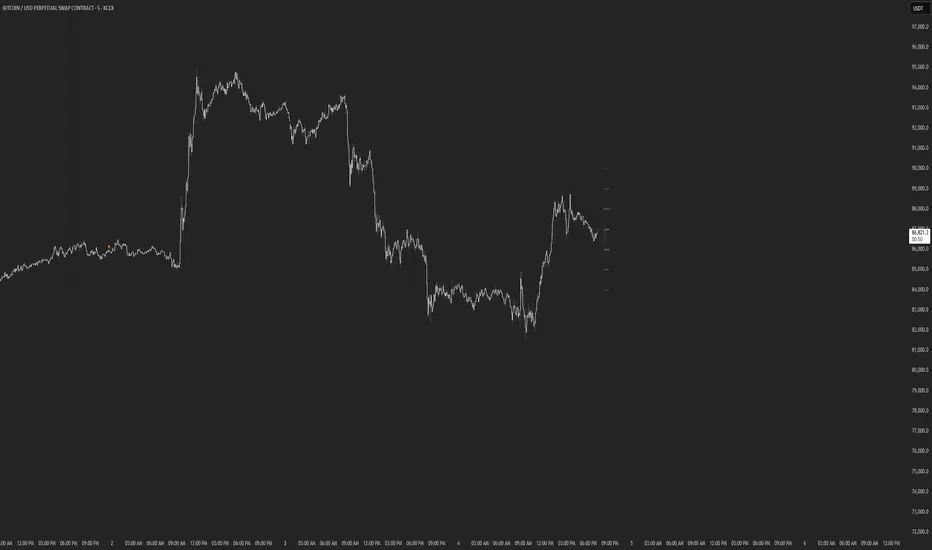
Price AltimeterThis indicator should help visualize the price, inspired by a Digital Altimeter in a Pilots HUD.
It's by default calibrated to Bitcoin, with the small levels showing every $100 and the larger levels setup to display on every $1000. But you can change this to whatever you want by changing the settings for: Small and Large Level Increments.
The default colors are grey, but can be changed to whatever you want, and there are two cause if you want they work as a gradient.
There are options to fade as the values go away from the current price action.
There are options for Forward and Backward Offsets, 0 is the current price and each value represents a candle on whatever time frame your currently on.
Other Options include the Fade Ratio, the Line Width and Style, which are all self explanatory.
Hope you Enjoy!
Backtest it in fast mode to see it in action a little better...
Known Issues:
For some reason it bug's out when either or are displaying more than 19 lines, unsure why so its limited to that for now.
Extra Note on what this may be useful for: I always wanted to make this, but didn't realize how to put things in front of the price action... Offset! Duh! Anyways, I thought of this one because I often it's hard on these charts to really get an idea for absolute price amounts across different time frames, this in an intuitive, at a glance way to see it because the regular price thing on the right always adds values between values when you zoom in and you can sometimes get lost figuring out the proportions of things.
Could also be useful for Scalping?
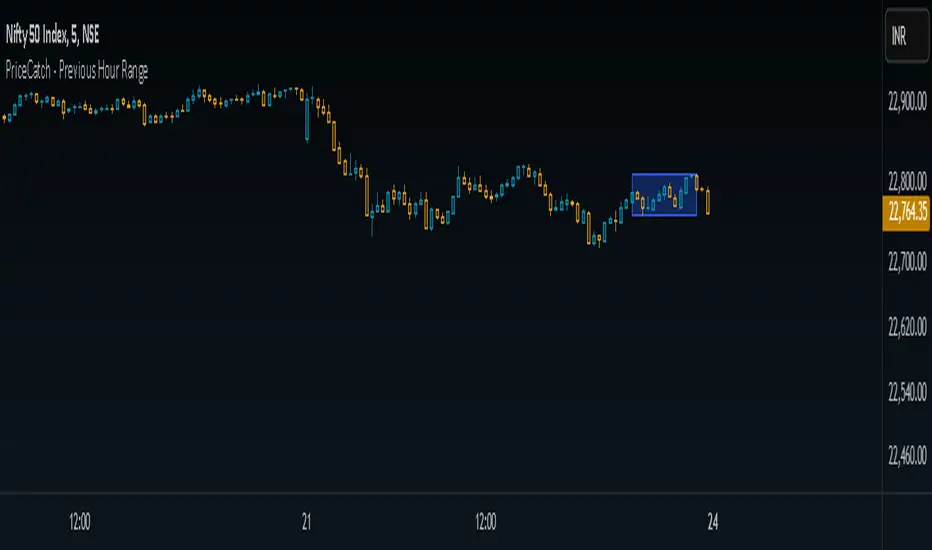
PriceCatch - Previous Hour RangeHi Tradingview community,
Recently I stumbled upon a video on Youtube where the Youtuber was talking about Intraday trading based on 1 hour price range.
Anyone requesting the code was asked to contact over email for the code. So, I thought, this is such a simple script and has no special complex coding involved and why such a show off instead of just sharing it.
So, I decided to write the code myself and it took me under 10 minutes to do it. So, here's the PriceCatch - Previous Hour Range script. It is open source, so you can check it and apply it in your trading strategy.
Remember, this is just a simple range plotter and does not give any signals.
If you want 2 hours range, then simply change 60 to 120. Simple.
So, all the best with your trades.
PriceCatch
Static price-range projection by symbolThis indicator shows you a predefined range to the right of the last candle of your chart. This range is custom and can be changed for a handful of symbols that you can choose. This scale will help you determining if the market is providing a reasonable range before you enter a trade or if the market isn't actually moving as much as you might think. This is particularly useful if you are into scalping and have to consider commission or spread in your trades.
Since all symbols have different price ranges in which they move this indicator doesn't make sense to just have "a one size fits all" approach. That's why you can choose up to 6 symbols and set the range that you want to have shown for each when you pull it up on the chart. Using my default values that means for when the NQ (Nasdaq future) is on the chart you will see a range of 20 handles projected. When you change the the ES (S&P500 future) you will instead see 5 handles. While the number is different that is somewhat of an equal move in both symbols.
There also is an option to set a default price range for all other symbols that are not selected if it is needed. However the display of the scale on anything else than the 6 selected symbols can also be turned off.
There are options provided on how exactly you want to indicator to determine if the chart symbol matches one of the selected symbols.
You can enable it to make sure the exchange/broker is the exact same as selected.
It can check for only the symbol root to match the selection. Specifically for futures this means that while ES1! might be selected, anything ES (ES1!, ES2!, ESH2025, ESM2025, ESM2022, ...) will be a match to the selection)
On the painted scale it is possible to not just show this range extended into each direction once. Per default you will have 3 segments of it in each direction. This can be reduced to just 1 or increased.
If you chose a high number of segments or a large range make sure to use the "Scale price chart only" option on your chart scale to not have the symbols price candles squished together by the charts auto scaling.
And last but not least the indicator options provide some possibilities to change the appearance of the printed price range scale in case you disagree with my design.

Multi-Timeframe RangeThe Multi-Timeframe Range Indicator is designed for traders looking to monitor key price levels across various timeframes (Daily, Weekly, Monthly, Quarterly, and Yearly) directly on their charts. This indicator draws boxes and mid-lines for each timeframe’s high, low, and midpoint, enabling users to visualize price ranges and assess potential areas of support and resistance more effectively.
Features:
Dynamic Range Boxes: Displays the high, low, and midpoint levels for each specified timeframe, with customizable colors for easy differentiation.
Visual Cues for Monday’s Levels: Highlights Monday’s high, low, and midpoint levels each week to support intraday trading setups and weekly trend analysis.
Multi-Timeframe Flexibility: Easily toggle between timeframes to view ranges from daily to yearly, making this indicator suitable for both short-term and long-term traders.
Ideal Use Cases:
Identify key support and resistance zones based on multiple timeframes.
Assess weekly and monthly trends using the Monday range levels.
Gain insights into market structure across various timeframes.

Delayed Opening Price Line with GuardrailsThis Delayed Opening Price Line with Guardrails indicator will draw 5 price level lines on the chart each day, beginning at the open of the first candle after a delay period specified by the user in the indicator settings. The default delay is 30 minutes from market open.
The lines are drawn at the open price of the first candle after the delay period, and then a specified increment above and below that price level. These increments default to 80 and 100, and can be adjusted in the indicator settings.
Most markets, indices, and equities have a finite and consistent range of price movement within a trading day. Eg. a particular stock may usually move no more that $50 up or down in a given day, which can be proven by looking at a historical chart. This indicator allows the user to quickly display that range on the chart once it's been defined.
Important note: This indicator is designed to be used on an intra-day chart - eg. minutes, or hourly. It will give an error if used on a longer time-frame chart.

Range SlicerThis is a tool I quickly put together to work along side of my round number and Quarter Theory Scripts. This script allows you to set a price range between to values and slice them up into equal price zones. Happy Trading!
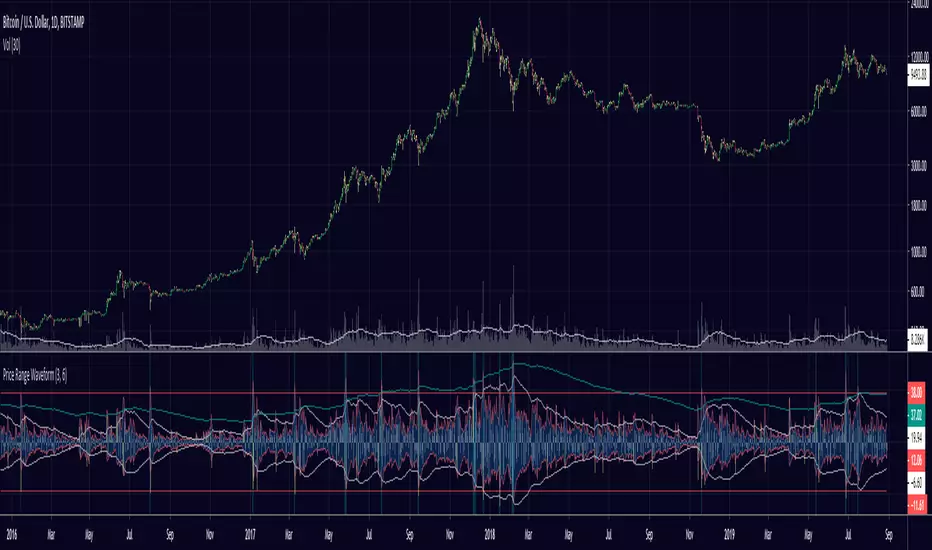
lefrog_Price Range WaveformThe Price Range Waveform calculated the difference from the open to close in percentage based.
The "Critical Range" input field lets you calibrate the zone above which a background color will be triggered.
Very useful in evaluating price expansion/contraction cycles and probable bottoms.
Works on any ticker and any timeframe.
Modification of the "Critical Range" default value may be mandatory.