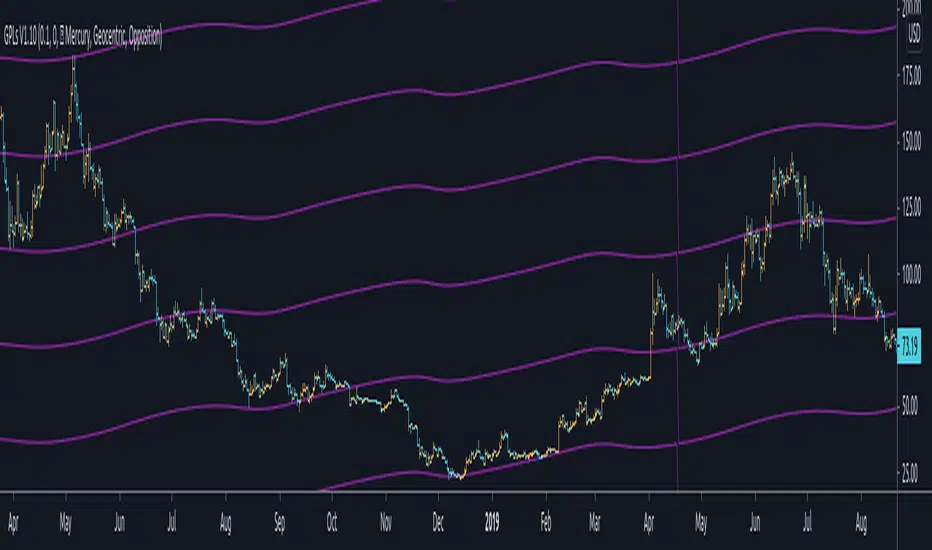
Gann Planetary Lines█ OVERVIEW
Gann Planetary Lines is one of the most powerful Gann Tools that converts planetary longitude angles into price. This script can be used in many different ways, methods, and trading systems.
This Script allows you to Plot Mercury, Venus, Mars, Jupiter, Saturn, Uranus, Neptune, and Pluto. While also allowing you to select the planetary line mode "Heliocentric" or "Geocentric"
One more important feature about this script. It also allows you to plot in the harmonics of these planetary lines : "Wheel of 24" ,"Semi-Sextile", "Semi-Square", "Sextile", "Quintile", "Square", "Trine", and "Opposition "
And of course you will be able to select the color of each one of the planets when it comes to styling.
One more important thing to mention, Yes you will be able to select the $/° value so you can square these lines perfectly in your chart!
█ Future Plans and upgrades to this script may include :
1. Further lines into the futures.
2. An option to Enable and Disable the 0° vertical line when the planet transition from 360° to 0°
3. Labels around the planetary lines to distinguish between them not only by color by text as well.
And more! Feel free to contact me with any feature that you would like to see in this script
█ How to use :
First of all, select the appropriate $/° value.
Then select the planet you would like to use from the list in the script's option.
Select the mode of the planet, "Heliocentric" or "Geocentric"
Make sure to enable the planet by clicking on the check mark.
Then you will be able to see these planets on your chart.
Additionally, I have included an option to add the harmonics to your planetary lines!
Simply select the harmonics that you would like to have and give it 10 seconds and it should be in your chart.
This script is coded as an addon to the Gann ToolBox package/scripts.
Planets
Gann Toolbox V2// ========================================================================//
This script is meant to help you save a lot of time plotting your Gann Boxes and Cycles correctly and accurately.
This is a recoded version of "Gann ToolBox V1.5/1.7"
This script allows you to scale your boxes and square them with a simple input in the script's settings "$ per degree".
It includes a few default cycles already built into it ( March and September ) and an advance mode that lets you place the box anywhere you want and create your own custom cycle. through any time period you want.
You get the 1:1, 1:2, 2:1 Gann fan angles at each corner of the box and some additional angles at the midpoint to give you a complete star formation.
Using the Advance mode you can also adjust the length of your custom cycle and the global height increments. Default is 360degrees.
You can also play with the offset values for your cycles.
That's not all, you also get to plot your horizontal lines between each cycle at an increment of your choosing.
Using this script you will be able to plot any cycle that you want with a few clicks & and a few seconds.
in the advance more you could extend the advance custom cycle to engulf future price action.
This script work with all the assets correctly and beautifully from Stocks to Crypto-Currencies.
// ========================================================================//
This script comes with "Gann Seasonal Dates, Gann Planets vs Sun, Moon at Zero" as addons if you decide to purchase it.
// ========================================================================//
My contact information are available and listed below.
Enjoy!

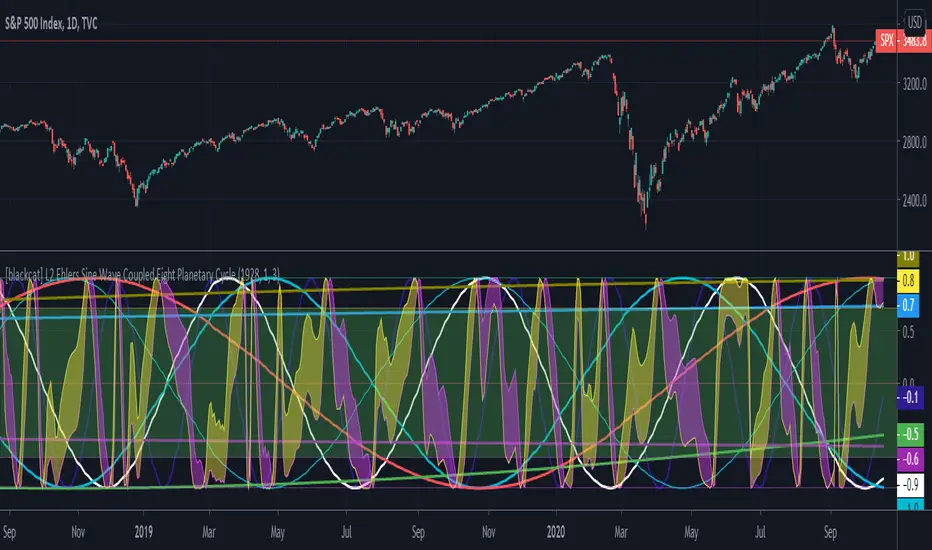
[blackcat] L2 Ehlers Sine Wave Coupled Eight Planetary CycleLevel: 2
Background
Have you considered that factors outside the Earth will be related to macro market trends? Let’s discuss the relationship between the planetary movement in the Galaxy and the market movement on Earth today! Although I said that, you may have laughed out in front of the screen, but the calculations in this script are entirely based on astronomical data and mathematical relationships.
Your next question may be why you compare the movements of the eight planets and the laws of the market on the earth together? My answer comes from a Cybernetic Sine Wave indicator proposed by Dr. John F. Ehlers.
Function
L2 Ehlers Sine Wave Coupled Eight Planetary Cycle first converts the astronomical data of the eight major planets into planetary aspects/phases through mathematical relationships. Planetary aspects/phases can provide the historical and current relative positions of each planet in the mathematical triangle relationship. We can use a simple mathematical sine formula to constrain the planet's trajectory between -1 and 1, which is what we often call a sine wave.
The relationship between the sine wave and the market can be extracted from the theory of John F. Ehlers. In Ehlers' theory, market price can be modeled by the trend and cycle modes. And in his works, there are many indicators of how to completely remove the trend in the market price and only leave the cycle mode data. The Cybernetic Sine Wave indicator is exactly the cycle mode data after the market trend is stripped, and expressed in the form of a sine wave.
If you can read to here with patience, you must also be aware of the premise that the trajectories of the eight planets and the laws of the earth market can be coupled: the trajectory of the sine wave mode. Therefore, this indicator is a tool for comparing and analyzing the two in the same chart. I hope you like it.
Finally, in order to benchmark the trajectories of the eight planets and the specific market on the earth, a starting point in time is particularly important. This is the base date of the market index to be analyzed. It is the year, month, and day data specified by the index, which needs to be input by the user when analyzing a specific stock index. For example, the base date of the S&P 500 index is January 3, 1928. This date needs to be entered into the indicator to analyze the SPX500.
Key Signal
Mercury_trail ---> smoothed Mercury orbit sine wave
Venus_trail ---> smoothed Venus orbit sine wave
Earth_trail ---> smoothed Earth orbit sine wave
Earth_mirror ---> smoothed Earth mirrored orbit sine wave
Mars_trail ---> smoothed Mars orbit sine wave
Jupiter_trail ---> smoothed Jupiter orbit sine wave
Saturn_trail ---> smoothed Saturn orbit sine wave
Uranus_trail ---> smoothed Uranus orbit sine wave
Neptune_trail ---> smoothed Neptune orbit sine wave
Aspect 0, 45, 90, 225, 270 deg ---> key planet aspects
ehlersine ---> Ehlers Cybernetic Sine Wave
ehlerslsine ---> Ehlers Cybernetic Lead Sine Wave
Pros and Cons
This is a technical indicator that I have come up with on a whim, and the laws of planetary operation and the operation of the Earth market are still being explored. Hope that interested friends will share your new discoveries.
Remarks
To celebrate I released the 50th technical indicator script on TV!
Courtesy of @sal157011 John Ehlers "Cybernetic Sine Wave" indicator, I converted it from pine v2 to pine v4 in this script.
Readme
In real life, I am a prolific inventor. I have successfully applied for more than 60 international and regional patents in the past 12 years. But in the past two years or so, I have tried to transfer my creativity to the development of trading strategies. Tradingview is the ideal platform for me. I am selecting and contributing some of the hundreds of scripts to publish in Tradingview community. Welcome everyone to interact with me to discuss these interesting pine scripts.
The scripts posted are categorized into 5 levels according to my efforts or manhours put into these works.
Level 1 : interesting script snippets or distinctive improvement from classic indicators or strategy. Level 1 scripts can usually appear in more complex indicators as a function module or element.
Level 2 : composite indicator/strategy. By selecting or combining several independent or dependent functions or sub indicators in proper way, the composite script exhibits a resonance phenomenon which can filter out noise or fake trading signal to enhance trading confidence level.
Level 3 : comprehensive indicator/strategy. They are simple trading systems based on my strategies. They are commonly containing several or all of entry signal, close signal, stop loss, take profit, re-entry, risk management, and position sizing techniques. Even some interesting fundamental and mass psychological aspects are incorporated.
Level 4 : script snippets or functions that do not disclose source code. Interesting element that can reveal market laws and work as raw material for indicators and strategies. If you find Level 1~2 scripts are helpful, Level 4 is a private version that took me far more efforts to develop.
Level 5 : indicator/strategy that do not disclose source code. private version of Level 3 script with my accumulated script processing skills or a large number of custom functions. I had a private function library built in past two years. Level 5 scripts use many of them to achieve private trading strategy.
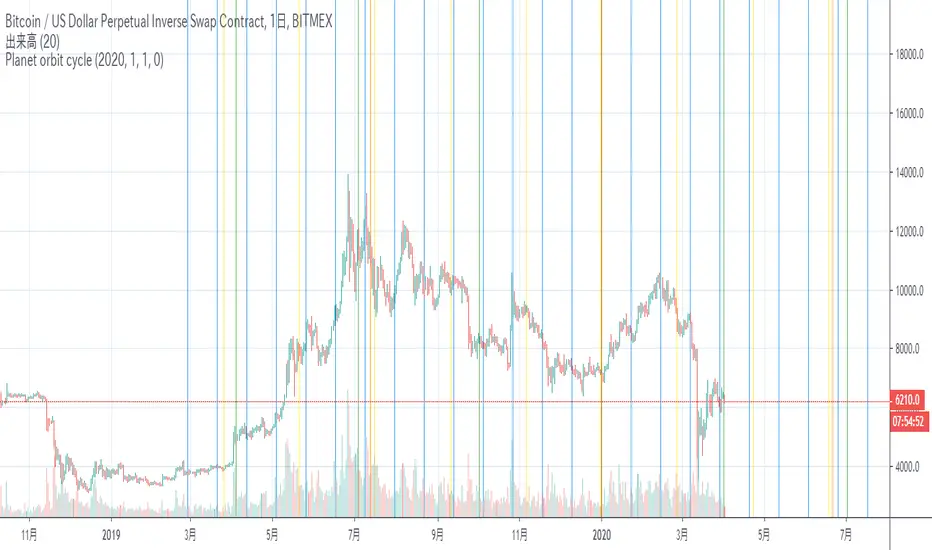
Planet orbit cyclePlanet orbit cycle Line
惑星の公転周期
Bulu Line : MERCUR
青:水星
Yellow Line : VENUS
黄色:金星
Green Line : EARTH
緑:地球
Orange Line : MSRS
オレンジ:火星
A line that divides one lap into four
1周を4分割したライン
Astraea: Plantary Line Indicator (BennuQuants.net]BennuQuants presents:
Astrea: The Planetary Longitudinal Indicator
DOCUMENTATION: bennuquants.net
"Astraea is our version Gann’s planetary line indicator, and shows the longitude of a given planet. These lines can be used as harmonic pivot points. This is the first and only astro trading instrument available on TradingView at this time.
As a disclaimer, this is one of the most intensive indicators and areas we have found to in TA. We cannot determine the probability of success with any of these systems, but are providing the framework with which to find profitable systems. This system has been back tested against other experts and works in the same manner, bringing Astrotrading to TradingView for the first time."
This indicator was created from replicating and improving upon Gann based techniques which were somewhat hidden in nearly 1000 pages of writing and text. We strongly recommend reading the books found at the back of the documenation.
If you want a 7-day free trial, please join the Discord. There will also be a new channel available to astro-traders who are interested in learning more about Gann and harmonic trading. The asking price for the indicator currently is $100. If you have financial issues or a proposal, please feel free to reach out. If the quantity is an issue and you wish to make a charitable donation, that is also an option.
Legal Disclaimer: By using this indicator you agree that BennuQuants is not liable for any losses that may occur while trading financial assets. Trading is a risky endeavor and losses may occur. Your decisions are your own.
You are entitled to a copy of Astraea as long as TradingView as a platform exists. If for any unseen reason the hosting account is banned, we will restore access as soon as possible. If you are transferring TradingView accounts, we will work with you to assist the transition process.
More information can be found here: bennuquants.net
