Zig Zag with HHLLThis powerful tool calculates and displays two Zig Zag patterns simultaneously while dynamically identifying key market structure points—Higher Highs (HH), Lower Lows (LL), Higher Lows (HL), and Lower Highs (LH).
Because the script is dynamic, the most recent HH, HL, LL, or LH can update in real-time as price action evolves. For example, if the price continues to rise, a previously marked HL may be reclassified as an LL. Likewise, a falling LH may later turn into a HH if the market reverses.
This script is versatile and can be applied to various trading strategies, including trend analysis, support and resistance identification, breakout setups, and more.
Added a new input parameter decimals that allows you to control the decimal precision:
Set to -1 (default) for automatic detection based on the symbol's minimum tick size
Set to 0-8 for a specific number of decimal places.
How it works:
Auto mode (decimals = -1): The script automatically determines how many decimal places to show based on the instrument's minimum tick size. For example:
Forex pairs (0.00001) → 5 decimals
Stocks ($0.01) → 2 decimals
Crypto (0.00000001) → 8 decimals
Manual mode (decimals = 0-8): You can force a specific number of decimal places if needed
Punkty Pivota i Poziomy

Current Hourly Open Liquidity with Sweep DetectionStatistics indicate that if the current hourly candle reaches the high or low of the previous hourly candle, there is a strong likelihood that the price will return to the current hour's open, depending on how quickly the previous hour's high or low was swept. If the sweep occurs within the first 20 minutes, there is a 75% chance the current hour's open will be reached; if it takes between 21 and 40 minutes, the probability decreases to 50%; and if it takes longer than 41 minutes, the chance drops to 25%.
These statistics can help identify manipulation on the hourly timeframe and guide trade decisions accordingly. For instance, if the previous hourly high is taken within the first 20 minutes but the current hour's open is not reached, it may be wise to avoid long positions until it happens or consider short positions in the direction of the open liquidity, using your existing entry rules and risk management.
The indicator highlights the current hour's open with a line and label to visually represent that liquidity pool, adjusting the line's color based on whether and when the previous hour's high or low was tapped. Once the open is reached, the indicator can, depending on settings, remove the line and label from the chart (this is enabled by default) since the liquidity pool is no longer relevant, preventing chart clutter.
All colors, line widths, label text sizes, and colors can be customized.

Larry Williams's Market Structure
Here is a Pine script based on Larry Williams' market structure model.
Note: When processing real-time ticks, heavy calculations can cause script errors. To prevent this, please adjust the script's data range accordingly.
As I'm not an expert in Pine Script, there may be some imperfections. Your understanding is appreciated.
I have great admiration for the wisdom of Larry Williams.
May the trend be with you.

SMT Divergence x outofoptions🔍 SMT Divergence — Advanced Market Correlation Analysis
This was created with and approved by @outofoptions to bring you smaller SMTs based on his original SMT Divergence indicator
SMT Divergence is a sophisticated technical analysis indicator designed to identify high-probability reversal and continuation signals through intelligent correlation analysis between related markets. This powerful tool reveals hidden market dynamics by comparing price action divergences across correlated instruments, providing traders with institutional-level market insight.
🎯 Core Capabilities:
Multi-Market Analysis : Automatically compares your chart with a correlated instrument to identify divergence patterns and market inefficiencies
Smart Liquidity Detection : Advanced algorithms identify key liquidity levels and sweep patterns for enhanced signal accuracy
Dynamic Divergence Mapping : Real-time visualization of bullish and bearish divergences with customizable line styles and colors
Intelligent Signal Validation : Optional candle-based confirmation system to filter high-probability setups from noise
Automated Line Management : Smart removal of invalidated divergences to maintain clean, actionable chart analysis
📊 Professional Features:
The SMT Divergence indicator excels at revealing market structure imbalances that often precede significant price movements. By analyzing the relationship between correlated markets, it identifies when institutional money may be positioned differently than retail sentiment suggests, providing early warning signals for potential reversals.
⚙️ Advanced Customization:
Flexible correlation pair selection for any market combination
Customizable visual styling with multiple line types and color schemes
Adjustable validation criteria for different trading styles
Professional alert system with detailed message customization
Automatic cleanup of broken or invalidated divergences
🎨 Visual Excellence:
Clean, professional line drawing with customizable styling
Dynamic labeling system with size and color options
Real-time divergence tracking and management
Institutional-grade chart presentation
Optimized performance for extended analysis periods
📈 Ideal For:
Swing traders seeking high-probability reversal signals
Multi-market analysts comparing correlated instruments
Institutional-style traders using correlation analysis
Advanced technical analysts studying market structure
Those seeking early warning signals for trend changes
🔔 Smart Alerts:
Comprehensive alert system with customizable messaging allows you to stay informed of new divergences across multiple timeframes and market sessions, ensuring you never miss critical market developments.
💡 Market Intelligence:
SMT Divergence transforms complex inter-market relationships into clear, actionable signals, giving you the same analytical edge used by professional trading institutions to identify market turning points before they become obvious to retail traders.
Educational Tool: This indicator is designed for educational and analytical purposes. Divergence analysis requires understanding of market correlation principles. Always combine with proper risk management and additional analysis methods.

SMC XAU/USD Pro✅ Structure filter: Only BUY if the price is above the last bullish BOS, and SELL if it is below the last bearish BOS.
✅ Significant candle body: At least 40% of the range to avoid weak signals.
✅ Boxes limited to 3 per type (old ones automatically cleared).
✅ Visual display of Take Profit and Stop Loss with green and red dashed lines.
✅ Clear BUY/SELL signals with visible labels.

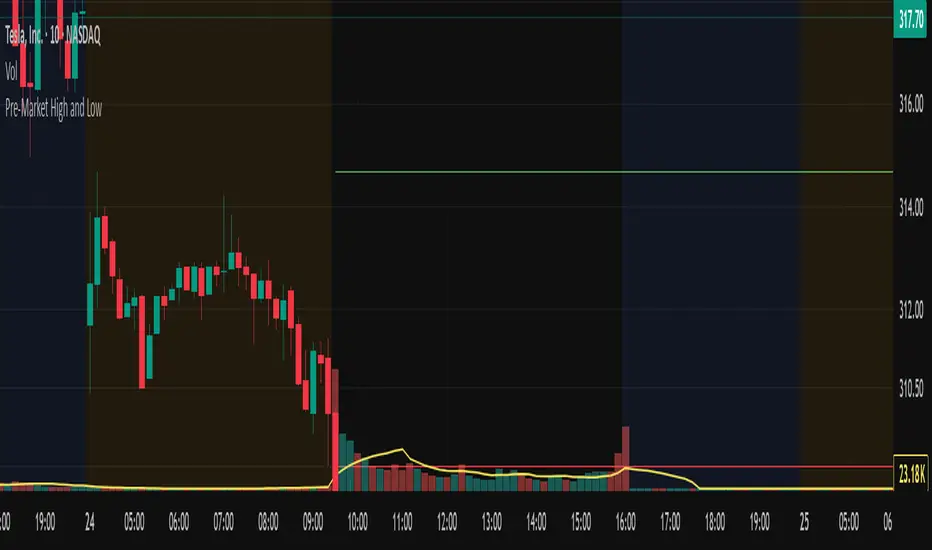
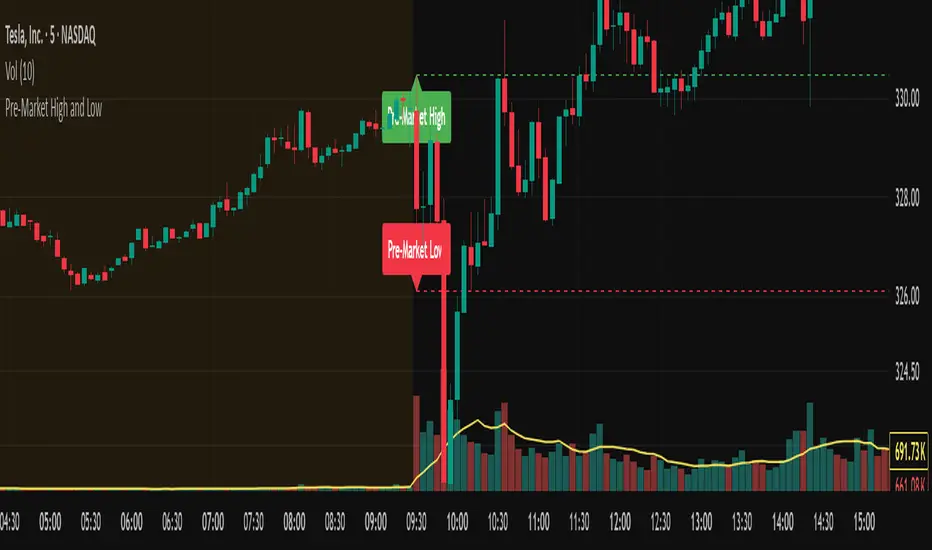
Pre-Market High and LowThis Pine Script indicator automatically plots the pre-market high and low price levels for each trading day, helping traders identify key support and resistance zones based on pre-market activity. Designed for stocks and other assets with pre-market sessions, it draws horizontal lines at the pre-market high and low prices at the regular market open (9:30 AM EST) and resets automatically at the start of each new trading day.
Features:
Automatic Daily Reset: Tracks pre-market highs and lows without requiring manual date changes.
Customizable Timeframe: Set your preferred pre-market session (default: 4:00 AM to 9:30 AM EST).
Flexible Styling: Choose line styles (Solid, Dashed, Dotted) and colors for high/low lines.
Adjustable Panel Size: Control how far the lines extend across the chart (default: 50 bars).
Optional Labels: Toggle labels to display "Pre-Market High" and "Pre-Market Low" at the market open.
Overlay Display: Lines and labels are plotted directly on the price chart for easy reference.
Custom Opening TimesThis indicator displays custom opening levels on your chart. Define multiple opening times, each with its own customizable style. Display these levels as horizontal lines at the opening price, or as vertical lines to mark the opening time.
Custom Opening Times
4 Independent Groups with 4 custom opening levels each
Set any custom opening time (displayed in New York Local Time)
Choose between Opening Price lines, Vertical time markers, or Both
Cutoff Times: Stop extending lines after specified times
Higher Timeframe Levels
5 Configurable HTF levels supporting any timeframe
Display opening prices from Daily, Weekly, Monthly, Quarterly, and custom timeframes
Show Previous High/Low levels from higher timeframes

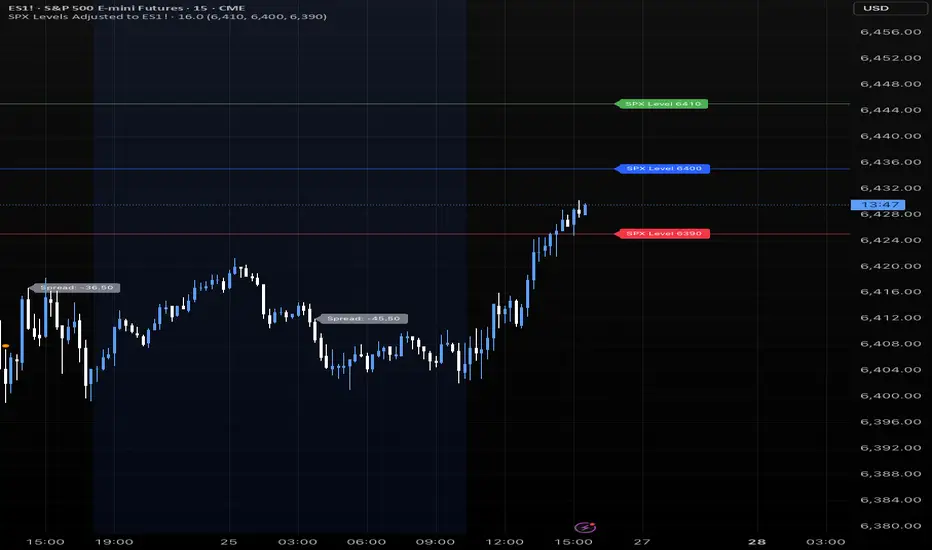
SPX Levels Adjusted to ES1!This indicator allows you to plot custom SPX levels directly on the ES1! (E-mini S&P 500 Futures) chart, automatically adjusting for the spread between SPX and ES1!. This is particularly useful for traders who perform technical analysis on SPX but execute trades on ES1!.
Features:
Input up to three SPX key levels to track (e.g., 5000, 4950, 4900)
The script adjusts these levels in real-time based on the current spread between SPX and ES1!
Displays the spread in the chart header for quick reference
Plots updated horizontal lines that move with the spread
Includes optional labels showing the spread periodically to reduce clutter
Ideal for futures traders who want SPX context while trading ES1!.
Make sure to apply this indicator on the ES1! chart, not SPX.
Choch Pattern Levels [BigBeluga]🔵 OVERVIEW
The Choch Pattern Levels indicator automatically detects Change of Character (CHoCH) shifts in market structure — crucial moments that often signal early trend reversals or major directional transitions. It plots the structural break level, visualizes the pattern zone with triangle overlays, and tracks delta volume to help traders assess the strength behind each move.
🔵 CONCEPTS
CHoCH Pattern: A bullish CHoCH forms when price breaks a previous swing high after a swing low, while a bearish CHoCH appears when price breaks a swing low after a prior swing high.
Break Level Mapping: The indicator identifies the highest or lowest point between the pivot and the breakout, marking it with a clean horizontal level where price often reacts.
Delta Volume Tracking: Net bullish or bearish volume is accumulated between the pivot and the breakout, revealing the momentum and conviction behind each CHoCH.
Chart Clean-Up: If price later closes through the CHoCH level, the zone is automatically removed to maintain clarity and focus on active setups only.
🔵 FEATURES
Automatic CHoCH pattern detection using pivot-based logic.
Triangle shapes show structure break: pivot → breakout → internal high/low.
Horizontal level marks the structural zone with a ◯ symbol.
Optional delta volume label with directional sign (+/−).
Green visuals for bullish CHoCHs, red for bearish.
Fully auto-cleaning invalidated levels to reduce clutter.
Clean organization of all lines, labels, and overlays.
User-defined Length input to adjust pivot sensitivity.
🔵 HOW TO USE
Use CHoCH levels as early trend reversal zones or confirmation signals.
Treat bullish CHoCHs as support zones, bearish CHoCHs as resistance.
Look for high delta volume to validate the strength behind each CHoCH.
Combine with other BigBeluga tools like supply/demand, FVGs, or liquidity maps for confluence.
Adjust pivot Length based on your strategy — shorter for intraday, longer for swing trading.
🔵 CONCLUSION
Choch Pattern Levels highlights key structural breaks that can mark the start of new trends. By combining precise break detection with volume analytics and automatic cleanup, it provides actionable insights into the true intent behind price moves — giving traders a clean edge in spotting early reversals and key reaction zones.

KEY MARKET SESSION EU/US RANGE LEVELS - KLT🔹 KEY MARKET SESSION EU/US RANGE LEVELS - KLT
This indicator highlights critical trading levels during the European and U.S. sessions, with Overbought (OB) and Oversold (OS) markers derived from each session's price range.
It’s designed to support traders in identifying key zones of interest and historical price reactions across sessions.
✳️ Features
🕒 Session Recognition
European Session (EU): 08:00 to 14:00 UTC
United States Session (US): 14:30 to 21:00 UTC
The indicator automatically detects the current session and updates levels in real time.
📈 Overbought / Oversold (OB/OS) Levels
Helps identify potential reversal or reaction zones.
🔁 Previous Session OB/OS Crosses
OB/OS levels from the previous session are plotted as white crosses during the opposite session:
EU OB/OS shown during the US session
US OB/OS shown during the EU session
These levels act as potential price targets or reaction areas based on prior session behavior.
🎨 Session-Based Color Coding
EU Session
High/Low: Orange / Fuchsia
OB/OS: Orange / Lime
Previous OB/OS: White crosses during the US session
US Session
High/Low: Aqua / Teal
OB/OS: Aqua / Lime
Previous OB/OS: White crosses during the EU session
🧠 How to Use
Use the OB/OS levels to gauge potential turning points or extended moves.
Watch for previous session crosses to spot historically relevant zones that may attract price.
Monitor extended High/Low lines as potential magnets for price continuation.
🛠 Additional Notes
No repainting; levels are session-locked and tracked in real time.
Optimized for intraday strategies, scalping, and session-based planning.
Works best on assets with clear session behavior (e.g., forex, indices, major commodities).

Trend Buy/Sell Fibonacci Range - KLTThe Trend Buy/Sell Fibonacci Range – KLT indicator identifies bullish and bearish trends based on where the closing price is located within a Fibonacci range calculated from the last N candles (default is 10). Instead of analyzing individual candles, this tool takes a broader view of price action using Fibonacci retracement levels across a dynamic multi-candle range.
How It Works:
Range Calculation
The indicator calculates the highest high and lowest low over the last N candles to define the active price range (default: 10 bars).
Fibonacci Levels
Within this range, Fibonacci levels (0.236, 0.382, 0.5, 0.618, 0.786) are dynamically computed. These levels act as internal thresholds to evaluate bullish or bearish pressure.
Trend Identification (via Close Position):
If the closing price is above the 0.618 level, it indicates strong buy pressure → the candle turns green and an upward triangle appears.
If the closing price is below the 0.382 level, it suggests strong sell pressure → the candle turns red and a downward triangle is displayed.
If the close lies between 0.382 and 0.618, the market is considered neutral, and the candle is gray.
Visual Elements:
Colored candles to immediately spot trend conditions.
Triangle signals (optional) for clear Buy/Sell markers.
Fibonacci level lines plotted on the chart for full context (can be toggled on/off).
Customization Options:
Lookback period (number of candles to calculate the range)
Fibonacci threshold levels (upper/lower)
Show/hide arrows and Fibonacci lines
Why Use This Indicator?
This tool is perfect for traders who want a simple visual method to assess trend strength based on price structure, not indicators derived from lagging moving averages. It offers:
Cleaner market structure analysis
Objective trend zones
Customizable sensitivity
Recommended Use:
Works well in conjunction with support/resistance zones, volume, or momentum indicators.
Applicable to any asset class or timeframe.
Credits:
Developed by KLT, combining structure-based logic with Fibonacci precision.

Pre-Market High and LowThis indicator automatically tracks and plots the daily pre-market high and low levels on your chart for U.S. stocks. It monitors the pre-market session from 4:30 AM to 9:30 AM Eastern Time (New York) and captures the highest and lowest prices during this period.
At exactly 9:30 AM ET, when the regular market opens, the indicator draws dashed horizontal lines representing the pre-market high and pre-market low, extending them forward for better visibility throughout the trading day.
Buyer/Seller Zone (Simplified Version)📌 Indicator: Buyer/Seller Zone (Simplified Version)
This indicator is designed to highlight potential areas of strong buyer or seller activity based on advanced volume and volatility analysis. It identifies key candles that exhibit anomalous behavior — those standing out from typical market noise — and marks them as potential interest zones.
🔍 What it does:
Detects candles with unusually high volume (anomalies).
Filters them further based on strong price movement (volatility).
Marks bullish and bearish zones using customizable visuals: area, circle, or diamond.
Provides optional alerts when a buyer/seller signal is detected.
💡 How to use:
Use this tool to identify potential reversal or continuation zones.
Zones may act as strong support/resistance areas.
Some levels are more significant than others — do not trade every level blindly. Combine with your own analysis or wait for a retest/confirmation before entry.
⚙️ Customization:
Volume filter threshold
Volatility sensitivity
Visualization type, size, and transparency
🚨 Alerts: Set alerts for bullish, bearish, or any signal type.

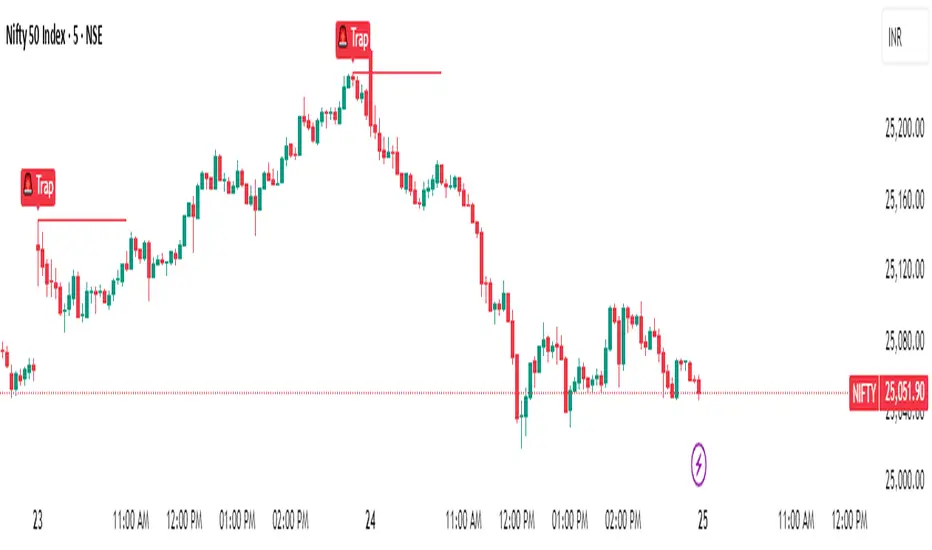
Magnet Zones: Trap Detection & Flow Map [@darshakssc]This script detects potential bull and bear trap candles—price actions that may appear strong but are likely to reverse—based on:
🔺 Wick structure
📊 Volume spike behavior
💡 RSI confirmation logic
⏳ Signal cooldown filter to reduce false positives
The indicator then plots:
🟥 Red “🚨 Trap” labels above candles showing possible bull traps
🟩 Green “🧲 Trap” labels below candles showing possible bear traps
➖ Horizontal zone lines to mark these trap levels as “magnet zones,” which may act as future support or resistance
🧠 How It Works:
1. Volume Spike Detection
2. The script first checks for unusually high volume (1.5× the average volume over the last 20 candles).
3. Trap Candle Structure
4. A trap is suspected when there is a long wick opposite the direction of the candle body, signaling a failed breakout or price manipulation.
5. RSI Confirmation
6. Bull Traps: RSI must be above 60
7. Bear Traps: RSI must be below 40
✅ This helps validate whether the price was overbought or oversold.
✅ Cooldown Mechanism
✅ After a trap is detected, it waits for 10 bars before allowing another signal—this reduces noise and overfitting.
✅ How to Use It:
1. Apply on any timeframe, especially effective for intraday trading (e.g. 5m, 15m, 1h).
2. Use the trap signals as early warnings to avoid fake breakouts.
3. Combine with your own strategy or trend-following system for confirmation.
4. The trap lines (magnet zones) can be used as dynamic support/resistance levels for future pullbacks or reversals.
⚠️ Important Note:
This script is for educational purposes only and is not financial advice.
Always use traps in combination with your personal discretion, risk management, and other confluence tools.
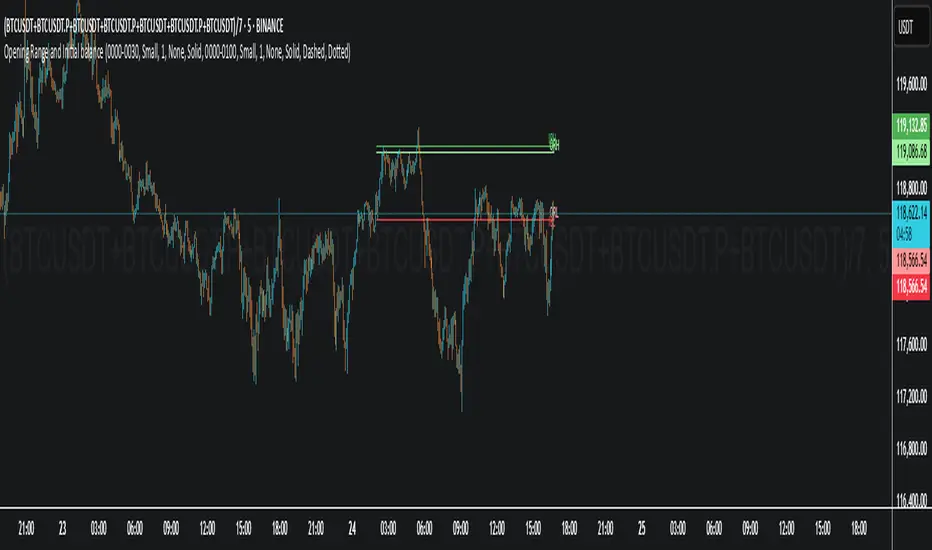
Opening Range and Initial balanceThis indicator represents Opening Range and Initial Balance levels.
Opening Range represents the high and low established during the first few minutes of the trading session — usually 5, 15 or 30 minutes.
Initial Balance represents the high and low established during the first hour of the trading session.
Reversal Point Dynamics⇋ Reversal Point Dynamics (RPD)
This is not an indicator; it is a complete system for deconstructing the mechanics of a market reversal. Reversal Point Dynamics (RPD) moves far beyond simplistic pattern recognition, venturing into a deep analysis of the underlying forces that cause trends to exhaust, pause, and turn. It is engineered from the ground up to identify high-probability reversal points by quantifying the confluence of market dynamics in real-time.
Where other tools provide a static signal, RPD delivers a dynamic probability. It understands that a true market turning point is not a single event, but a cascade of failing momentum, structural breakdown, and a shift in market order. RPD's core engine meticulously analyzes each of these dynamic components—the market's underlying state, its velocity and acceleration, its degree of chaos (entropy), and its structural framework. These forces are synthesized into a single, unified Probability Score, offering you an unprecedented, transparent view into the conviction behind every potential reversal.
This is not a "black box" system. It is an open-architecture engine designed to empower the discerning trader. Featuring real-time signal projection, an integrated Fibonacci R2R Target Engine, and a comprehensive dashboard that acts as your Dynamics Control Center , RPD gives you a complete, holistic view of the market's state.
The Theoretical Core: Deconstructing Market Dynamics
RPD's analytical power is born from the intelligent synthesis of multiple, distinct theoretical models. Each pillar of the engine analyzes a different facet of market behavior. The convergence of these analyses—the "Singularity" event referenced in the dashboard—is what generates the final, high-conviction probability score.
1. Pillar One: Quantum State Analysis (QSA)
This is the foundational analysis of the market's current state within its recent context. Instead of treating price as a random walk, QSA quantizes it into a finite number of discrete "states."
Formulaic Concept: The engine establishes a price range using the highest high and lowest low over the Adaptive Analysis Period. This range is then divided into a user-defined number of Analysis Levels. The current price is mapped to one of these states (e.g., in a 9-level system, State 0 is the absolute low, and State 8 is the absolute high).
Analytical Edge: This acts as a powerful foundational filter. The engine will only begin searching for reversal signals when the market has reached a statistically stretched, extreme state (e.g., State 0 or 8). The Edge Sensitivity input allows you to control exactly how close to this extreme edge the price must be, ensuring you are trading from points of maximum potential exhaustion.
2. Pillar Two: Price State Roc (PSR) - The Dynamics of Momentum
This pillar analyzes the kinetic forces of the market: its velocity and acceleration. It understands that it’s not just where the price is, but how it got there that matters.
Formulaic Concept: The psr function calculates two derivatives of price.
Velocity: (price - price ). This measures the speed and direction of the current move.
Acceleration: (velocity - velocity ). This measures the rate of change in that speed. A negative acceleration (deceleration) during a strong rally is a critical pre-reversal warning, indicating momentum is fading even as price may be pushing higher.
Analytical Edge: The engine specifically hunts for exhaustion patterns where momentum is clearly decelerating as price reaches an extreme state. This is the mechanical signature of a weakening trend.
3. Pillar Three: Market Entropy Analysis - The Dynamics of Order & Chaos
This is RPD's chaos filter, a concept borrowed from information theory. Entropy measures the degree of randomness or disorder in the market's price action.
Formulaic Concept: The calculateEntropy function analyzes recent price changes. A market moving directionally and smoothly has low entropy (high order). A market chopping back and forth without direction has high entropy (high chaos). The value is normalized between 0 and 1.
Analytical Edge: The most reliable trades occur in low-entropy, ordered environments. RPD uses the Entropy Threshold to disqualify signals that attempt to form in chaotic, unpredictable conditions, providing a powerful shield against whipsaw markets.
4. Pillar Four: The Synthesis Engine & Probability Calculation
This is where all the dynamic forces converge. The final probability score is a weighted calculation that heavily rewards confluence.
Formulaic Concept: The calculateProbability function intelligently assembles the final score:
A Base Score is established from trend strength and entropy.
An Entropy Score adds points for low entropy (order) and subtracts for high entropy (chaos).
A significant Divergence Bonus is awarded for a classic momentum divergence.
RSI & Volume Bonuses are added if momentum oscillators are in extreme territory or a volume spike confirms institutional interest.
MTF & Adaptive Bonuses add further weight for alignment with higher timeframe structure.
Analytical Edge: A signal backed by multiple dynamic forces (e.g., extreme state + decelerating momentum + low entropy + volume spike) will receive an exponentially higher probability score. This is the very essence of analyzing reversal point dynamics.
The Command Center: Mastering the Inputs
Every input is a precise lever of control, allowing you to fine-tune the RPD engine to your exact trading style, market, and timeframe.
🧠 Core Algorithm
Predictive Mode (Early Detection):
What It Is: Enables the engine to search for potential reversals on the current, unclosed bar.
How It Works: Analyzes intra-bar acceleration and state to identify developing exhaustion. These signals are marked with a ' ? ' and are tentative.
How To Use It: Enable for scalping or very aggressive day trading to get the earliest possible indication. Disable for swing trading or a more conservative approach that waits for full bar confirmation.
Live Signal Mode (Current Bar):
What It Is: A highly aggressive mode that plots tentative signals with a ' ! ' on the live bar based on projected price and momentum. These signals repaint intra-bar.
How It Works: Uses a linear regression projection of the close to anticipate a reversal.
How To Use It: For advanced users who use intra-bar dynamics for execution and understand the nature of repainting signals.
Adaptive Analysis Period:
What It Is: The main lookback period for the QSA, PSR, and Entropy calculations. This is the engine's "memory."
How It Works: A shorter period makes the engine highly sensitive to local price swings. A longer period makes it focus only on major, significant market structure.
How To Use It: Scalping (1-5m): 15-25. Day Trading (15m-1H): 25-40. Swing Trading (4H+): 40-60.
Fractal Strength (Bars):
What It Is: Defines the strength of the pivot detection used for confirming reversal events.
How It Works: A value of '2' requires a candle's high/low to be more extreme than the two bars to its left and right.
How To Use It: '2' is a robust standard. Increase to '3' for an even stricter definition of a structural pivot, which will result in fewer signals.
MTF Multiplier:
What It Is: Integrates pivot data from a higher timeframe for confluence.
How It Works: A multiplier of '4' on a 15-minute chart will pull pivot data from the 1-hour chart (15 * 4 = 60m).
How To Use It: Set to a multiple that corresponds to your preferred higher timeframe for contextual analysis.
🎯 Signal Settings
Min Probability %:
What It Is: Your master quality filter. A signal is only plotted if its score exceeds this threshold.
How It Works: Directly filters the output of the final probability calculation.
How To Use It: High-Quality (80-95): For A+ setups only. Balanced (65-75): For day trading. Aggressive (50-60): For scalping.
Min Signal Distance (Bars):
What It Is: A noise filter that prevents signals from clustering in choppy conditions.
How It Works: Enforces a "cooldown" period of N bars after a signal.
How To Use It: Increase in ranging markets to focus on major swings. Decrease on lower timeframes.
Entropy Threshold:
What It Is: Your "chaos shield." Sets the maximum allowable market randomness for a signal.
How It Works: If calculated entropy is above this value, the signal is invalidated.
How To Use It: Lower values (0.1-0.5): Extremely strict. Higher values (0.7-1.0): More lenient. 0.85 is a good balance.
Adaptive Entropy & Aggressive Mode:
What It Is: Toggles for dynamically adjusting the engine's core parameters.
How It Works: Adaptive Entropy can slightly lower the required probability in strong trends. Aggressive Mode uses more lenient settings across the board.
How To Use It: Keep Adaptive on. Use Aggressive Mode sparingly, primarily for scalping highly volatile assets.
📊 State Analysis
Analysis Levels:
What It Is: The number of discrete "states" for the QSA.
How It Works: More levels create a finer-grained analysis of price location.
How To Use It: 6-7 levels are ideal. Increasing to 9 can provide more precision on very volatile assets.
Edge Sensitivity:
What It Is: Defines how close to the absolute top/bottom of the range price must be.
How It Works: '0' means price must be in the absolute highest/lowest state. '3' allows a signal within the top/bottom 3 states.
How To Use It: '3' provides a good balance. Lower it to '1' or '0' if you only want to trade extreme exhaustion.
The Dashboard: Your Dynamics Control Center
The dashboard provides a transparent, real-time view into the engine's brain. Use it to understand the context behind every signal and to gauge the current market environment at a glance.
🎯 UNIFIED PROB SCORE
TOTAL SCORE: The highest probability score (either Peak or Valley) the engine is currently calculating. This is your main at-a-glance conviction metric. The "Singularity" header refers to the event where market dynamics align—the event RPD is built to detect.
Quality: A human-readable interpretation of the Total Score. "EXCEPTIONAL" (🌟) is a rare, A+ confluence event. "STRONG" (💪) is a high-quality, tradable setup.
📊 ORDER FLOW & COMPONENT ANALYSIS
Volume Spike: Shows if the current volume is significantly higher than average (YES/NO). A 'YES' adds major confirmation.
Peak/Valley Conf: This breaks down the probability score into its directional components, showing you the separate confidence levels for a potential top (Peak) versus a bottom (Valley).
🌌 MARKET STRUCTURE
HTF Trend: Shows the direction of the underlying trend based on a Supertrend calculation.
Entropy: The current market chaos reading. "🔥 LOW" is an ideal, ordered state for trading. "😴 HIGH" is a warning of choppy, unpredictable conditions.
🔮 FIB & R2R ZONE (Large Dashboard)
This section gives you the status of the Fibonacci Target Engine. It shows if an Active Channel (entry zone) or Stop Zone (invalidation zone) is active and displays the precise price levels for the static entry, target, and stop calculated at the time of the signal.
🛡️ FILTERS & PREDICTIVES (Large Dashboard)
This panel provides a status check on all the bonus filters. It shows the current RSI Status, whether a Divergence is present, and if a Live Pending signal is forming.
The Visual Interface: A Symphony of Data
Every visual element is designed for instant, intuitive interpretation of market dynamics.
Signal Markers: These are the primary outputs of the engine.
▼/▲ b: A fully confirmed signal that has passed all filters.
? b: A tentative signal generated in Predictive Mode, indicating developing dynamics.
◈ b: This diamond icon replaces the standard triangle when the signal is confirmed by a strong momentum divergence, highlighting it as a superior setup where dynamics are misaligned with price.
Harmonic Wave: The flowing, colored wave around the price.
What It Represents: The market's "flow dynamic" and volatility.
How to Interpret It: Expanding waves show increasing volatility. The color is tied to the "Quantum Color" in your theme, representing the underlying energy field of the market.
Entropy Particles: The small dots appearing above/below price.
What They Represent: A direct visualization of the "order dynamic."
How to Interpret Them: Their presence signifies a low-entropy, ordered state ideal for trading. Their color indicates the direction of momentum (PSR velocity). Their absence means the market is too chaotic (high entropy).
The Fibonacci Target Engine: The dynamic R2R system appearing post-signal.
Static Fib Levels: Colored horizontal lines representing the market's "structural dynamic."
The Green "Active Channel" Box: Your zone of consideration. An area to manage a potential entry.
Development Philosophy
Reversal Point Dynamics was engineered to answer a fundamental question: can we objectively measure the forces behind a market turn? It is a synthesis of concepts from market microstructure, statistics, and information theory. The objective was never to create a "perfect" system, but to build a robust decision-support tool that provides a measurable, statistical edge by focusing on the principle of confluence.
By demanding that multiple, independent market dynamics align simultaneously, RPD filters out the vast majority of market noise. It is designed for the trader who thinks in terms of probability and risk management, not in terms of certainties. It is a tool to help you discount the obvious and bet on the unexpected alignment of market forces.
"Markets are constantly in a state of uncertainty and flux and money is made by discounting the obvious and betting on the unexpected."
— George Soros
Trade with insight. Trade with anticipation.
— Dskyz, for DAFE Trading Systems

Smart MTF S/R Levels[BullByte]
Smart MTF S/R Levels
Introduction & Motivation
Support and Resistance (S/R) levels are the backbone of technical analysis. However, most traders face two major challenges:
Manual S/R Marking: Drawing S/R levels by hand is time-consuming, subjective, and often inconsistent.
Multi-Timeframe Blind Spots: Key S/R levels from higher or lower timeframes are often missed, leading to surprise reversals or missed opportunities.
Smart MTF S/R Levels was created to solve these problems. It is a fully automated, multi-timeframe, multi-method S/R detection and visualization tool, designed to give traders a complete, objective, and actionable view of the market’s most important price zones.
What Makes This Indicator Unique?
Multi-Timeframe Analysis: Simultaneously analyzes up to three user-selected timeframes, ensuring you never miss a critical S/R level from any timeframe.
Multi-Method Confluence: Integrates several respected S/R detection methods—Swings, Pivots, Fibonacci, Order Blocks, and Volume Profile—into a single, unified system.
Zone Clustering: Automatically merges nearby levels into “zones” to reduce clutter and highlight areas of true market consensus.
Confluence Scoring: Each zone is scored by the number of methods and timeframes in agreement, helping you instantly spot the most significant S/R areas.
Reaction Counting: Tracks how many times price has recently interacted with each zone, providing a real-world measure of its importance.
Customizable Dashboard: A real-time, on-chart table summarizes all key S/R zones, their origins, confluence, and proximity to price.
Smart Alerts: Get notified when price approaches high-confluence zones, so you never miss a critical trading opportunity.
Why Should a Trader Use This?
Objectivity: Removes subjectivity from S/R analysis by using algorithmic detection and clustering.
Efficiency: Saves hours of manual charting and reduces analysis fatigue.
Comprehensiveness: Ensures you are always aware of the most relevant S/R zones, regardless of your trading timeframe.
Actionability: The dashboard and alerts make it easy to act on the most important levels, improving trade timing and risk management.
Adaptability: Works for all asset classes (stocks, forex, crypto, futures) and all trading styles (scalping, swing, position).
The Gap This Indicator Fills
Most S/R indicators focus on a single method or timeframe, leading to incomplete analysis. Manual S/R marking is error-prone and inconsistent. This indicator fills the gap by:
Automating S/R detection across multiple timeframes and methods
Objectively scoring and ranking zones by confluence and reaction
Presenting all this information in a clear, actionable dashboard
How Does It Work? (Technical Logic)
1. Level Detection
For each selected timeframe, the script detects S/R levels using:
SW (Swing High/Low): Recent price pivots where reversals occurred.
Pivot: Classic floor trader pivots (P, S1, R1).
Fib (Fibonacci): Key retracement levels (0.236, 0.382, 0.5, 0.618, 0.786) over the last 50 bars.
Bull OB / Bear OB: Institutional price zones based on bullish/bearish engulfing patterns.
VWAP / POC: Volume Weighted Average Price and Point of Control over the last 50 bars.
2. Level Clustering
Levels within a user-defined % distance are merged into a single “zone.”
Each zone records which methods and timeframes contributed to it.
3. Confluence & Reaction Scoring
Confluence: The number of unique methods/timeframes in agreement for a zone.
Reactions: The number of times price has touched or reversed at the zone in the recent past (user-defined lookback).
4. Filtering & Sorting
Only zones within a user-defined % of the current price are shown (to focus on actionable areas).
Zones can be sorted by confluence, reaction count, or proximity to price.
5. Visualization
Zones: Shaded boxes on the chart (green for support, red for resistance, blue for mixed).
Lines: Mark the exact level of each zone.
Labels: Show level, methods by timeframe (e.g., 15m (3 SW), 30m (1 VWAP)), and (if applicable) Fibonacci ratios.
Dashboard Table: Lists all nearby zones with full details.
6. Alerts
Optional alerts trigger when price approaches a zone with confluence above a user-set threshold.
Inputs & Customization (Explained for All Users)
Show Timeframe 1/2/3: Enable/disable analysis for each timeframe (e.g., 15m, 30m, 1h).
Show Swings/Pivots/Fibonacci/Order Blocks/Volume Profile: Select which S/R methods to include.
Show levels within X% of price: Only display zones near the current price (default: 3%).
How many swing highs/lows to show: Number of recent swings to include (default: 3).
Cluster levels within X%: Merge levels close together into a single zone (default: 0.25%).
Show Top N Zones: Limit the number of zones displayed (default: 8).
Bars to check for reactions: How far back to count price reactions (default: 100).
Sort Zones By: Choose how to rank zones in the dashboard (Confluence, Reactions, Distance).
Alert if Confluence >=: Set the minimum confluence score for alerts (default: 3).
Zone Box Width/Line Length/Label Offset: Control the appearance of zones and labels.
Dashboard Size/Location: Customize the dashboard table.
How to Read the Output
Shaded Boxes: Represent S/R zones. The color indicates type (green = support, red = resistance, blue = mixed).
Lines: Mark the precise level of each zone.
Labels: Show the level, methods by timeframe (e.g., 15m (3 SW), 30m (1 VWAP)), and (if applicable) Fibonacci ratios.
Dashboard Table: Columns include:
Level: Price of the zone
Methods (by TF): Which S/R methods and how many, per timeframe (see abbreviation key below)
Type: Support, Resistance, or Mixed
Confl.: Confluence score (higher = more significant)
React.: Number of recent price reactions
Dist %: Distance from current price (in %)
Abbreviations Used
SW = Swing High/Low (recent price pivots where reversals occurred)
Fib = Fibonacci Level (key retracement levels such as 0.236, 0.382, 0.5, 0.618, 0.786)
VWAP = Volume Weighted Average Price (price level weighted by volume)
POC = Point of Control (price level with the highest traded volume)
Bull OB = Bullish Order Block (institutional support zone from bullish price action)
Bear OB = Bearish Order Block (institutional resistance zone from bearish price action)
Pivot = Pivot Point (classic floor trader pivots: P, S1, R1)
These abbreviations appear in the dashboard and chart labels for clarity.
Example: How to Read the Dashboard and Labels (from the chart above)
Suppose you are trading BTCUSDT on a 15-minute chart. The dashboard at the top right shows several S/R zones, each with a breakdown of which timeframes and methods contributed to their detection:
Resistance zone at 119257.11:
The dashboard shows:
5m (1 SW), 15m (2 SW), 1h (3 SW)
This means the level 119257.11 was identified as a resistance zone by one swing high (SW) on the 5-minute timeframe, two swing highs on the 15-minute timeframe, and three swing highs on the 1-hour timeframe. The confluence score is 6 (total number of method/timeframe hits), and there has been 1 recent price reaction at this level. This suggests 119257.11 is a strong resistance zone, confirmed by multiple swing highs across all selected timeframes.
Mixed zone at 118767.97:
The dashboard shows:
5m (2 SW), 15m (2 SW)
This means the level 118767.97 was identified by two swing points on both the 5-minute and 15-minute timeframes. The confluence score is 4, and there have been 19 recent price reactions at this level, indicating it is a highly reactive zone.
Support zone at 117411.35:
The dashboard shows:
5m (2 SW), 1h (2 SW)
This means the level 117411.35 was identified as a support zone by two swing lows on the 5-minute timeframe and two swing lows on the 1-hour timeframe. The confluence score is 4, and there have been 2 recent price reactions at this level.
Mixed zone at 118291.45:
The dashboard shows:
15m (1 SW, 1 VWAP), 5m (1 VWAP), 1h (1 VWAP)
This means the level 118291.45 was identified by a swing and VWAP on the 15-minute timeframe, and by VWAP on both the 5-minute and 1-hour timeframes. The confluence score is 4, and there have been 12 recent price reactions at this level.
Support zone at 117103.10:
The dashboard shows:
15m (1 SW), 1h (1 SW)
This means the level 117103.10 was identified by a single swing low on both the 15-minute and 1-hour timeframes. The confluence score is 2, and there have been no recent price reactions at this level.
Resistance zone at 117899.33:
The dashboard shows:
5m (1 SW)
This means the level 117899.33 was identified by a single swing high on the 5-minute timeframe. The confluence score is 1, and there have been no recent price reactions at this level.
How to use this:
Zones with higher confluence (more methods and timeframes in agreement) and more recent reactions are generally more significant. For example, the resistance at 119257.11 is much stronger than the resistance at 117899.33, and the mixed zone at 118767.97 has shown the most recent price reactions, making it a key area to watch for potential reversals or breakouts.
Tip:
“SW” stands for Swing High/Low, and “VWAP” stands for Volume Weighted Average Price.
The format 15m (2 SW) means two swing points were detected on the 15-minute timeframe.
Best Practices & Recommendations
Use with Other Tools: This indicator is most powerful when combined with your own price action analysis and risk management.
Adjust Settings: Experiment with timeframes, clustering, and methods to suit your trading style and the asset’s volatility.
Watch for High Confluence: Zones with higher confluence and more reactions are generally more significant.
Limitations
No Future Prediction: The indicator does not predict future price movement; it highlights areas where price is statistically more likely to react.
Not a Standalone System: Should be used as part of a broader trading plan.
Historical Data: Reaction counts are based on historical price action and may not always repeat.
Disclaimer
This indicator is a technical analysis tool and does not constitute financial advice or a recommendation to buy or sell any asset. Trading involves risk, and past performance is not indicative of future results. Always use proper risk management and consult a financial advisor if needed.

Adaptive Trend Cloud + Smart Reversal Zones [@darshakssc]This indicator combines a volatility-adjusted trend cloud with RSI- and volume-based reversal signals to help traders visually spot potential trend continuation or reversal zones.
It’s designed to look clean, colorful, and informative — great for both beginners and experienced traders looking for chart clarity and actionable insights.
🔍 How It Works
🔵 1. Trend Cloud
1. The cloud is created using a 34-period EMA as the base and adjusted with a 14-period ATR multiplier.
2. When price is above the EMA, the cloud turns green (bullish).
3. When price is below the EMA, it turns red (bearish).
4. A neutral gray tone shows when price is inside the cloud, signaling potential indecision.
🔁 2. Smart Reversal Signal Logic
1. Signals appear only when price enters the cloud zone, indicating a potential change in direction.
2. To confirm the reversal, the following conditions must also be met:
3. RSI is below 40 (for bullish reversals) or above 60 (for bearish reversals)
4. A volume spike occurs (1.8× the 20-bar volume average)
5. A cooldown of 10 bars between signals prevents overplotting
🎯 3. TP & SL Labels
1. When a valid buy or sell signal appears:
🎯 TP (Take Profit) is placed at 2× ATR distance
🛑 SL (Stop Loss) is placed at 1× ATR distance
These levels are shown via chart labels for visual reference
🛎️ 4. Alerts
1. Built-in alerts trigger on:
🟢 Buy reversal signals
🔴 Sell reversal signals
✅ How to Use
1. Apply the indicator to any chart (works best on 5min–4h timeframes)
2. Look for the 🟢 Buy / 🔴 Sell labels when price touches the cloud
3. Use the visual TP/SL markers as reference zones — not financial advice
4. Combine with your own risk management, price action or confluence tools
⚙️ Customization Options
1. EMA & ATR lengths and multipliers
2. RSI and volume thresholds
3. Signal cooldown to reduce noise
4. Toggle TP/SL zones on or off
⚠️ Disclaimer
This script is for educational purposes only and does not constitute financial advice. Always test on demo accounts and combine with your own trading system.

% / ATR Buy, Target, Stop + Overlay & P/L% / ATR Buy, Target, Stop + Overlay & P/L
This tool combines volatility‑based and fixed‑percentage trade planning into a single, on‑chart overlay—with built‑in profit‑and‑loss estimates. Toggle between ATR or percentage modes, plot your Buy, Target and Stop levels, and see the dollar gain or loss for a specified position size—all in one interactive table and chart display.
NOTE: To activate plotted lines, price labels, P/L rows and table values, enter a Buy Price greater than zero.
What It Does
Mode Toggle: Choose between “ATR” (volatility‑based) or “%” (fixed‑percentage) calculations.
Buy Price Input: Manually enter your entry price.
ATR Mode:
Target = Buy + (ATR × Target Multiplier)
Stop = Buy − (ATR × Stop Multiplier)
Percentage Mode:
Target = Buy × (1 + Target % / 100)
Stop = Buy × (1 – Stop % / 100)
P/L Estimates: Specify a dollar amount to “invest” at your Buy price, and the script calculates:
Gain ($): Profit if Target is hit
Loss ($): Cost if Stop is hit
Visual Overlay: Draws horizontal lines for Buy, Target and Stop, with optional price labels on the chart scale.
Interactive Table: Displays Buy, Target, Stop, ATR/timeframe info (in ATR mode), percentages (in % mode), and P/L rows.
Customization Options
Line Settings:
Choose color, style (solid/dashed/dotted), and width for Buy, Target, Stop lines.
Extend lines rightward only or in both directions.
Table Settings:
Position the table (top/bottom × left/right).
Toggle individual rows: Buy Price; Target (multiplier or %); Stop (multiplier or %); Target ATR %; Stop ATR %; ATR Time Frame; ATR Value; Gain ($); Loss ($).
Customize text colors for each row and background transparency.
General Inputs:
ATR length and optional ATR timeframe override (e.g. use daily ATR on an intraday chart).
Target/Stop multipliers or percentages.
Dollar Amount for P/L calculations.
How to Use It for Trading
Plan Your Entry: Enter your intended Buy Price and position size (dollar amount).
Select Mode: Toggle between ATR or % mode depending on whether you prefer volatility‑based or fixed offsets.
Assess R:R and P/L: Instantly see your Target, Stop levels, and potential profit or loss in dollars.
Visual Reference: Lines and price labels update in real time as you tweak inputs—ideal for live trading, backtesting or trade journaling.
Ideal For
Traders who want both volatility‑based and percentage‑based exit options in one tool
Those who need on‑chart P/L estimates based on position size
Swing and intraday traders focused on objective, rule‑based trade management
Anyone who uses ATR for adaptive stops/targets or fixed percentages for simpler exits
Weekly Range ProjectionsWeekly Range Projections
Inspired by toodegrees' excellent "ICT Friday's Asian Range" indicator
This indicator is a modified and enhanced version of the original Friday's Asian Range indicator created by toodegrees. While studying their brilliant work, I realized the concept could be expanded beyond just Friday's Asian session to create a more versatile tool for weekly price projections.
What's New?
I've transformed the original concept into a fully customizable range projection tool that allows traders to:
Select Any Day of the Week - Not limited to just Fridays anymore
Define Custom Time Ranges - Set your own start and end times to capture any session (Asian, London, New York, or custom ranges)
Flexible Deviation Levels - Choose between 1-9 standard deviations instead of the fixed 5
Toggle Body/Wick Ranges - Show or hide body and wick projections independently
Updated to Pine Script v6 - Taking advantage of the latest Pine Script features
How It Works
The indicator captures the price range (body and/or wick) during your specified time window on your chosen day, then projects standard deviation levels from that range. These levels often act as significant support/resistance throughout the week.
Use Cases
Weekly Opening Range - Capture Monday's opening range for week-long projections
Session-Based Analysis - Define any session on any day for targeted analysis
Multi-Timeframe Projections - Create different instances for various time ranges
ICT Concepts - Perfect for traders following ICT methodologies with customizable ranges
Credits
Huge thanks to toodegrees for creating the original Friday's Asian Range indicator and sharing it with the community. Their clean code structure and innovative approach to range projections inspired this modification. The core logic and visual presentation style remain true to their original vision, with added flexibility for broader applications.
If you find this useful, please also check out toodegrees' original indicators - they create fantastic tools for the TradingView community!
Settings Guide
Range Settings - Choose your day and define start/end times
Range Type - Toggle body and/or wick ranges
Deviations - Select how many standard deviation levels to display
Styling - Customize colors and line styles for both range types
Alerts - Set up alerts for price crossing specific deviation levels
Remember to use this on 5-minute or 15-minute charts as intended by the original design.
Note: This indicator follows the Mozilla Public License 2.0

Binance Spot vs Perpetual Price index by BIGTAKER📌 Overview
This indicator calculates the premium (%) between Binance Perpetual Futures and Spot prices in real time and visualizes it as a column-style chart.
It automatically detects numeric prefixes in futures symbols—such as `1000PEPE`, `1MFLUX`, etc.—and applies the appropriate scaling factor to ensure accurate 1:1 price comparisons with corresponding spot pairs, without requiring manual configuration.
Rather than simply showing raw price differences, this tool highlights potential imbalances in supply and demand, helping to identify phases of market overheating or panic selling.
🔧 Component Breakdown
1. ✅ Auto Symbol Mapping & Prefix Scaling
Automatically identifies and processes common numeric prefixes (`1000`, `1M`, etc.) used in Binance perpetual futures symbols.
Example:
`1000PEPEUSDT.P` → Spot symbol: `PEPEUSDT`, Scaling factor: `1000`
This ensures precise alignment between futures and spot prices by adjusting the scale appropriately.
2. 📈 Premium Calculation Logic
Formula:
(Scaled Futures Price − Spot Price) / Spot Price × 100
Interpretation:
* Positive (+) → Futures are priced higher than spot: indicates possible long-side euphoria
* Negative (−) → Futures are priced lower than spot: indicates possible panic selling or oversold conditions
* Zero → Equilibrium between futures and spot pricing
3. 🎨 Visualization Style
* Rendered as column plots (bar chart) on each candle
* Color-coded based on premium polarity:
* 🟩 Positive premium: Light green (`#52ff7d`)
* 🟥 Negative premium: Light red (`#f56464`)
* ⬜ Neutral / NA: Gray
* A dashed horizontal line at 0% is included to indicate the neutral zone for quick visual reference
💡 Strategic Use Cases
| Market Behavior | Strategy / Interpretation |
| ----------------------------------------- | ------------------------------------------------------------------------ |
| 📈 Premium surging | Strong futures demand → Overheated longs (short setup) |
| 📉 Premium dropping | Aggressive selling in futures → Oversold signal (long setup) |
| 🔄 Near-zero premium | Balanced market → Wait and observe or reassess |
| 🧩 Combined with funding rate or OI delta | Enables multi-factor confirmation for short-term or mid-term signals |
🧠 Technical Advantages
* Fully automated scaling for prefixes like `1000`, `1M`, etc.
* Built-in error handling for inactive or missing symbols (`ignore_invalid_symbol=true`)
* Broad compatibility with Binance USDT Spot & Perpetual Futures markets
🔍 Target Use Cases & Examples
Compatible symbols:
`1000PEPEUSDT.P`, `DOGEUSDT.P`, `1MFLUXUSDT.P`, `ETHUSDT.P`, and most other Binance USDT-margined perpetual futures
Works seamlessly with:
* Binance Spot Market
* Binance Perpetual Futures Market

Fair Value MSThis indicator introduces rigid rules to familiar concepts to better capture and visualize Market Structure and Areas of Support and Resistance in a way that is both rule-based and reactive to market movements.
Typical "Market Structure" or "Zig-Zag" methods determine swing points based on fixed thresholds (length or percentage). While this does provide rigid structure, the results may be lagging or confusing due to the timing, since it is fixed to static parameters.
I believe the concept of Fair Value Gaps can solve this problem.
As you will notice, there are no length settings in this indicator.
> FVG Market Structure
Fair Value Gaps are a well known concept used to indicate directional intent, forming when price moves aggressively in one direction, leaving behind an imbalance between buyers and sellers. While the term FVG was popularized by ICT, the underlying concept predates them, known historically as imbalances, inefficiencies, or liquidity voids in institutional trading.
Note: For simplicity, in this indicator they'll be called FVGs.
By reading into this, we are able to clearly and rigidly define market structure simply by "looking" at the chart, using objective price events rather than subjective interpretation, or lengths.
By using FVGs to determine structure direction, the length, and speed of identification lies entirely on the market. If an FVG Down occurs immediately after a New Higher High forms, it is reasonable to assume there was a seller at that point, so the script would indicate a New Swing High.
The script is NOT stuck, waiting for a % retrace, or # bars to pass to identify it as such.
Sometimes the market is in a steady trend in a single direction and no FVGs form; therefore, no structure forms. -> Why would we try to impose structure on a clear trend?
Ultimately, the FVG Structure Method uses real reactions from the market to determine Market structure, and is not fixed to specific parameters.
As with other market structure indicators, "Market Structure Breaks" are still identifiable when price moves outside the most recent swing points.
These are helpful to indicate larger direction. In the following section you will see how these help us determine when we should start the search for an "Area of Interest (AOI)".
> Areas of Interest (AOIs)
"Area of Interest (AOI)" is a generalized term, and could refer to many types of zones you might recognize under different names. While the AOIs in this indicator are specialized in their own way, I have chosen to simply use the term "Area of Interest" because it’s more important to understand how they behave and why they exist than to focus on what they’re called.
The goal of an AOI is to point out reasonable areas where buyers or sellers may be staging, as is typical with support and resistance.
In order to reasonably identify these areas, we look for cause and effect relationships. When considering these relationships, it's easier to understand the placement of the points to define each zone.
(Buyer Examples)
Cause: Strong Buyers step in at Swing Low
Effect: Fair Value Gap Forms
Cause: Sustained Buying Pressure
Effect: Market Structure Breaks
In this example, The zone is drawn from the Swing Low, to the Bottom of the FVG closest to the swing point.
In theory, the participation at the swing point was strong and aggressive enough to create the FVG imbalance. Which then found acceptance and continued into a Market Structure Break. So with these AOIs, we are trying to locate the aggressive Buyers or Sellers which were positioned BEFORE the FVG.
These Zones are intended to act as areas to look for reactions from market participants, to judge where price may be going. When revisiting these zones, we look for a reaction or a break, to further provide us information to if the buyers or sellers are still there.
As seen in the screenshot above, The information we gain is not from the creation of these zones, but from the behavior we witness when these zones are revisited.
Technical Note: In this indicator, Market Structure Breaks are only considered when price closes outside the recent swing points. Wicks are not considered as confirmation, therefore are not used to detect structural breaks.
Inside each AOI you can optionally display a readout of the volume which accumulated during the time starting at the swing point and going until the closing bar of the FVG.
Note: We are counting volume until the closing bar of the FVG since the FVG is a 3 bar formation, and aggressive volume is required throughout to create the imbalance.
There are multiple FVGs that typically occur in a single direction, but we do not look to every single one to be indicative of structure, only the first FVG in the opposite direction of the previous direction (which is determined by previous FVGs)
You will probably notice, the AOIs do not form from the closest swing or FVG to the break, this is because we are targeting larger directional changes to draw these AOIs from.
Since they do not always happen perfectly every time, the AOI formation waits for an FVG to occur AND a Market structure break to happen. One without the other will result in no Zone displaying.
> Reflection Lines
While they may seem slightly redundant, Reflection Lines serve as reminders of previous support and resistance pivots. They are drawn at the same Pivots where and AOI is formed, and extend beyond the mitigation of the AOI.
These lines are often points of price to look for "Support Flips", a re-test pattern where price trades through previous support (or resistance) then returns to it and rejects, continuing into a larger move or trend.
Their namesake is based on the behavior of price, "reflecting" at these levels.
The Reflection lines are simple and change color based on price's location.
If price is above, we would typically look to a reflection line in with support in mind.
As a basic filter, these lines use an average price to determine their color, this way they will not change their color as frequently in choppy situations.
> Session Start/End Lines
For analysis purposes and trade review, it is helpful to analyze with context.
For that reason, I have implemented start and end session lines into the indicator, these are helpful when reviewing historical charts to not provide additional context.
By default, they are set to the NYSE Session, but can be changed to fit any needs.
These lines are not advanced, and simply draw a line as the chart passes the start and end of the sessions. It's very likely that you may need to adjust the session for your specific needs.
Note: The Timezone can be adjusted within the code if needed. By Default, the indicator uses "America/New_York" Timezone.
> Conclusion
If you’ve ever felt like your structure tools were confusing or lagging, drawing zones too late, or zones that simply don't make sense, this should feel like a breath of fresh air.
By removing arbitrary length settings and instead using FVGs to define structure and as a basis for AOIs, you're getting a more accurate look at what price is doing and where it's reacting from.
This indicator is rule-based, reactive, and aims to keep things logical without fluff or false confidence.
Enjoy!

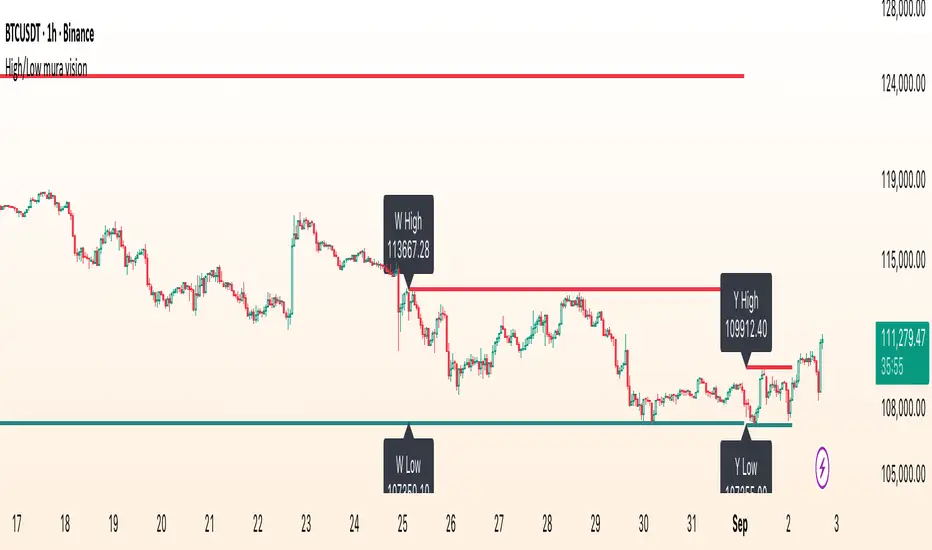
High/Low mura visionDescription
High/Low mura vision plots static support and resistance lines based on the completed high and low values of the prior trading day, week and calendar month.
This script:
Anchors each level to the exact start and end bars of the completed period
Does not repaint or extend levels into the current period
Uses request.security() to retrieve only historical data (no lookahead)
This indicator was built to give traders clear, unambiguous reference points for breakout entries, pullback targets or confirmation of supply/demand zones without guessing where to draw manually.
How It Works
At the close of each daily candle, the script captures high and low via request.security() and draws flat lines spanning only that day’s bars.
Similarly, at the close of Friday’s weekly candle and the last bar of each calendar month, it draws the completed week’s and month’s high/low ranges.
All lines are deleted and redrawn only once per period completion, ensuring no forward painting or hidden repainting logic.
Key Features
No repaint: levels appear exactly once, immediately after the period closes
Period‑specific: lines confined to the bars of the prior day, week or month
Customizable: toggle each period on/off; choose independent colors, line styles (Solid, Dotted, Dashed) and width
Lightweight: minimal calculations for maximum performance on any timeframe
How to Use
Apply to any chart (M1 to MN).
In the Inputs panel, enable the levels you need: Yesterday, Last Week or Last Month.
Adjust High and Low line color, style and thickness to suit your chart layout.
Use these historic levels for support/resistance, breakout confirmation or confluence with other tools.
Inputs
Show Yesterday’s High: toggle yesterday’s high line
Show Yesterday’s Low: toggle yesterday’s low line
Show Last Week’s High: toggle last week’s high line
Show Last Week’s Low: toggle last week’s low line
Show Last Month’s High: toggle last month’s high line
Show Last Month’s Low: toggle last month’s low line
High Line Color / Low Line Color: choose colors for each set of lines
High Line Style / Low Line Style: select Solid, Dotted or Dashed
Line Width: adjust overall thickness
Disclaimer
This script is provided “as‐is” under the Public License. It is intended for educational and analytical purposes only and does not constitute trading or investment advice. Past performance does not guarantee future results. Always perform your own analysis and manage risk responsibly.