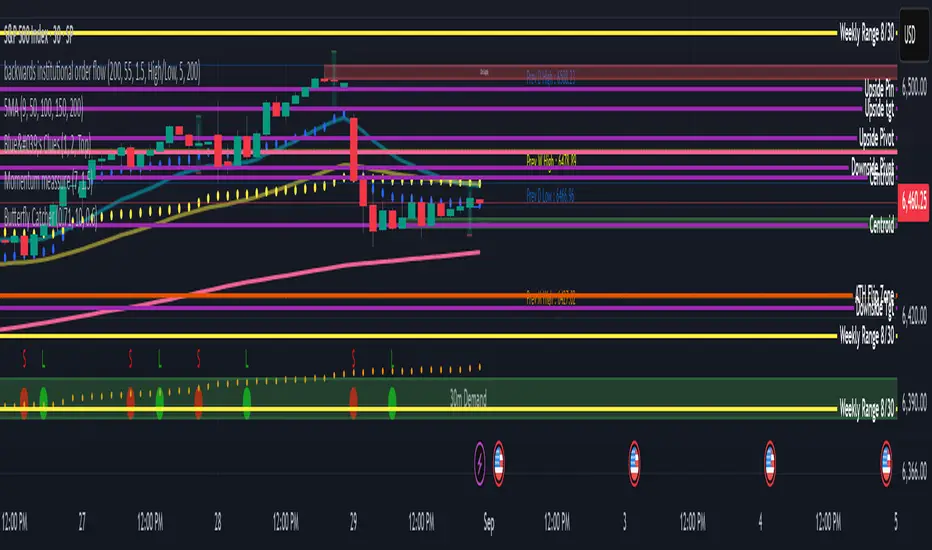
ORB with Golden Zone FIB targets, Any Timeframe by TenAMTraderDescription:
This indicator is designed to help traders identify key price levels using Fibonacci extensions and retracements based on the Opening Range Breakout (ORB). The levels are visualized as “Golden Zones”, which can serve as potential targets for trades.
Features:
Customizable ORB Timeframe: By default, the ORB is set from 9:30 AM to 9:45 AM EST, but any timeframe can be configured in the settings to fit your trading style.
Golden Zones as Targets: Fibonacci levels are intended to be used as potential profit-taking zones or areas to monitor for reversals, providing a structured framework for intraday and swing trading.
Adjustable Chart Settings: Color-coded levels make it easy to interpret at a glance, and all lines can be customized for personal preference.
Versatile Application: The indicator works across any timeframe, enabling traders to analyze both intraday and multi-day price action.
How to Use:
Ensure Regular Trading Hours (RTH) is enabled on your chart for accurate level calculation.
Observe price action near Golden Zones: a confirmed breakout may indicate continuation, while a pullback could signal a reversal opportunity.
Use the Golden Zones as reference targets for managing risk and planning exits.
Adjust the ORB timeframe and display settings to match your preferred trading style.
Legal Disclosure:
This indicator is provided for educational purposes only and is not financial advice. Trading carries a substantial risk of loss. Users should always perform their own analysis and consult a licensed financial professional before making any trading decisions. Past performance is not indicative of future results.
Punkty Pivota i Poziomy

Swing Z – Crypto Trading Algorithm | Zillennial Technologies IncSwing Z by Zillennial Technologies Inc. is an advanced algorithmic framework built specifically for cryptocurrency markets. It integrates multiple layers of technical analysis into a single decision-support tool, generating buy and sell signals only when several independent confirmations align.
Core Concept
Swing Z fuses trend structure, momentum oscillators, volatility signals, and price action tools to capture high-probability trading opportunities in volatile crypto environments.
Trend Structure (EMA 9, 21, 50, 200)
Short-term EMAs (9 & 21) detect immediate momentum shifts.
Longer-term EMAs (50 & 200) define the broader trend and dynamic support/resistance.
Momentum & Confirmation Layer
RSI measures relative strength and market conditions.
MACD crossovers confirm momentum shifts and trend continuations.
Volatility & Market Pressure
TTM Squeeze highlights compression zones likely to precede breakouts.
Volume analysis confirms conviction behind directional moves.
VWAP (Volume Weighted Average Price) establishes intraday value zones and institutional benchmarks.
Price Action Filters
Fibonacci retracements are integrated to identify key reversal and continuation levels.
Signals are produced only when multiple conditions agree, reducing noise and improving reliability in fast-moving crypto markets.
Features
Tailored for cryptocurrency trading across major pairs (BTC, ETH, and altcoins).
Works effectively on swing and trend-based timeframes (1H–1D).
Combines trend, momentum, volatility, and price action into a single framework.
Generates clear Buy/Sell markers and integrates with TradingView alerts.
How to Use
Apply to a clean chart for the clearest visualization.
Use Swing Z as a swing trading tool, aligning entries with both trend structure and momentum confirmation.
Combine with your own stop-loss, take-profit, and position sizing rules.
Avoid application on non-standard chart types such as Renko, Heikin Ashi, or Point & Figure, which may distort results.
Disclaimer
Swing Z is designed as a decision-support tool, not financial advice.
All backtesting should use realistic risk, commission, and slippage assumptions.
Past results do not guarantee future performance.
Signals do not repaint but may adjust as new data develops in real-time.
Why Swing Z is original & useful:
Swing Z unifies EMA trend structure, RSI, MACD, TTM Squeeze, VWAP, Fibonacci retracements, and volume analysis into a single algorithmic framework. This multi-confirmation approach improves accuracy by requiring consensus across trend, momentum, volatility, and price action — a design made specifically for the challenges and volatility of cryptocurrency markets.

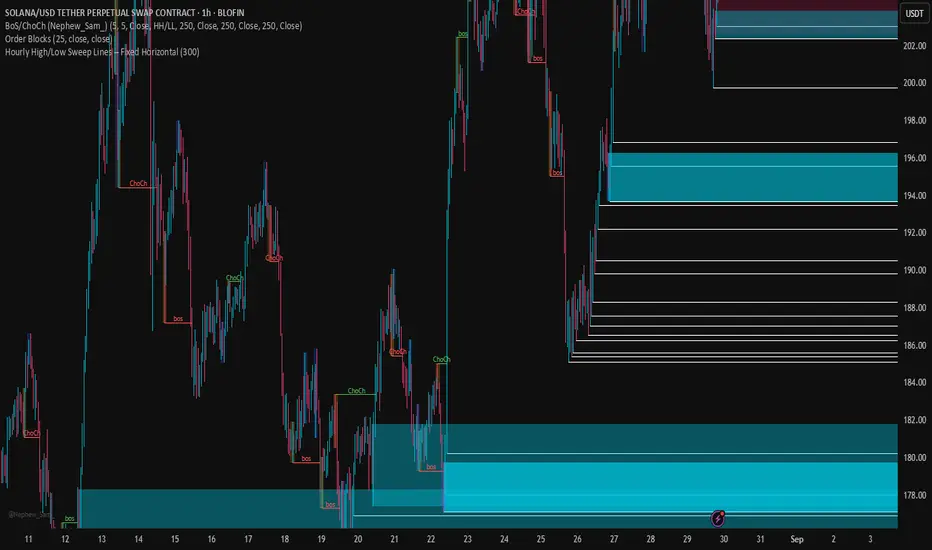
Hourly High/Low Sweep Lines – Fixed HorizontalMarks out the hourly high and lows for levels of liquidity for take profits
Dual Channel System [Alpha Extract]A sophisticated trend-following and reversal detection system that constructs dynamic support and resistance channels using volatility-adjusted ATR calculations and EMA smoothing for optimal market structure analysis. Utilizing advanced dual-zone methodology with step-like boundary evolution, this indicator delivers institutional-grade channel analysis that adapts to varying volatility conditions while providing high-probability entry and exit signals through breakthrough and rejection detection with comprehensive visual mapping and alert integration.
🔶 Advanced Channel Construction
Implements dual-zone architecture using recent price extremes as foundation points, applying EMA smoothing to reduce noise and ATR multipliers for volatility-responsive channel widths. The system creates resistance channels from highest highs and support channels from lowest lows with asymmetric multiplier ratios for optimal market reaction zones.
// Core Channel Calculation Framework
ATR = ta.atr(14)
// Resistance Channel Construction
Resistance_Basis = ta.ema(ta.highest(high, lookback), lookback)
Resistance_Upper = Resistance_Basis + (ATR * resistance_mult)
Resistance_Lower = Resistance_Basis - (ATR * resistance_mult * 0.3)
// Support Channel Construction
Support_Basis = ta.ema(ta.lowest(low, lookback), lookback)
Support_Upper = Support_Basis + (ATR * support_mult * 0.4)
Support_Lower = Support_Basis - (ATR * support_mult)
// Smoothing Application
Smoothed_Resistance_Upper = ta.ema(Resistance_Upper, smooth_periods)
Smoothed_Support_Lower = ta.ema(Support_Lower, smooth_periods)
🔶 Volatility-Adaptive Zone Framework
Features dynamic ATR-based width adjustment that expands channels during high-volatility periods and contracts during consolidation phases, preventing false signals while maintaining sensitivity to genuine breakouts. The asymmetric multiplier system optimizes zone boundaries for realistic market behavior patterns.
// Dynamic Volatility Adjustment
Channel_Width_Resistance = ATR * resistance_mult
Channel_Width_Support = ATR * support_mult
// Asymmetric Zone Optimization
Resistance_Zone = Resistance_Basis ± (ATR_Multiplied * )
Support_Zone = Support_Basis ± (ATR_Multiplied * )
🔶 Step-Like Boundary Evolution
Creates horizontal step boundaries that update on smoothed bound changes, providing visual history of evolving support and resistance levels with performance-optimized array management limited to 50 historical levels for clean chart presentation and efficient processing.
🔶 Comprehensive Signal Detection
Generates break and bounce signals through sophisticated crossover analysis, monitoring price interaction with smoothed channel boundaries for high-probability entry and exit identification. The system distinguishes between breakthrough continuation and rejection reversal patterns with precision timing.
🔶 Enhanced Visual Architecture
Provides translucent zone fills with gradient intensity scaling, step-like historical boundaries, and dynamic background highlighting that activates upon zone entry. The visual system uses institutional color coding with red resistance zones and green support zones for intuitive
market structure interpretation.
🔶 Intelligent Zone Management
Implements automatic zone relevance filtering, displaying channels only when price proximity warrants analysis attention. The system maintains optimal performance through smart array management and historical level tracking with configurable lookback periods for various market conditions.
🔶 Multi-Dimensional Analysis Framework
Combines trend continuation analysis through breakthrough patterns with reversal detection via rejection signals, providing comprehensive market structure assessment suitable for both trending and ranging market conditions with volatility-normalized accuracy.
🔶 Advanced Alert Integration
Features comprehensive notification system covering breakouts, breakdowns, rejections, and bounces with customizable alert conditions. The system enables precise position management through real-time notifications of critical channel interaction events and zone boundary violations.
🔶 Performance Optimization
Utilizes efficient EMA smoothing algorithms with configurable periods for noise reduction while maintaining responsiveness to genuine market structure changes. The system includes automatic historical level cleanup and performance-optimized visual rendering for smooth operation across all timeframes.
Why Choose Dual Channel System ?
This indicator delivers sophisticated channel-based market analysis through volatility-adaptive ATR calculations and intelligent zone construction methodology. By combining dynamic support and resistance detection with advanced signal generation and comprehensive visual mapping, it provides institutional-grade channel analysis suitable for cryptocurrency, forex, and equity markets. The system's ability to adapt to varying volatility conditions while maintaining signal accuracy makes it essential for traders seeking systematic approaches to breakout trading, zone reversals, and trend continuation analysis with clearly defined risk parameters and comprehensive alert integration. Also to note, this indicator is best suited for the 1D timeframe.

Liquidity Swing Points [BackQuant]Liquidity Swing Points
This tool marks recent swing highs and swing lows and turns them into persistent horizontal “liquidity” levels. These are places where resting orders often accumulate, such as stop losses above prior highs and below prior lows. The script detects confirmed pivots, records their prices, draws lines and labels, and manages their lifecycle on the chart so you can monitor potential sweep or breakout zones without manual redrawing.
What it plots
LQ-H at confirmed swing highs
LQ-L at confirmed swing lows
Horizontal levels that can optionally extend into the future
Timed removal of old levels to keep the chart clean
Each level stores its price, the bar where it was created, its type (high or low), plus a label and a line reference for efficient updates.
How it works
Pivot detection
A swing high is confirmed when the highest high has swing_length bars on both sides that are lower.
A swing low is confirmed when the lowest low has swing_length bars on both sides that are higher.
Pivots are only marked after they are confirmed, so they do not repaint.
Level creation
When a pivot confirms, the script records the price and the creation bar (offset by the right lookback).
A new line is plotted at that price, labeled LQ-H or LQ-L.
Rendering and extension
Levels can be drawn to the most recent bar only or extended to the right for forward reference.
Label size and line color/transparency are configurable.
Lifecycle management
On each confirmed bar, the script checks level age.
Levels older than a chosen bar count are removed automatically to reduce clutter.
How it can be used
Liquidity sweeps: Watch for price to probe beyond a level then close back inside. That behavior often signals a potential fade back into the prior range.
Breakout validation: If price pushes through a level and holds on closes, traders may treat that as continuation. Retests of the level from the other side can serve as structure checks.
Context for entries and exits: Use nearby LQ-H or LQ-L as reference for stop placement or partial-take zones, especially when other tools agree.
Multi-timeframe mapping: Plot swing points on higher timeframes, then drill down to time entries on lower timeframes as price interacts with those levels.
Why liquidity levels matter
Prior swing points are focal areas where many strategies set stops or pending orders. Price often revisits these zones, either to “sweep” resting liquidity before reversing, or to absorb it and trend. Marking these areas objectively helps frame scenarios like failed breaks, successful breakouts, and retests, and it reduces the subjectivity of eyeballing structure.
Settings to know
Swing Detection Length (swing_length), Controls sensitivity. Lower values find more local swings. Higher values find more significant ones.
Bars until removal (removeafter), Deletes levels after a fixed number of bars to prevent buildup.
Extend Levels Right (extend_levels), Keeps levels projected into the future for easier planning.
Label Size (label_size), Choose tiny to large for chart readability.
One color input controls both high and low levels with transparency for context.
Strengths
Objective marking of recent structure without hand drawing
No repaint after confirmation since pivots are locked once the right lookback completes
Lightweight and fast with simple lifecycle management
Clear visuals that integrate well with any price-action workflow
Practical tips
For scalping: use smaller swing_length to capture more granular liquidity. Keep removeafter short to avoid clutter.
For swing trading: increase swing_length so only more meaningful levels remain. Consider extending levels to the right for planning.
Combine with time-of-day filters, ATR for stop sizing, or a separate trend filter to bias trades taken at the levels.
Keep screenshots focused: one image showing a sweep and reversal, another showing a clean breakout and retest.
Limitations and notes
Levels appear after confirmation, so they are delayed by swing_length bars. This is by design to avoid repainting.
On very noisy or illiquid symbols, you may see many nearby levels. Increasing swing_length and shortening removeafter helps.
The script does not assess volume or session context. Consider pairing with volume or session tools if that is part of your process.

Golden Cross + Support/Resistance + SL/TP + SignalsGolden Cross + Support/Resistance + SL/TP + Signals
Golden Cross + Support/Resistance + SL/TP + Signals

Vietnamese: Swing Low Detection with SMA Bands & BackgroundThis script detects **swing lows** using a dynamic SMA-based logic and visually highlights them on the chart.
Features
Customizable Moving Averages: Supports multiple MA types (SMA, EMA, WMA, RMA, HMA, DEMA, TEMA, VWMA).
Swing Low Visualization: Identifies swing lows when price closes below the SMA of lows and exits once price trades above the SMA of highs.
Smart Rectangles: Marks detected swing lows with labeled boxes for clear visual reference.
Background Highlights**: Dynamically shades the chart background when price breaks below recent swing lows, helping traders spot potential breakdown zones.
Configurable Parameters: Period length, rectangle length, and MA source can all be tuned.
Use Cases
Spot breakdown/bearish continuation signals when price closes under recent lows.
Combine with higher timeframe trend analysis for confluence.
Notes
* This tool is designed for **visual analysis** and is not a standalone buy/sell signal.
* Works best when combined with broader trend analysis, support/resistance levels, and volume.

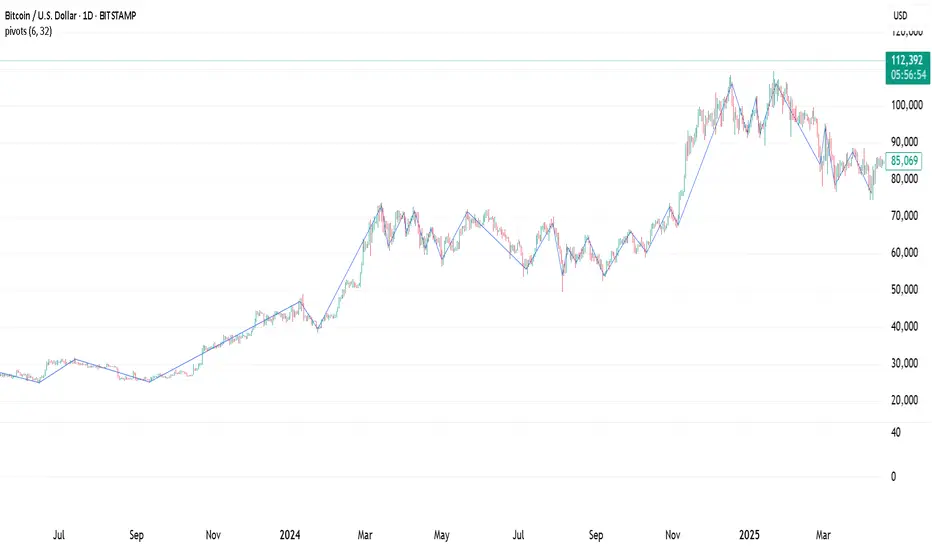
Pivot Points. High & Lows By Reversal PercentageLibrary "Pivot Points. High & Lows By Reversal Percentage" by Jal9000
This Pine Script library provides a robust function for identifying and tracking pivot points (reversal points) in price data, suitable for integration into custom trading indicators and strategies.
🛠️ Main Features:
- ✅ Identifies pivot highs and lows based on configurable price movement thresholds.
- ✅ Lightweight. No candle backtracing used. Much less computation heavy.
- ✅ Supports multiple calls (with different values) within a single script.
- ✅ Compatible with request.security for multi-timeframe analysis.
- ✅ Returns both confirmed and temporary pivots for flexible integration.
- ✅ Pinescript V5 and V6 compliant code.
Purpose:
The pivots library enables Pine Script developers to easily add pivot point detection to their scripts. It identifies significant price reversals by evaluating price movements against a minimum range threshold ( min_range_pct ) and confirming reversals based on a percentage ( reversal_pct ) of the prior trend’s magnitude. The library supports multiple simultaneous calls with different settings, making it ideal for multi-timeframe strategies.
How It Works:
The library’s f_calculatePivot function tracks price movements to detect pivot points:
Minimum Range Threshold : A potential pivot is considered if the price moves beyond the min_range_pct percentage of the current high (for a high pivot) or low (for a low pivot), ensuring sufficient movement.
Reversal Confirmation : A pivot is confirmed if the price reverses from the potential pivot by at least the reversal_pct percentage of the distance between the last confirmed pivot and the current potential pivot, measuring the retracement relative to the prior trend’s magnitude.
The function alternates between tracking highs (in an uptrend) and lows (in a downtrend), updating the trend when a pivot is confirmed.
State management uses an array of pivot_state objects, allowing independent calculations for different timeframes and min_range_pct values within the same script.
## Technical Reference
Functions:
f_calculatePivot(series float _high, series float _low, float _min_range_pct, float _reversal_pct) →
- Parameters:
_high : The high price series (e.g., high or math.max(open, close) ).
_low : The low price series (e.g., low or math.min(open, close) ).
_min_range_pct : The minimum percentage price movement to consider a potential pivot.
_reversal_pct : The percentage of the prior trend’s distance required to confirm a pivot.
- Returns:
A tuple containing:
isNewPivot : Boolean indicating if a new pivot was confirmed.
last_confirmed_pivot : The most recent confirmed pivot (type pivot ).
temp_pivot : The current temporary pivot (type pivot ).
Pivot type:
idx (series int) : Bar index of the pivot.
typ (series int) : Type of pivot ( PIVOT_HIGH or PIVOT_LOW ).
prc (series float) : Price of the pivot.
tme (series int) : Timestamp of the pivot.
Constants (internal):
TREND_LONG , TREND_SHORT : Trend direction indicators (1, -1).
PIVOT_HIGH , PIVOT_LOW : Pivot type indicators (1, -1).
✨ Example of Use:
//@version=5
indicator("Pivot Example", overlay=true)
import jal9000/pivots/1 as pivots
// Inputs
min_range_pct = input.float(20.0, 'Min Range %')
reversal_pct = input.float(30.0, 'Reversal %')
ignore_wick = input.bool(true, 'Ignore wick')
h = ignore_wick ? math.max(open, close) : high
l = ignore_wick ? math.min(open, close) : low
// Call the function with high, low, and input parameters
= pivots.f_calculatePivot(h, l, min_range_pct, reversal_pct)
// Variable to store previous confirmed pivot outside the function
var pivots.pivot prev_confirmed_pivot = na
// Draw the line if a new pivot is confirmed and previous pivot exists
if is_new_pivot
if not na(prev_confirmed_pivot) and not na(new_confirmed_pivot)
line.new(x1 = prev_confirmed_pivot.idx, y1 = prev_confirmed_pivot.prc, x2 = new_confirmed_pivot.idx, y2 = new_confirmed_pivot.prc, color = color.blue, width = 1)
prev_confirmed_pivot := new_confirmed_pivot
## Release Notes
v1
- Initial release of the pivots library with f_calculatePivot function for detecting pivot points and supporting multiple configurations and timeframes.
v2
- Code is Pinescript V6 ready. Remains identified as V5, but changing the version number is the only thing that is required to be v6.
Dips & Rips — OVERLAY (Triangles on Price Only, size fixed)This script calculates extreme dips (blue triangle) or rips (yellow triangle) as likely reversal points, with confirmation long (green triangles) and short (red triangles) triggers occurring on subsequent RSI divergences.

Multi HTF High/Low LevelsThis indicator plots the previous high and low from up to four user-defined higher timeframes (HTF), providing crucial levels of support and resistance. It's designed to be both powerful and clean, giving you a clear view of the market structure from multiple perspectives without cluttering your chart.
Key Features:
Four Customizable Timeframes: Configure up to four distinct higher timeframes (e.g., 1-hour, 4-hour, Daily, Weekly) to see the levels that matter most to your trading style.
Automatic Visibility: The indicator is smart. It automatically hides levels from any timeframe that is lower than your current chart's timeframe. For example, if you're viewing a Daily chart, the 4-hour levels won't be shown.
Clean On-Chart Lines: The high and low for each timeframe are displayed as clean, extended horizontal lines, but only for the duration of the current higher-timeframe period. This keeps your historical chart clean while still showing the most relevant current levels.
Persistent Price Scale Labels: For easy reference, the price of each high and low is always visible on the price scale and in the data window. This is achieved with an invisible plot, giving you the accessibility of a plot without the visual noise.
How to Use:
Go into the indicator settings.
Under each "Timeframe" group, check the "Show" box to enable that specific timeframe.
Select your desired timeframe from the dropdown menu.
The indicator will automatically calculate and display the previous high and low for each enabled timeframe.

Fibonacci Sequence Circles [BigBeluga]🔵 Overview
The Fibonacci Sequence Circles is a unique and visually intuitive indicator designed for the TradingView platform. It combines the principles of the Fibonacci sequence with geometric circles to help traders identify potential support and resistance levels, as well as price expansion zones. The indicator dynamically anchors to key price points, such as pivot highs, pivot lows, or timeframe changes (daily, weekly, monthly), and generates Fibonacci-based circles around these anchor points.
⚠️For proper indicators visualization use simple not logarithmic chart
🔵 Key Features
Customizable Anchor Points : The indicator can be anchored to Pivot Highs , Pivot Lows , or timeframe changes ( Daily, Weekly, Monthly ), making it adaptable to various trading strategies.
Fibonacci Sequence Logic : The circles are generated using the Fibonacci sequence, where the diameter of each circle is the sum of the diameters of the two preceding circles.
first = start_val
secon = start_val + int(start_val/2)
three = first + secon
four = secon + three
five = three + four
six = four + five
seven = five + six
eight = six + seven
nine = seven + eight
ten = eight + nine
Adjustable Start Value : Traders can modify the starting value of the sequence to scale the circles larger or smaller, ensuring they fit the current price action.
Color Customization : Each circle can be individually enabled or disabled, and its color can be customized for better visual clarity.
Visual Labels : The diameter of each circle (in bars) is displayed next to the circle, providing additional context for analysis.
🔵 Usage
Step 1: Set the Anchor Point - Choose the anchor type ( Pivot High, Pivot Low, Daily, Weekly, Monthly ) to define the center of the Fibonacci circles.
Step 2: Adjust the Start Value - Modify the starting value of the Fibonacci sequence to scale the circles according to the price action.
Step 3: Customize Circle Colors - Enable or disable specific circles and adjust their colors for better visualization.
Step 4: Analyze Price Action - Use the circles to identify potential support/resistance levels, price expansion zones, or trend continuation areas.
Step 5: Combine with Other Tools - Enhance your analysis by combining the indicator with other technical tools like trendlines, moving averages, or volume indicators.
The Fibonacci Sequence Circles is a powerful and flexible tool for traders who rely on Fibonacci principles and geometric patterns. Its ability to anchor to key price points and dynamically scale based on market conditions makes it suitable for various trading styles and timeframes. Whether you're a day trader or a long-term investor, this indicator can help you visualize and anticipate price movements with greater precision.

Frozen 4H VWAP – Precision AnchoredFrozen 4H VWAP – Precision Anchored Like Ice
The Frozen 4H VWAP – Precision Anchored delivers a clean, stable, and reliable view of the 4-hour Volume Weighted Average Price, designed for traders who want higher timeframe insights without intrabar noise or repainting.
🔹 Key Features:
Non-Repainting: VWAP value is “frozen” at the close of each 4H candle — no mid-bar updates or flickering.
4H Timeframe Anchoring: Seamlessly pulls 4-hour VWAP values into any timeframe you’re trading on.
Clear Trend Reference: Updates only when a new 4H candle begins, acting as a trustworthy anchor for support/resistance.
Custom Source Option: Choose from different price sources (default: HLC3) to fit your strategy.
Whether you're scalping, day trading, or swing trading, this indicator gives you a powerful edge by grounding your decisions in higher timeframe VWAP data — clear, calm, and frozen in time.

Trend dealing rangeHi all!
This indicator will help you find the current dealing range according to the trend. If the trend is bullish the indicator will look for a range between the latest low pivot to the latest high pivot. Vice versa in a bearish trend. The code uses my new library 'FibonacciRetracement' () that has the same code as my other indicator 'Fibonacci retracement' ().
It plots 5 lines from the low to the high and labels them 0 %, 25 %, 50 %, 75 % and 100 %. A trendline can be drawn between the two pivots (dashed and gray by default). Firstly you can define the pivot lengths used, this setting is in the 'Market structure' section but it also applies to the dealing range (it defaults to 5 (left) and 2 (right)). You can show prices if you want to (shown in parantheses, off by default). You can change the default labels position (from left) and the font size (12 by default and higher up it's 7 for market structure text). Lastly you can change the alert frequency (defaults to once per bar close) and the price that has to enter a zone for alert to be sent. 'Close' means that the closing price (or current price if you change the alert frequency to all or once per bar) has to be inside the zone and 'Wick' means that the entire candle needs to be inside the zone.
It's very useful for traders to find the current dealing range and this indicator will help you to do so.
So, this indicator will give you the dealing range and basic market structure through break of structures and change of characters.
If you have any input or suggestions on future features or bugs, don't hesitate to let me know!
Best of trading luck!

Auto Trend Lines v1.0 This advanced Pine Script indicator automatically detects and draws support and resistance trendlines for any instrument based on two independent lookback periods—short-term and long-term—making it suitable for all types of traders. The indicator identifies pivot highs and lows for both user-configurable lookback lengths, draws trendlines from each anchor point to the current bar, and supports a visually intuitive chart by coloring and labeling each line type separately.
Key features:
Dual lookback: Choose separate short-term and long-term sensitivity for pivots and trendlines.
Customizable: Select the number of displayed lines, colors, and line widths to suit your preferences.
Auto-updating: Trendlines update dynamically with new pivots and extend to the latest bar.
This indicator is ideal for those who want to automate trendline analysis, spot key breakout and reversal areas, and streamline technical trading.

Script_Algo - ORB Strategy with Filters🔍 Core Concept: This strategy combines three powerful technical analysis tools: Range Breakout, the SuperTrend indicator, and a volume filter. Additionally, it features precise customization of the number of candles used to construct the breakout range, enabling optimized performance for specific assets.
🎯 How It Works:
The strategy defines a trading range at the beginning of the trading session based on a selected number of candles.
It waits for a breakout above the upper or below the lower boundary of this range, requiring a candle close.
It filters signals using the SuperTrend indicator for trend confirmation.
It utilizes trading volume to filter out false breakouts.
⚡ Strategy Features
📈 Entry Points:
Long: Candle close above the upper range boundary + SuperTrend confirmation
Short: Candle close below the lower range boundary + SuperTrend confirmation
🛡️ Risk Management:
Stop-Loss: Set at the opposite range boundary.
Take-Profit: Calculated based on a risk/reward ratio (3:1 by default).
Position Size: 10 contracts (configurable).
⚠️ IMPORTANT SETTINGS
🕐 Time Parameters:
Set the correct time and time zone!
❕ATTENTION: The strategy works ONLY with correct time settings! Set the time corresponding to your location and trading session.
📊 This strategy is optimized for trading TESLA stock!
Parameters are tailored to TESLA's volatility, and trading volumes are adequate for signal filtering. Trading time corresponds to the American session.
📈 If you look at the backtesting results, you can see that the strategy could potentially have generated about 70 percent profit on Tesla stock over six months on 5m timeframe. However, this does not guarantee that results will be repeated in the future; remain vigilant.
⚠️ For other assets, the following is required:
Testing and parameter optimization
Adjustment of time intervals and the number of candles forming the range
Calibration of stop-loss and take-profit levels
⚠️ Limitations and Drawbacks
🔗 Automation Constraints:
❌ Cannot be directly connected via Webhook to CFD brokers!
Additional IT solutions are required for automation, thus only manual trading based on signals is possible.
📉 Risk Management:
Do not risk more than 2-3% of your account per trade.
Test on historical data before live use.
Start with a demo account.
💪 Strategy Advantages
✅ Combined approach – multiple signal filters
✅ Clear entry and exit rules
✅ Visual signals on the chart
✅ Volume-based false breakout filtering
✅ Automatic position management
🎯 Usage Recommendations
Always test the strategy on historical data.
Start with small trading volumes.
Ensure time settings are correct.
Adapt parameters to current market volatility.
Use only for stocks – futures and Forex require adaptation.
📚 Suitable Timeframes - M1-M15
Only highly liquid stocks
🍀 I wish all subscribers good luck in trading and steady profits!
📈 May your charts move in the right direction!
⚠️ Remember: Trading involves risk. Do not invest money you cannot afford to lose!

Bardhi's ICT Killzone & PivotsThis indicator is a complete ICT-style session and liquidity toolkit designed for precision trading. It automatically marks the most important trading windows (“Killzones”) and provides powerful tools for tracking price action around them.
Key Features:
Killzones: Automatically plots Asia, London, and New York (AM, Lunch, PM) sessions with customizable colors, transparency, and labels.
Session Highs, Lows & Midpoints: Dynamic lines for killzone highs/lows, optional midpoints, and alerts when levels are broken.
Range Statistics: Displays the real-time range of each session plus rolling averages in a customizable table.
Day / Week / Month Levels: Plots opens, highs, lows, and separators for higher-timeframe reference points with optional alerts.
Custom Opening Prices: Define up to 8 custom open lines (e.g., True Day Open, 06:00, 10:00) with cutoff times.
Vertical Timestamp Lines: Highlight important intraday times such as news events or personal strategy triggers.
Day-of-Week Labels: Clean labels for each day, with the option to hide weekends.
Full Customization: Adjustable label sizes, colors, line styles, transparency, and drawing limits.
Why Use It?
This tool combines killzone sessions, pivots, higher-timeframe opens/highs/lows, and range statistics into one clean, automated package. It saves time drawing manually, keeps charts organized, and helps traders apply ICT concepts consistently.

Magic triangles ^v^v^vAddes filter to the indicator for better results.
Less triangles, filtered out unnecessary ones :)
Previous Days High & Low RTH Session by TenAM TraderPurpose:
This indicator plots the high and low levels of previous trading days’ Regular Trading Hours (RTH), helping traders identify key support and resistance zones based on historical price action.
How to Use / Strategy:
Designed as a super simple trading strategy:
Buy when price breaks above and confirms the previous day’s high.
Sell when price breaks below and confirms the previous day’s low.
Alerts notify you when price interacts with these levels, helping traders act on confirmed breakout opportunities rather than premature moves.
*Traders can also look for reversal opportunities if price breaks back through one of the levels.
Note: Make sure RTH (Regular Trading Hours) is turned on for the chart, as the indicator is based on RTH highs and lows.
Features:
Tracks previous days’ highs and lows.
Provides clear visual reference for support and resistance.
Simple, actionable strategy based on breakout confirmations and reversal plays.
Alerts for confirmed price breaks.
Disclaimer:
This indicator is for educational and informational purposes only. It does not provide financial advice. Trading involves risk, and past performance does not guarantee future results. Users trade at their own risk.

Script_Algo - Fibo Correction Strategy🔹 Core Concept
The strategy is built on combining Fibonacci retracement levels, candlestick pattern confirmation, and trend filtering for trade selection. It performs well on the 1-hour timeframe across many cryptocurrency pairs. Particularly on LINKUSDT over the past year and a half, despite the not very optimal 1:1 risk/reward ratio.
The logic is simple: after a strong impulse move, the price often retraces to key Fibonacci levels (specifically, the 61.8% level). If a confirming candlestick (pattern) appears at this moment, the strategy looks for an entry in the direction of the main trend.
🔹 Indicators Used in the Strategy
ATR (Average True Range) — Used to calculate the stop-loss and take-profit levels.
EMA (9 and 21) — Additional moving averages for assessing the direction of movement (not directly used in entry conditions, but the logic can be expanded to include them).
SMA (Trend Filter, 20 by default) — The trend direction filter. Trades are only opened in its direction.
Fibonacci Levels — The 61.8% retracement level is calculated based on the high and low of the previous candle.
🔹 Entry Conditions
🟢 Long (Buy):
Previous Candle:
Must be green (close higher than open).
Must have a body not smaller than a specified minimum.
The upper wick must not exceed 30% of the body size.
→ This filters out "weak" or "indecisive" candles.
Current Candle:
Price touches or breaches the Fibonacci 61.8% retracement level from the previous range.
Closes above this level.
Closes above the Trend Filter (SMA) line.
A position is opened only if there are no other open trades at the moment.
🔴 Short (Sell):
Previous Candle:
Must be red (close lower than open).
Must have a body not smaller than a specified minimum.
The lower wick must not exceed 30% of the body size.
Current Candle:
Price touches or breaches the Fibonacci 61.8% retracement level from the previous range.
Closes below this level.
Closes below the Trend Filter (SMA) line.
A trade is opened only if there are no other open positions.
🔹 Risk Management
Stop-Loss = ATR × multiplier (default is 5).
Take-Profit = ATR × the same multiplier.
Thus, the default risk/reward ratio is 1:1, but it can be easily adjusted by changing the coefficient. Although, strangely enough, this ratio has shown the best results on some assets on the 1-hour timeframe.
🔹 Chart Visualization
Fibonacci level for Long — Green line with circles.
Fibonacci level for Short — Red line with circles.
Trend Filter line (SMA) — Blue.
🔹 Strengths of the Strategy
✅ Utilizes a proven market pattern — retracement to the 61.8% level.
✅ Further filters entries using trend and candlestick patterns.
✅ Simple, transparent logic that is easy to expand (e.g., adding other Fib levels, an EMA filter, etc.).
🔹 Limitations
⚠️ Performs better in trending markets; can generate false signals during ranging (sideways) conditions.
⚠️ The fixed 1:1 risk/reward ratio is not always optimal and could be refined.
⚠️ Performance depends on the selected timeframe and ATR parameters.
📌 Summary:
The strategy seeks corrective entries in the direction of the trend, confirmed by candlestick patterns. It is versatile and can be applied to forex pairs, cryptocurrencies, and stocks.
⚠️ Not financial advice. Pay close attention to risk management to avoid blowing your account. The strategy is not repainting — I have personally verified it through real testing — but it may not necessarily replicate the same results in the future, as the market is constantly changing. Test it, profit, and good luck to everyone!

ICT Silver Bullet Zones (All Sessions)This Pine Script v6 indicator highlights the ICT Silver Bullet windows (10:00–11:00 local time) for all major forex/trading sessions: London, New York AM, New York PM, and Asia.
✅ Features:
Clearly visualizes Silver Bullet zones for each session.
Labels are centered inside each zone for easy identification.
Fully compatible with Pine Script v6 and TradingView.
Adjustable opacity and label size for better chart visibility.
Works on any timeframe and keeps historical zones visible.
Use Case:
Perfect for ICT strategy traders who want to identify high-probability trading windows during major market sessions. Helps in planning entries and understanding liquidity timing without cluttering the chart.
Instructions:
Add the script to your TradingView chart.
Adjust opacity and label size to suit your chart style.
Observe the SB zones for all sessions and plan trades according to ICT methodology.

OHLC Lines – Yesterday & Today (Minimalist Option)This indicator draws horizontal lines representing the Open, High, Low, and Close (OHLC) levels of yesterday and today directly on your chart. It automatically updates each day, showing only the lines for the previous day and the current day, keeping your chart clean and focused.
Features:
Display Yesterday’s OHLC levels.
Display Today’s OHLC levels.
Optional Minimalist Mode with customizable color, width, and line style.
Lines automatically update each day and remove old lines.
Fully customizable colors, visibility, and line width for each OHLC level.
Use Case:
Perfect for traders who want to monitor key daily price levels, identify support/resistance zones, or incorporate OHLC levels into intraday strategies.

LevelsThis Indicator is meant to plot some of the most common levels that traders use.
The display of these levels is highly customizable, as you can choose the line type , color , thickness and whether it shows you no label, price only, reduced label or full label next to the line. All labels (except for "no Label") will show the price at this level.
Also You have the option to mark the start on each timeframe with either a individually colored background or a vertical line where you can choose the line style and color.
Full List of available Levels and Optional inputs to these levels:
Previous HTF Candle Levels:
• Previous HTF Candle Open
• Previous HTF Candle High
• Previous HTF Candle Low
• Previous HTF Candle Close
Optional:
• Choose any higher timeframe
• Mark start of new HTF candle
Session Levels:
• Session Open
• Session High
• Session Low
• Session Close
Optional:
• Choose any time as start and end of your session
• Mark start of session
• Mark full session
Daily Levels:
• Current Day Open
• Current Day High
• Current Day Low
• Previous Day Open
• Previous Day High
• Previous Day Low
• Previous Day Close
Optional:
• Choose start of day (standard, NY Midnight, custom start time)
• Mark start of day
Weekly Levels:
• Current Week Open
• Current Week High
• Current Week Low
• Previous Week Open
• Previous Week High
• Previous Week Low
• Previous Week Close
Optional:
• Mark start of Week
Monthly Levels:
• Current Month Open
• Current Month High
• Current MonthLow
• Previous Month Open
• Previous Month High
• Previous Month Low
• Previous Month Close
Optional:
• Mark start of Month
