BTC Runner V1Bitcoin Runner V1 — advanced proprietary visual tool created specifically for long-term Bitcoin cycle research on 1D, 1W and 1M timeframes.
The indicator operates in two fundamentally different visual modes:
Buffett Mode (4-Year Halving Cycle Logic)
Fully built on Bitcoin’s historical ~4-year halving cycle. Using an original mathematical formula and real-time price data, the indicator continuously tracks whether the current cycle has reached the structural point that historically marked the final phase of previous bull markets.
As soon as ALL formula conditions are met for the first time:
- Chart background instantly changes color (green → red at cycle top, red → green at cycle bottom reversal)
- A large permanent non-repainting banner appears showing the exact date and price of the All-Time High (ATH) of the current cycle
- Fixed label “ATH” with price and timestamp is plotted and remains on the chart forever
Examples on charts:
- Chart #1 (20 Jan 2018) — green background still active, bull phase ongoing
- Chart #2 (22 Jan 2018) — exact moment all conditions triggered: background turns red + permanent ATH banner with unchangeable data appears
The same logic works in reverse when a bear cycle ends and a new bull cycle begins.
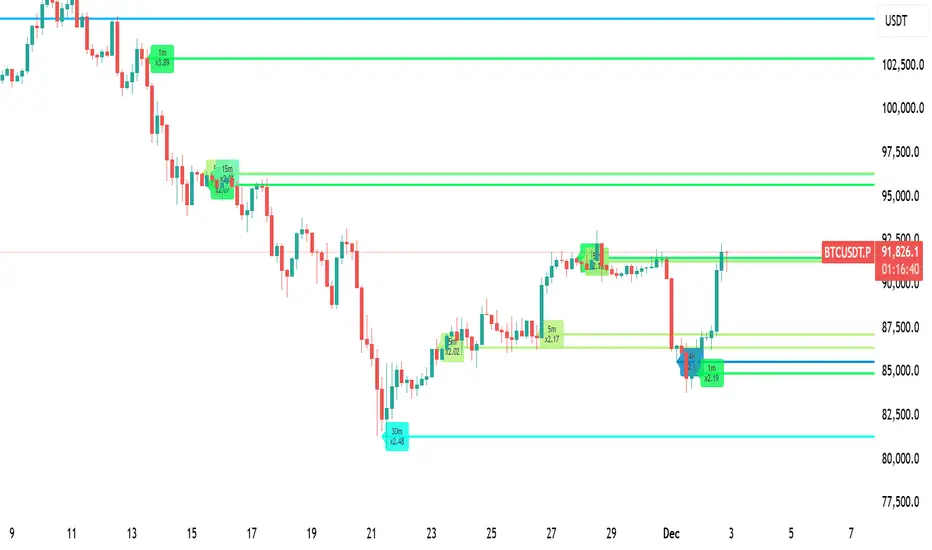
Cramer Mode (Historical Correction & Drawdown Zones Logic)
Based on over 10 years of personal observation of recurring percentage zones across multiple Bitcoin cycles:
• Major corrections historically reaching up to ~84% from local highs
• Intermediate drawdowns typically 20–55%
When ALL conditions of the multi-stage proprietary formula are satisfied for the first time after a prolonged decline or consolidation, the indicator automatically draws in real time:
1. Large green background banner with bold white text “AP” (Analyzed Point) — marking the price level where, according to many years of observation across several cycles, such deep corrections have historically completed.
2. Dynamic floating label “TP” (Tracked Progress) — a temporary price marker that moves with the current price in real time.
As soon as price touches or exceeds this level, the entire banner instantly and permanently turns blue and the text changes to “AP Completed”.
All banners, colors, and labels appear strictly automatically in live mode and never repaint.
Important:
- The script contains over 500 lines of completely original closed-source code.
- No standard indicators are used (moving averages, Fibonacci, waves, volume, volume profile, etc.). Only pure original mathematical modeling.
- The indicator is intended exclusively for research, educational, and informational purposes.
- It contains no trading recommendations, investment advice, or calls to action of any kind.
Respectful note to TradingView moderators and users:
If any visual elements or logic seem similar to previously published open-source scripts — feel free to use those open-source versions instead.
Bitcoin Runner V1 is a 100% original closed-source tool based on the author’s personal multi-year research and observations.
Punkty Pivota i Poziomy

Jerry's TrueDay Opening Ranges & H/L'sClick around. True Day H12 opening on Weekly and above, and H1 Attempted Direction Range on Daily.


Jerry's True-Open Opening-Ranges and High and Low MarkerShows the UTC Open for Sessions of (Yearly Monthly Weekly) levels, and their corresponding first 12 Hours of price trading as a broader level. Can toggle amount of previous sessions shown, their highs and lows of the session, sessions with shorthand labels, and level's labels (hopefully) overlapping. Can bring the last immediate session up to where price and time is currently.
On the Daily section, marks every 24 hours, the attempted direction in the first hour of price. With all the same logic.
Just take a look. TLDR like spaceman's but a bit different.

Institutional S/R Engine + Major FX Scanner v2.1This indicator is designed to map out institutional-style Support & Resistance zones and rank them by strength, so you can immediately see which areas on the chart actually matter.
Instead of drawing random horizontal lines, it automatically detects swing points, builds zones, and scores them based on how price has reacted there in the past. The goal is simple:
Help you focus on the most meaningful levels for entries, partials, and take-profit targets.
What it does
Auto-detects Support & Resistance zones
Uses swing structure to find major highs/lows and converts them into zones instead of thin lines, so you see “areas of interest,” not single magic prices.
Macro + Micro structure in one view
Separates higher-timeframe structure (macro) from local intraday structure (micro), letting you see the bigger picture and the immediate battle zone at the same time.
Zone strength scoring
Each zone is graded using factors such as:
Number of respected touches / reactions
How recently price interacted with the zone
How cleanly price reversed or continued from that level
Stronger zones are visually emphasized so your eye is drawn to the most important areas first.
ATR-aware zone widths
Zone size adapts to volatility, so levels don’t become absurdly thick in fast markets or razor-thin in slow ones. This helps keep zones realistic and tradable.
Clean, minimal visuals
Zones are plotted with clear colors and opacity so they are easy to see without cluttering your chart. You can tune transparency, line styles, and how many zones you want to see.
How to use it
This script is meant to be a decision-support tool, not a signal generator:
Use the strongest zones as:
Locations to plan trend continuation entries
Areas to look for exhaustion / fade behavior
Logical places for partials or final take-profit targets
Combine the zones with:
Your EMA stack or moving average framework
Volume / volatility tools
Candlestick behavior and market structure (HH/HL, LH/LL, breaks of structure)
The edge comes from confluence: strong zone + correct bias + clean price action.
The script will not tell you “buy” or “sell” – it shows you where the fight is most likely to matter.
Markets & Timeframes
Works on Forex, indices, commodities, crypto, and futures.
Timeframe-agnostic: can be used on higher timeframes for swing context and on intraday charts for execution.
Important note
This is an analytical tool only. It does not guarantee profit, and it is not financial advice. Always combine it with your own risk management, trade plan, and backtesting before using it in live markets.

Premarket LevelsThis indicator tracks premarket high and low levels for day trading, providing statistical analysis on how often these levels get touched during regular trading hours (9:30 AM-4:00 PM EST). It combines real-time level tracking with historical probability analysis and precise timing statistics to help traders make data-driven decisions. I use 4:00 - 9:30 AM on SPY/QQQ etc and 18:00 - 9:30 on Futures ES/NQ etc
Core Features
1. Premarket Level Tracking
Automatically identifies and plots premarket high and low levels
Displays levels with customizable colors and line styles
Shows optional midpoint and percentage/fibonacci retracement levels
Tracks when levels are set during premarket session
2. Historical Touch Analysis
Calculates probability of PM high/low being touched during regular hours
Tracks "Both Levels" touched rate (how often both get hit same day)
Tracks "Either Level" touched rate (how often at least one gets hit)
Adjustable lookback period (1-250 days) for statistical analysis
3. Timing Intelligence
Average time when levels get touched
Earliest and latest touch times in historical data
Four customizable time buckets showing touch distribution throughout the day
First touch time displayed for current session
4. Range Analysis
Current PM range vs historical average (adjustable period)
Range percentile ranking (where today ranks in historical distribution)
Min/Max historical ranges for context
Large/small range detection with customizable thresholds
Background highlighting for unusual range days
5. Smart Signals & Alerts
Buy/Sell signals on level breakouts (adjustable sensitivity)
Level rejection detection (failed breakout patterns)
Proximity alerts when approaching levels
Touch markers (diamond shapes) when levels are tested
Multiple alert conditions for various scenarios
6. Risk Management Tools
Automatic stop loss suggestions (ATR-based, percentage-based, or fixed points)
Target projections based on range extension
Position tracking relative to PM range
Distance calculations to both levels
How To Use
For Day Traders:
Check the "Either Level" percentage - if 90%+, at least one level will likely be touched
Review time bucket statistics - most touches happen 9:30-10:00 AM
Monitor "Both Levels" rate - typically only 20-30%, meaning round trips are rare
Use range percentile to gauge if expansion or mean reversion is likely
For Scalpers:
Enable touch markers to see exact level tests
Use proximity alerts to prepare for potential bounces
Monitor first touch times - early touches often lead to continuations
Check rejection signals for quick reversal trades
For Swing Position Sizing:
Use historical touch rates to assess probability of level tests
Review range size vs average for stop placement guidance
Check timing analysis to avoid holding through low-probability windows
Use target projections for realistic profit targets
Settings Overview
Basic Settings:
Premarket session time (default 4:00-7:30 AM EST)
Signal sensitivity for breakout detection
Timezone selection for accurate time labels
Historical Analysis:
Lookback period for statistics (default 20 days, max 250)
Toggle touch tracking and markers
Enable/disable daily statistics display
Range Analysis:
Adjustable average period (default 20 days)
Large/small range threshold customization
Range percentile display toggle
Timing Analysis:
Three customizable time buckets (default: 10:00, 11:00, 12:00)
Fourth bucket automatically covers afternoon (12:00-4:00 PM)
Toggle time bucket statistics display
Visual Features:
Midpoint line display
Percentage (25%, 75%) or Fibonacci (23.6%, 38.2%, 61.8%, 78.6%) levels
Table position and size customization
Comprehensive color scheme customization (background, text, headers)
Smart Alerts:
Proximity alerts with adjustable threshold
Level rejection detection
Failed breakout detector
Time-of-day filter to avoid lunch chop
Risk Management:
Stop loss method selection (ATR, PM Range %, Fixed Points)
Adjustable ATR multiplier
Target projection display
Statistics Explained
Touch Rates:
Percentage of days where level was touched during RTH
Based only on FIRST touch per day (not multiple re-tests)
Binary metric: Yes/No for each day
Timing Stats:
All based on timestamp of FIRST touch each day
Average, Earliest, Latest provide distribution context
Time buckets show concentration of first touches
Range Metrics:
Current range compared to historical average
Percentile shows where today ranks (0-100%)
Min/Max provide extreme boundaries from history
Important Notes
First Touch Only: All statistics track only the first time a level is touched each day, not subsequent re-tests
RTH Focus: Touch tracking occurs only during regular trading hours (9:30 AM-4:00 PM EST)
Data Accumulation: Historical statistics build over time as indicator runs; requires specified lookback period to populate
Chart Timeframe: Works on any timeframe but recommended 3-5 minute charts for best premarket level precision
Memory Reset: Each new premarket session resets tracking for fresh daily analysis
Best Practices
Use 60-100 day lookback for statistical significance
Combine high touch rates (80%+) with time bucket data for highest probability setups
Small ranges (< 50% of average) often lead to expansion moves
Large ranges (> 150% of average) often consolidate or mean-revert
First 30 minutes typically contains 50%+ of all level touches
After 12:00 PM, probability of untouched levels being hit drops significantly
Performance Considerations
Optimized for real-time calculation with minimal lag
Uses efficient array management for historical data
Table updates only on bar close for performance
Maximum lookback of 250 days to prevent memory issues
This indicator is for educational and informational purposes only. It is NOT financial advice.
The buy/sell signals are algorithmic suggestions based on historical patterns and should NOT be followed blindly
Past performance and historical statistics do NOT guarantee future results
All trading involves substantial risk of loss
You are solely responsible for your own trading decisions
Always perform your own analysis and risk assessment before entering any trade
The creator of this indicator is not responsible for any trading losses incurred from its use
No representation is being made that any account will or is likely to achieve profits or losses similar to those discussed in the indicator statistics
By using this indicator, you acknowledge that you understand these risks and accept full responsibility for your trading decisions.

PDH/PDL Sweep & Rejection - sudoPDH/PDL Sweep + Rejection
This indicator identifies classic liquidity sweeps of the previous day's high or low, then confirms whether price rejected that level with force. It is built to highlight moments when the market takes liquidity and immediately snaps back in the opposite direction, a behavior often linked to failed breakouts, engineered stops, or clean reversals. The tool marks these events directly on the chart so you can see them without manually watching the daily levels.
What it detects
The indicator focuses on two events:
PDH sweep and rejection
Price breaks above the previous day's high, overshoots the level by a meaningful amount, and then closes back below the high.
PDL sweep and rejection
Price breaks below the previous day's low, overshoots, and then closes back above the low.
These are structural liquidity events, not random wicks. The script checks for enough overshoot and strong bar range to confirm it was a genuine stop grab rather than noise.
How it works
The indicator evaluates each bar using the following logic:
1. Previous day levels
It pulls yesterday's high and low directly from the daily timeframe. These act as the PDH and PDL reference points for intraday trading.
2. Overshoot measurement
After breaking the level, price must push far enough beyond it to qualify as a sweep. Instead of using arbitrary pips, the required overshoot is scaled relative to ATR. This keeps the logic stable across different assets and volatility conditions.
3. Range confirmation
The bar must be larger than normal compared to ATR. This ensures the sweep happened with momentum and not because of small, choppy price movement.
4. Rejection close
A valid signal only prints if price closes back inside the previous day's range.
For a PDH sweep, the bar must close below PDH.
For a PDL sweep, the bar must close above PDL.
This confirms a failed breakout and a rejection.
What gets placed on the chart
Red downward triangle above the bar: Previous Day High sweep and rejection
Lime upward triangle below the bar: Previous Day Low sweep and rejection
The markers appear exactly on the bar where the sweep and rejection occurred.
How traders can use this
Identify potential reversals
Sweeps often occur when algorithms target liquidity pools. When followed by a strong rejection, the market may be preparing for a reversal or rotation.
Avoid chasing breakouts
A clear sweep warns that a breakout attempt failed. This can prevent traders from entering at the worst possible location.
Time entries at extremes
The markers help you see where the market grabbed stops and immediately turned. These areas can become high quality entry zones in both trend continuation and countertrend setups.
Support liquidity based models
The indicator aligns naturally with trading frameworks that consider liquidity, displacement, failed breaks, and microstructure shifts.
Add confidence to confluence-based setups
Combine sweeps with displacement, FVGs, or higher timeframe levels to refine entry timing.
Why this indicator is helpful
It automates a pattern that traders often identify manually. Sweeps are easy to miss in fast markets, and this tool eliminates the need to constantly monitor daily levels. By marking only the events that show overshoot plus rejection plus significant range, it filters out the weak or false signals and leaves only meaningful liquidity events.

Hash Pivot DetectorHash Pivot Detector
Professional Support & Resistance Detection with Multi-Timeframe Zone Analysis
Developed by Hash Capital Research, the Hash Pivot Detector is a sophisticated indicator designed for identifying key support and resistance levels using pivot-based detection with institutional-grade zone analysis.
Key Features
Zone-Based Detection
Unlike traditional single-line S/R indicators, Hash Pivot Detector uses configurable zones around pivot levels to represent realistic institutional order areas. Adjustable zone width accommodates different asset volatilities.
Multi-Timeframe Analysis
Displays higher timeframe support/resistance levels alongside current timeframe pivots, providing crucial context for institutional positioning and stronger price barriers.
Clean Visual Design
Features Hash Capital's signature fluorescent color scheme (pink resistance, cyan support) optimized for dark charts with high contrast and instant visual recognition. Semi-transparent zones keep your chart clean and readable.
How It Works
The indicator uses pivot high/low detection with configurable left and right bar parameters. When a pivot is confirmed, it plots:
Primary support/resistance lines at pivot levels
Semi-transparent zones representing realistic order areas
Higher timeframe S/R levels as crosses for additional context
Recommended Settings
For Swing Trading:
Pivot Bars: 10-20 left/right
Zone Width: 0.5-1.0%
HTF: Daily (on 1H-4H charts)
For Intraday Trading:
Pivot Bars: 5-10 left/right
Zone Width: 0.3-0.5%
HTF: 1H or 4H (on 5min-15min charts)
Asset-Specific Zone Width:
Forex/Crypto: 0.3-0.5%
Stocks: 0.5-1.0%
Volatile Assets: 1.0-2.0%
What Makes It Different
✓ Zone-based approach (more realistic than lines)
✓ Multi-timeframe confluence detection
✓ Minimal visual clutter with maximum information
✓ Professional institutional aesthetic
✓ Comprehensive tooltips for easy optimization
✓ No repainting - all pivots are confirmed
Best Used For
Identifying high-probability entry/exit zones
Setting stop-loss and take-profit levels
Recognizing breakout/breakdown areas
Multi-timeframe confluence analysis
Swing trading and position trading
Intraday scalping with adjusted parameters
Notes
Works on all timeframes and markets
Fully customizable colors and parameters
All settings include detailed optimization guidance
Clean code, efficient performance
No alerts or notifications (visual analysis only)

Wick Size Percentage (%) IndicatorA lightweight utility script that measures the wick size of every bar in percentages. It helps identify significant rejection blocks and volatility spikes by displaying the exact % value above and below each candle. Perfect for ICT concepts and precise risk management.
This indicator is designed for price action traders who need precise measurements of market volatility and rejection. It automatically calculates and displays the size of both the upper and lower wicks of a candle as a percentage relative to the open price.
Key Features:
Dual Measurement: Separately calculates the upper wick (high to body) and lower wick (body to low).
Percentage Based: Values are shown in percentages (%) rather than price points, making it easier to compare volatility across different assets (Crypto, Forex, Stocks).
Dynamic Labels: Visual labels appear above and below the candles for quick reading.
Fully Customizable: Users can adjust the decimal precision (e.g., for low timeframe scalping), change text size, and toggle visibility to keep the chart clean.
Data Window Support: Values are also visible in the side Data Window for detailed analysis without clutter.

Flow Dynamics Pro [ChartNation]Flow Dynamics Pro - Institutional Order Flow Zones
Detect high-probability institutional rejection zones with advanced volume analysis and confluence scoring.
Flow Dynamics Pro identifies institutional order flow zones where smart money enters and defends positions. Unlike traditional order blocks or supply/demand indicators, this tool combines multiple confirmation factors into a single confluence score, helping you focus on the highest-quality setups.
🎯 KEY FEATURES
Institutional Zone Detection
Volume spike analysis (customizable threshold)
Rejection wick detection (upper/lower wick ratios)
Market structure validation (swing high/low alignment)
Multi-factor confluence scoring (0-100 scale)
Visual Volume Distribution
Bull/bear volume split displayed inside each zone
See the exact buying vs selling pressure at institutional levels
Percentage breakdowns for quick analysis
Toggle on/off based on preference
Smart Zone Management
Automatic zone invalidation when broken with volume
Zone test tracking (shows how many times zones held)
Visual strengthening (borders thicken after successful tests)
Overlap prevention (maintains minimum spacing between zones)
Maximum zone limit (keeps chart clean)
Confluence Scoring System
Zones are scored 0-100 based on:
Volume Strength (30 points) - How significant was the volume spike
Market Structure (25 points) - Alignment with swing points
Zone Quality (25 points) - Wick ratio and pressure imbalance
Size Quality (20 points) - Optimal zone size relative to ATR
Zones are categorized as:
⚡ PREMIUM (80+) - Highest quality setups
🔥 STRONG (60-79) - Solid institutional zones
✓ MODERATE (40-59) - Valid but lower confluence
Timeframe Adaptive
Automatically adjusts detection sensitivity based on timeframe:
On 1H and lower: Stricter requirements (reduces noise)
On 4H and higher: Standard sensitivity (catches major zones)
Works on all timeframes from 1-minute to Monthly
Multi-Timeframe Context
Display higher timeframe zones for broader market context
Customizable HTF timeframe selection
Dashed visualization to distinguish from current timeframe zones
Comprehensive Alerts
Premium zone created (score 80+)
Price entering zone
Price exiting zone
Zone tested successfully
Zone invalidated
⚙️ SETTINGS OVERVIEW
Detection Settings
Volume Spike Threshold (default: 1.2x)
Minimum Wick Ratio (default: 0.3)
Structure Validation toggle
Detection Lookback period
Invalidation Settings
Require volume for invalidation (toggle)
Invalidation volume threshold (default: 1.2x)
Customizable to match your trading style
Display Settings
Maximum zones to display (default: 8)
Show/hide labels
Show/hide volume data
Volume distribution toggle
Label size adjustment (Small/Normal/Large)
Minimum zone spacing % (prevents overlaps)
Minimum confluence score filter (default: 55)
Visual Customization
Bullish zone color and opacity
Bearish zone color and opacity
Border colors
Multi-timeframe zone colors
📊 HOW TO USE
For Swing Traders (4H, Daily)
Focus on PREMIUM zones (score 80+)
Look for zones with multiple successful tests
Enter on retests with confirmation
Use HTF zones for broader context
For Intraday Traders (1H, 15m)
Use higher confluence minimum (60-65)
Increase zone spacing to reduce clutter
Focus on zones with clear volume distribution
Combine with price action for entries
Zone Test Interpretation
Tested 0x: Fresh zone, untested
Tested 1-2x: Gaining strength
Tested 3+x: Highly defended level (thicker borders)
Volume Distribution Guide
80%+ on one side: Strong directional bias
60-70% dominance: Moderate bias
50-50 split: Contested area, use caution
🔧 BEST PRACTICES
Combine with trend: Trade zones in direction of higher timeframe trend
Wait for confirmation: Don't enter blindly at zone touch
Respect invalidation: When zones break with volume, they're done
Use confluence scores: Prioritize scores 70+ for highest win rate
Manage spacing: Adjust spacing % if chart feels cluttered
Check timeframe: Lower timeframes may need stricter settings
🎓 UNDERSTANDING THE INDICATOR
What are Institutional Zones?
Areas where large players (institutions, market makers, smart money) have entered positions and actively defend them. These show up as:
High volume rejection wicks
Multiple tests that hold
Clear buying/selling pressure imbalance
Why Confluence Scoring?
Not all zones are equal. The 0-100 scoring system helps you quickly identify which zones have the most confirmation factors aligned, saving time and improving trade selection.
Why Zone Spacing Matters
Too many overlapping zones create analysis paralysis. The spacing filter ensures you see only distinct, meaningful levels.
📈 TECHNICAL DETAILS
Indicator Type: Overlay
Max Boxes: 500
Max Labels: 500
Pine Script Version: 6
Real-time Updates: Yes
Alerts: 5 types available
Repainting: Zones finalize on bar close
🚀 GET STARTED
Add indicator to chart
Adjust confluence minimum (55-65 recommended)
Set volume threshold for your instrument (1.2-1.5)
Customize colors to match your theme
Enable alerts for your preferred signals
Trade with proper risk management
💡 TIPS
Start with default settings and adjust based on results
Higher timeframes = more reliable zones
Premium zones (80+) have best risk/reward
Tested zones (3+) show strong institutional defense
Use zone invalidation as stop-loss reference
Flow Dynamics Pro is part of the ChartNation indicator suite - delivering institutional-grade tools for serious traders.

Swing Trading System v5 - Dynamic SL/Targets with LabelsThe Swing Trading System v5 is a fully-automated swing-trend framework designed to identify high-confidence breakout entries, generate dynamic stop-loss and target levels, and visually label actionable trade zones on the chart.
It adapts to market conditions using structure breaks, EMA trend filters, candle confirmation, and volume expansion signals.
Core Features
1. Swing Breakout Engine (Structure-Based)
The system detects short-term swing highs/lows and evaluates whether price has broken out above resistance or broken down below support.
A directional bias is established using a structure-based confirmation variable and automatically updated trailing stop logic.
2. Trend Filter (EMA 20/50/200)
To avoid counter-trend trades, the engine uses:
EMA-200 for primary trend direction
EMA-20 and EMA-50 for near-term momentum
Signals align only when structure breaks AND the major trend confirm each other.
3. Candle Confirmation
Entry signals require classical reversal momentum patterns:
Bullish Engulfing for long trades
Bearish Engulfing for short trades
This filters out weak structure breaks and ensures institutional momentum.
4. Volume Confirmation
Volume must exceed a configurable SMA-based threshold.
This prevents false signals during low-liquidity or consolidation phases.
Signal Logic
Long Signal Triggers
A Buy signal is printed when:
Price crosses above the dynamic trailing stop (swing resistance)
Price is above EMA-200 (bull trend)
Candle forms a bullish engulfing confirmation
Volume > SMA(10) × Multiplier
Short Signal Triggers
A Sell signal occurs when:
Price crosses below the dynamic trailing stop (swing support)
Price is below EMA-200 (bear trend)
Candle forms a bearish engulfing confirmation
Volume expansion confirms downside momentum
Dynamic Stop-Loss & Profit Targets
When a signal triggers, the system automatically calculates:
Stop-Loss (SL):
Long trades: last swing low
Short trades: last swing high
Target 1 (TP1): 1.5R relative to swing distance
Target 2 (TP2): 3.0R for trend continuation moves
SL, TP1, and TP2 are displayed on-chart using extended line plots and right-side labels for clean visualization.
Labels for old signals are automatically deleted to keep the chart uncluttered.
Visual Components
The indicator provides:
BUY/SELL signal labels
Dynamic SL, TP1, TP2 lines with color coding
SL/TP labels positioned at the end of each new trade
Clean breakout detection based on structural pivots
All elements update automatically as new swings form.
Intended Use
This system is built for:
Swing Traders
Systematic Discretionary Traders
Trend Followers
Breakout/Momentum Traders
Works well on:
Stocks
Crypto
Forex
Indices
Commodities
Optimal timeframes: 1H, 4H, Daily, Weekly
Summary
The Swing Trading System v5 provides:
High-quality breakout entries
Trend-aligned signals
Volume-filtered confirmation
Automated risk-reward generation
Clean and dynamic chart labels
A complete, self-contained swing-trading solution for systematic execution and disciplined risk management.

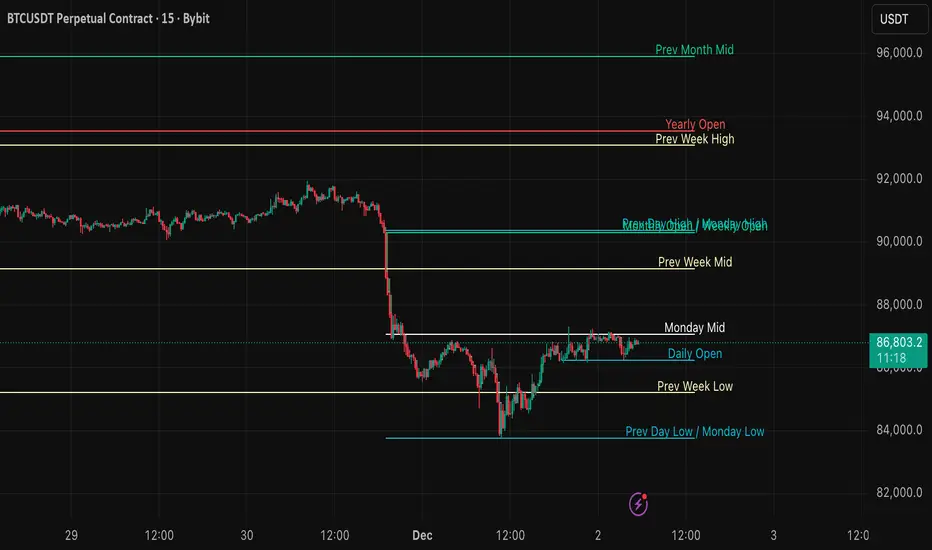
Session important reference linesThis indicator automatically plots crucial price reference points for the Regular Trading Hours (RTH) session, including Yesterday's High/Low/Close, Session Open, Midpoint, and the Initial Balance (IB) range with its 2x extension .
In the example above the lines are:
Dotted green - Today's open price
Dashed yellow - Today's mid line
Solid yellow - Initial Balance high/low
Dotted yellow - Initial Balance extension
Dotted dark green - Previous session high
Dotted dark red - Previous session low
Dotted orange - Previous session close

LiquidityPulse Multi-Timeframe Volume Zones/ LevelsLiquidityPulse Multi-Timeframe Volume Zones/ Levels
Non-repainting: levels appear on bar close and do not change.
What This Indicator Does
This indicator scans lower-timeframe price action to identify bars where volume and candle behaviour suggest that a notable price interaction occurred. When all conditions align, the script extracts a precise price level from that bar, plots it on your higher-timeframe chart, and extends it forward so you can observe whether the market interacts with it again later.
Each selected timeframe is processed independently. For every timeframe you enable, the script looks for the following criteria:
1. A shift in candle direction between the previous bar and the current bar
2. A close-to-open body alignment , helping filter out irregular or noisy movement
3. A volume increase relative to the recent average , based on a user-selected multiplier
If these conditions are met, the script marks the corresponding price level on the chart. You can enable up to seven lower timeframes at once, each with its own independent settings, colours, strength filters, and display capacity. This allows you to build a layered, multi-timeframe view of the levels/ zones.
How It Works
1. Candle Behaviour Shift
The script checks whether the previous bar and the current bar show opposing directional behaviour. This helps highlight moments that may reflect a shift in directional behaviour or a change in price movement characteristics.
2. Body Alignment
The previous bar’s close must closely align with the current bar’s open. This requirement reduces random noise and focuses detection on areas where structure between candles is unusually clean.
3. Volume Requirement
The combined volume of the current bar and the previous bar must exceed the recent average by a multiplier you choose.
Lower multiplier - more levels
Higher multiplier - only the most significant activity spikes qualify
This filters for bars with above-average participation (volume).
4. Price Level Identification
If all conditions are met, a price edge is defined:
Bearish pressure: upper edge
Bullish pressure: lower edge
This edge marks the price level where the qualifying candle behaviour occurred.
5. Zone Drawing
Each qualifying event produces:
A horizontal line marking the level
A (optional) shaded box around the level
A label showing the timeframe and the exact volume multiplier amount detected
The level then extends forward so you can monitor future interactions.
Key Settings
Zone Strength (Volume Multiplier)
Determines how selective the volume filter is.
Lower settings show more frequent activity
Higher settings restrict detection to only the strongest activity (volume) increases
Multi-Timeframe Framework
Enable/disable per timeframe
Custom source timeframe (e.g., 1m, 5m, 15m, etc.)
Strength threshold per timeframe
How many recent levels to display per timeframe (Show Last N Zones.)
You can display a single timeframe or stack several to highlight clustering.
How traders can use this indicator
This script is not a buy/sell signal generator. It is best used as a structural overlay that helps you identify:
Where candle behaviour abruptly shifted with increased volume
Whether multiple timeframes highlight similar levels
Comparing how frequently these conditions appear across different timeframes
How price behaves when revisiting areas of prior activity (levels)
Why this type of detection can be informative
Higher-timeframe charts compress a large amount of lower-timeframe activity. By identifying where the script found notable changes in direction, structure, and relative volume on a lower timeframe, it provides a way to reference points in the price history where behaviour differed from nearby bars. Displaying these levels on a higher timeframe allows traders to see how these conditions align with their broader analysis.
Disclaimer
This indicator does not measure true liquidity or order flow. It uses candle structure and relative-volume comparisons as interpretive tools, and the plotted levels do not represent signals or predictions. All analysis is user-interpreted, and past behaviour does not imply future behaviour.
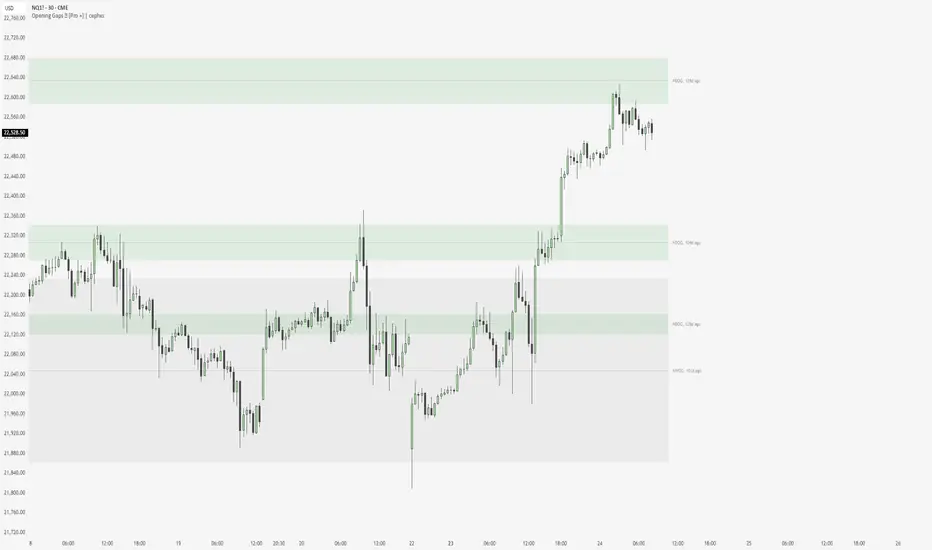
NWOG & NDOG - Opening Gaps 🧪 [Pro +] | cephxsNWOG & NDOG - OPENING GAPS 🧪
Smart Gap Detection with Intelligent Filtering
Visualizes New Week Opening Gaps (NWOGs) and New Day Opening Gaps (NDOGs) with built-in intelligence to show you only what matters. No more cluttered charts with gaps from 3 months ago that price will never revisit.
The Display chart is on default settings with the size filter set to "Juicy Gaps only"
THE PROBLEM WITH GAP INDICATORS
Most gap indicators dump every single gap on your chart and call it a day. You end up with 100+ boxes cluttering your screen, half of which are miles away from current price and the other half are so tiny they're basically noise.
This one's different (That's what they all say).
SMART FILTERING (THE GOOD STUFF)
Two filters work together to keep your chart clean:
Size Filter: Uses ATR-based detection to filter out insignificant gaps
- Filter None: Show everything (if you really want chaos)
- Filter Insignificant: Hide the micro-gaps that don't matter
- Juicy Gaps Only: Only show gaps worth paying attention to (Mostly for HTF trading)
Distance Filter: Only displays gaps within range of current price
- Really Close: 0.5 ATR - tight focus on immediate levels
- Balanced: 1 ATR - sweet spot for most traders
- Slightly Far: 3 ATR - wider view for swing traders
- ✨ Or just turn off the filter by distance and it becomes like other indicators ✨
The magic: gaps appear and disappear as price moves toward or away from them. Old gaps that price has left behind fade out, and gaps that become relevant fade back in. Remove auto scaling if price is not trending and gaps keep flashing in and out.
GAP TYPES EXPLAINED
New Week Opening Gaps (NWOGs):
The gap between Friday's close and Monday's open. These form over the weekend when markets are closed and often act as significant support/resistance.
Two classifications:
Void Gaps: Gap direction aligns with Friday's candle direction (continuation)
Overlap Gaps: Gap direction conflicts with Friday's candle (potential reversal)
New Day Opening Gaps (NDOGs):
The gap between one day's close and the next day's open. Smaller but frequent - useful for intraday traders looking for fill targets.
FEATURES
Automatic Week/Day Detection: Handles forex (17:00 ET open) and futures (18:00 ET open) correctly
DST-Aware: Uses New York timezone with automatic daylight saving adjustments
50% Equilibrium Line: Marks the midpoint of each gap - key level for entries
Days Ago Labels: Shows how old each gap is at a glance
Extension Modes: Choose between live-extending boxes or fixed-width boxes
Separate Color Schemes: Different colors for void vs overlap NWOGs, bullish vs bearish NDOGs
INPUTS
NWOG/NDOG Display
Show NWOGs / NDOGS: Master toggle
Extension Modes:
Maximum NWOGs: Limit displayed gaps
Show Void/Overlap Gaps: Toggle each type independently
Filter Settings
Size Filter:
Only Show Near Price: Enable/disable distance filtering
Distance Filter: Really Close / Balanced / Slightly Far
Styling
Box Transparency: Fill and border opacity
Midline Style: Solid / Dotted / Dashed
Label Style: Simple ("NWOG, 5d ago") or Descriptive ("NWOG (Void Bull), 5d ago")
Label Size: Tiny / Small / Normal / Large
RECOMMENDED SETTINGS
For intraday (1m-15m):
Size Filter: Filter Insignificant
Distance Filter: Really Close or Balanced
Show NDOGs: On
Maximum NDOGs: 5-10
For swing trading (1H-4H):
Size Filter: Juicy Gaps Only
Distance Filter: Balanced or Slightly Far
Show NWOGs: On
Maximum NWOGs: 10-20
TIMEFRAME NOTES
Works on daily timeframe and below. Above daily, the indicator disables itself since NWOG/NDOG gap detection requires daily open/close data.
ASSET SUPPORT
Automatically handles different market open times:
Forex:
Futures:
Stocks/indices:
FAQ
Why do gaps appear and disappear?
That's the distance filter working. As price moves, gaps that were far away become relevant and appear. Gaps that price leaves behind disappear. This keeps your chart focused on actionable levels.
What's the difference between void and overlap gaps?
Void gaps continue Friday's direction (trend continuation). Overlap gaps conflict with Friday's direction and don't actually have a volume gap in price. Different traders prefer different types so i chose to differentiate them.
Why can't I see any gaps?
Check your filter settings. "Juicy Gaps Only" with "Really Close" distance filter is very selective. Try "Filter Insignificant" with "Balanced" for more gaps. Or simply turn off the filter if you are on an asset that has very few/no gaps... The indicator has gone through rigorous testing.
DISCLAIMER
This indicator is for educational purposes only. Opening gaps are one tool among many - they don't guarantee fills or reversals. Always use proper risk management and never trade based on a single indicator. Past gap fills don't guarantee future performance. Do your own analysis.
CHANGELOG
Pro +: Added smart size/distance filtering, void/overlap classification, NDOG support, DST-aware timezone handling. Tradingview handles the actual time shift.
Base: Initial NWOG visualization
Made with ❤️ by cephxs
SVE Pivot PointsSVE Pivot Points are a modified variation of traditional pivot points created by Sylvain Vervoort (SVE). They are designed to adapt more dynamically to price volatility and short-term market structure, giving traders more responsive support and resistance levels.
Unlike standard floor pivots that rely only on the previous period’s high/low/close, SVE Pivot Points incorporate volatility-based smoothing, making the levels more stable during choppy markets and more reactive when volatility expands.
1. Volatility-Adaptive Formulas
SVE uses smoothing techniques (often EMA-based or Vervoort’s proprietary volatility filters) that adjust to current market noise.
This reduces false levels and gives clearer reaction zones.
2. Dynamic Support & Resistance
You still get:
• Pivot (P)
• Support levels (S1, S2, S3)
• Resistance levels (R1, R2, R3)
But they update based on volatility-weighted highs/lows instead of raw numbers.
3. More Reliable in Intraday Trading
SVE pivot points were designed to:
• Improve accuracy
• Reduce whipsaw
• Give better intraday turning points
This is why they’re popular among futures, forex, and index traders.

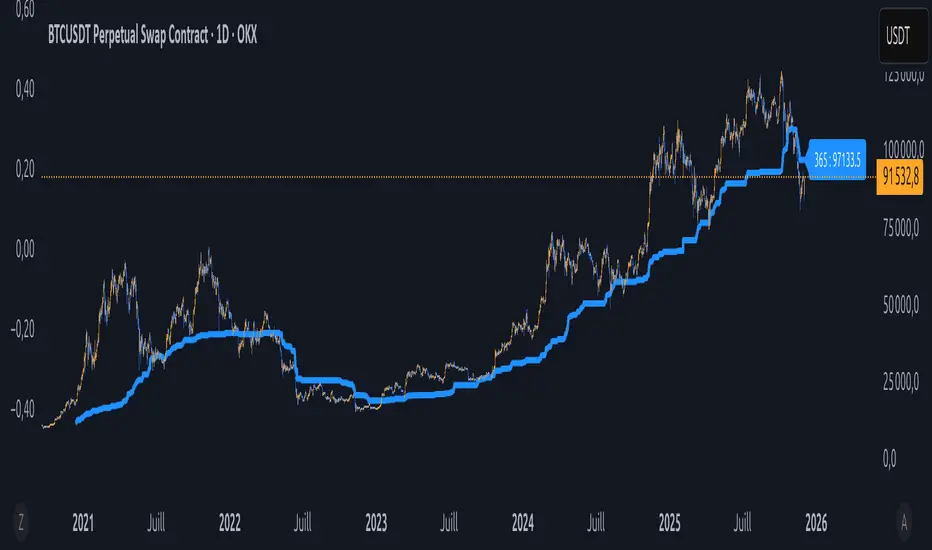
Équilibre du Sentiment – Multi-Périodes (v6)
English
A unique and advanced sentiment indicator based on the harmonic mean of highs and lows over nested rolling windows.
How it works:
The neutral sentiment point is reached when positive sentiment equals negative sentiment, which corresponds to the situation where the percentage between the price and the minimum is equal to the percentage between the maximum and the price.
For each chosen period N, the script calculates N different "neutral feeling" values:
- One using the last 1 bar
- One using the last 2 bars
- …
- One using the last N bars
It then extracts the exact median of these N values using a sorted insertion method (no approximation).
This produces an extremely smooth, non-repainting equilibrium line that represents the true "central sentiment" of the market over the selected lookback.
Features:
- Up to 3 independent periods (365, 52, 26 by default – fully customizable)
- Optional background coloring (green/red) when price is above/below the main curve
- Clean labels on the last bar showing the current value for each active period
- Zero repainting – fully compatible with strategies and alerts
- Highly responsive even with very long periods (up to 3500 bars)
Great for:
- Identifying long-term fair value / equilibrium zones
- Building mean-reversion or breakout systems
Pure Pine Script® v6 – no external libraries, no security calls, no repainting-free.
BADSHAHI TRADINGTradingView indicator that posts buy and sell signals along with support and resistance levels, you need to develop a Pine Script that identifies key support and resistance levels and then displays buy and sell signals based on certain conditions. Here's a breakdown of how to approach this:
1. Support and Resistance Basics
Support and resistance are critical concepts in technical analysis:
Support: This is a price level where an asset tends to find buying interest, preventing the price from dropping further.
Resistance: This is a price level where selling pressure tends to increase, preventing the price from rising further.
To detect support and resistance, we typically use methods like pivot points, recent swing highs/lows, or price levels that have repeatedly reversed direction in the past.
2. Buy and Sell Signals
Buy and sell signals are often generated based on certain criteria like:
Price crossing above or below a moving average
Candlestick patterns (like Doji, engulfing)
Breakouts from support/resistance levels
In this example, we’ll consider a simple strategy where:
Buy signal is generated when the price breaks above resistance.
Sell signal is generated when the price breaks below support.
________________________________________
Warning:
• While this indicator aids in decision-making and risk management, no indicator is 100% accurate.
• Always consider broader market conditions and apply sound risk management techniques.

High-Res VP + Macro Auto Fib DJVolume profiling plus Fibonacci for the descrationary trader.
Volume profile: The most important tool that I know.
Fib: Gives you an idea of the moves.

HTF OHLC Candle + 50% @MaxMaserati 3.0HTF OHLC Candle + 50% MaxMaserati 3.0
This powerful, all-in-one indicator allows traders to visualize the Open, High, Low, Close (OHLC) structure and the critical 50% Midpoint (Equilibrium) of up to four different Higher Timeframes (HTFs) directly overlaid onto the current chart. Stop switching timeframes and start seeing the complete market structure at a glance!
✨ Core Features & Trader Benefits
1. 🌐 Comprehensive Multi-Timeframe Context
Visualize the past and present candle structure of four independently configurable timeframes (TF1, TF2, TF3, TF4). This eliminates manual charting and provides an immediate understanding of macro market ranges and directional bias.
TF1 OHLC LIVE: Focuses on the current, forming candle of a major timeframe (e.g., the current Daily candle) to show where price is trending relative to its open and range.
TF2-TF4 OHLC Boxes:Display both the closed historical candles (up to 10 previous boxes) and the current, forming candle for deep structural reference.
2. 🎯 Critical Level Projection (OHLC & 50%)
The indicator automatically projects and extends key price levels from each higher timeframe candle across your current chart, making them highly visible reference points.
|High (H) / Low (L): Marks the full structural range (wick to wick).
Open (O) / Close (C): Defines the body and the direction of the candle. Price magnet targets and momentum entry/retests.
50% Midpoint: The Equilibrium of the candle's range. Optimal Trade Entry (OTE) zones, potential support/resistance, and fair value flip points.
3. 🎨 Advanced Customization & Aesthetics
Every element of the indicator is highly customizable to match your preferred trading style and chart theme:
Custom Color Schemes: Independently set Bullish and Bearish body/wick colors for each of the four timeframes.
Aesthetic Clarity: Configure the size and placement of Timeframe Labels (e.g., "H4 50%") on the extended lines to maintain visual organization.
Line Styling: Adjust the color, transparency, and thickness for every individual level (Open, High, Low, 50%) across all four timeframes.
4. 🧹 Chart Management
With controls for `Max Boxes` and separate toggles for showing the current vs. closed OHLC lines, you can prevent chart clutter and focus only on the structural context relevant to your strategy.

SPY SRX S&R Levels - Premium EditionSRX SPY Predictive Support & Resistance Levels
SRX is not a typical TradingView support/resistance indicator.
These levels are not calculated on TradingView at all . Instead, every morning after market open, nearly 20,000 data points are analyzed externally to determine where SPY is statistically most likely to react.
This produces support and resistance levels that are hyper-accurate, mathematically derived, and consistently respected intraday , not hand-drawn guesses or generic indicator outputs.
On top of that, SRX plots dynamic volatility-based zones around each major level so you can catch moves that don’t hit the level penny-perfect.
SRX also generates Buy/Sell Arrows during trending conditions and Buy/Sell Circles during non-trending or early-trend conditions.
Arrows = higher-probability trend-aligned setups.
Circles = lower-confidence ideas that can often be scalped on 1m–3m charts.
This tool is built for traders who want clarity, precision, and the ability to anticipate key reactions on SPY with confidence.
Features:
Externally Calculated SRX Levels: Nearly 20,000 data points analyzed daily to produce statistically significant support & resistance levels.
Dynamic Volatility Zones: Capture moves that don’t hit levels perfectly with automatically adjusting upper/lower zones.
Expected Daily Range: Session high/low projections based on historical and current volatility.
Support Levels (S1–S4): Up to four graduated support zones for precision planning.
Resistance Levels (R1–R4): Up to four graduated resistance zones built from the same predictive model.
Premarket High/Low (PMH/PML): Toggleable levels from premarket session.
Previous Day High/Low (PDH/PDL): Quickly mark the prior day’s key reaction points.
Previous Day Open/Close (PDO/PDC): Additional contextual levels (toggle on/off).
Buy/Sell Arrows: Trigger when price interacts with both the EMA and an SRX level/zone in trending conditions.
Buy/Sell Circles: Trigger in non-trending environments — lower confidence but often scalp-friendly.
EMA Overlay: Adjustable EMA used for signal confirmation (default length 8).
Runway Filter: Optional filter that improves signal quality by measuring available “runway” before the next SRX level.
Near EMA Touch Logic: Helps detect momentum shifts and avoid false signals.
Bias Filter: Determines whether the market is trending up, trending down, or neutral — off by default but extremely powerful.
Historical Data Section: View previous SRX levels for backtesting and strategy review.
Customizable Appearance: Colors, transparency, labels, arrows, zone styling and more.
Built-In Alerts:
Zone/Level Touch or Cross
PMH/PML Touch or Cross
PDH/PDL Touch or Cross
PDO/PDC Touch or Cross
Max-Range High/Low Reached
Buy/Sell Arrow Signals
How to Use:
Copy the daily SRX data string from the official Discord channel.
Paste it into the “SRX Levels Input” field inside the indicator settings.
Customize colors, zones, EMA, signals, and filters to match your trading style.
Use SRX support/resistance levels as the foundation for intraday setups.
Use Arrows when the market is trending and the bias is clear.
Use Circles cautiously during choppy or unconfirmed conditions (often great for scalp entries on 1m/3m).
Optionally enable alerts for level reactions or signal prints.
Ideal For:
Intraday traders who rely on precise support/resistance
SPY scalpers seeking high-probability reaction zones
Momentum traders catching breakouts or bounces
Traders who want statistical structure, not subjective drawings
Important Notes:
SRX levels are calculated externally using proprietary models.
This indicator requires a paid subscription to access the daily SRX support/resistance data.
Daily levels are delivered through our private Discord.
Without the SRX daily data string, the indicator will not display levels.
You can join here to get access to the SRX Levels feed:
stockalertsreviewed.clickfunnels.com
SRX currently works exclusively with SPY (as of Dec 2025). We plan to expand to additional tickers in 2026.
Buy/Sell signals are trade ideas — always confirm with market context.

new alertable spacemanhope these alerts work. open to fixes
slight modification to Key Levels SpacemanBTC IDWM script
credit: spacemanbtc
Forex indicator By petran Elevate your market analysis with this powerful, all-in-one visual toolkit designed for discretionary traders across Forex, indices, and commodities (metals).
Core Features:
Trading Sessions Overlay: Clear visual bands highlighting the Asian, London, and New York trading sessions directly on your chart. Never miss a market open or a session overlap again.
Smart Daily Levels: Automatically plots the most essential reference points from the previous day:
PDH / PDL (Previous Day High/Low) – Key support and resistance.
PWH / PWL (Previous Week High/Low) – Higher timeframe context.
DO (Day Open) – A crucial intraday pivot level.
Motivational Watermark: A unique and customizable text overlay at the top of your screen. Display your favorite trading quote, rule, or reminder to maintain the right mindset during the trading day.
Clean & Customizable: Designed for clarity. Adjust colors, session times, and watermark text to fit your personal trading style and chart aesthetics.
Why Traders Choose This Indicator:
Saves Time: No more manually drawing sessions or calculating yesterday's levels.
Improves Discipline: The visual sessions and watermark help you trade only during your planned times and follow your rules.
Universal Application: Works seamlessly on any liquid market where session activity and daily ranges matter.
Perfect for traders who rely on price action, session-based strategies, and need a clean, informative chart environment.

DWM HLOC, Mid & WicksSimple, yet effective.
1. Automatically calculate and projects key price levels from a previous period (Yesterday, OR Last Week / Month) onto the current trading session. It acts as an immediate Support & Resistance map based on historical price action.
2. Multi-Timeframe Logic
Modes --
Daily Mode: Projects yesterday's data onto today.
Weekly Mode: Projects last week's data onto the current week.
3. Key Levels Visualized The script calculates seven distinct price levels:
OHLC: Previous Open, High, Low, and Close.
Equilibrium (Mid): The exact 50% mark between the previous High and Low.
Wick Midpoints (New):
Upper Wick 50%: The midpoint between the High and the top of the body.
Lower Wick 50%: The midpoint between the Low and the bottom of the body.
4. Smart "Gap" Visualization The script uses unique starting points to help traders visualize market gaps:
Standard Levels (High, Low, Open, Mids): These lines originate from the Previous Period's Open, showing the full context of the level relative to time.
Close Level: This line originates from the Current Period's Open. This visually highlights the "Gap" (the jump in price between where the market closed previously and where it opened today).
5. Full Customization
Aesthetics: Every line can be individually toggled on/off.
Styling: Users can independently change the color, line style (Solid, Dotted, Dashed), and thickness for every specific level.
