Svl - Trading SystemPrice can tell lies but volume cannot, so keeping this in mind I have created this indicator in which you see sell order block and buy order block on the basis of price action + volume through which we execute our trade
First of all, let us know its core concepts and logic, which will help you in taking the right decisions in it.
core concept of the " Svl - Trading System " TradingView indicator is based on professional price action, volume, and swing structure. This indicator smartly gives real-time insights of important price turning points, reversal zones, and trend continuation. Its deep explanation is given below.
Edit - default swing length -5 , change according your nature , tested With 7 For 5 minute timeframe
Core Concept:
1. Swing Structure Detection
The indicator automatically detects swing highs (HH/LH) and swing lows (HL/LL) on the chart.
HH: Higher High
HL: Higher Low
LH: Lower High
LL: Lower Low
These swings are the backbone of price action – signaling a change in trend, a bounce, reversal or trend continuation.
2. Order Block (OB) Mapping
Buy Order Block (Buy OB): When the indicator detects the HL/LL swing, we declare Buy OB, the lowest point of the swing.
Sell Order Block (Sell OB): On HH/LH swing, the highest point of our swing is called Sell OB.
Order Blocks are those important zones of price where historically price has reacted strongly – where major clusters of buyers/sellers are located in the market.
3. Volume Analysis (Optional Dashboard/Barcolor)
The candle color depends on the volume ranking on the chart (most high/low, normal, pressure blue shade).
Highest/lowest volume candles are a special highlight, which helps to spot liquidity spikes, exhaustion, or big orders.
4. Live Dashboard
There is an automated dashboard in the top-right of the chart, which shows this in real-time:
Last swing type (HH/HL/LH/LL)
Reversal price (last swing level)
Swing direction (Bull/Bear/Neutral)
Volume, Buy OB, Sell OB, etc.
This helps the trader understand the market situation at a glance.
5. Smart Plotting/Labels
Buy/Sell are plotted as distinct lines on the OB chart.
The Labels option gives clear visual swing points.
All calculations are fast and automated – the user does not need to mark manually.
This indicator is an advanced, fully-automated price action tool that combines
trend, reversal, volume, liquidity and zone detection in one smart system,
makes entry/exit decisions objective and error-free,
and provides complete trading confidence with a live monitor/dashboard.
All of its functions/properties such as: swing detect, OB plot, volume color, dashboard follow best practice for professional chart analysis!
Punkty Pivota

Key Daily LevelsKey Daily Levels Indicator
This lightweight indicator is designed to automatically plot the most essential price levels for intraday traders, helping you visualize key areas of support and resistance without cluttering your chart.
Features:
Opening Range (ORB) : Calculates and displays the high and low of a user-defined opening period (e.g., the first 30 minutes). The levels appear only after the range is established.
Pre-Market High & Low : Identifies the highest and lowest prices from the pre-market session and draws a line segment for each level from the 9:30 AM open until 11:00 AM. These lines remain visible for the rest of the day for reference.
Previous Day's High & Low (PDH/PDL) : Plots the prior day's final high and low, which are critical reference points for the current session.
Current Day's High & Low (CDH/CDL) : Tracks and plots the current session's high and low in real-time.
Customization : All levels can be toggled on or off. Optional text labels are available to clearly identify each line on the chart.
Intraday Focus : The indicator is automatically enabled on intraday timeframes and disabled by default on daily or higher charts to ensure a clean workspace.

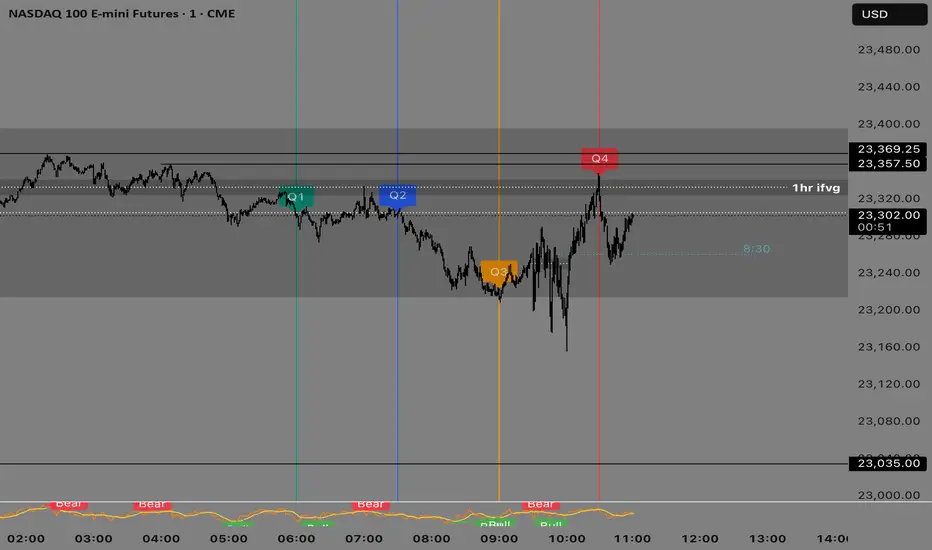
Quarterly Theory —Q1,Q2,Q3,Q4The Quarterly Theory Indicator is a trading tool designed to visualize the natural time-based cycles of the market, based on the principles of Quarterly Theory, popularized by the Inner Circle Trader (ICT). The indicator divides market sessions into four equal “quarters” to help traders identify potential accumulation, manipulation, and distribution phases (AMD model) and improve the timing of entries and exits.
Key Features:
Quarter Divisions (Q1–Q4):
Each market session (e.g., NY AM, London, Asia) is divided into four quarters.
Vertical lines mark the beginning of each quarter, making it easy to track session structure.
Optional labels show Q1, Q2, Q3, and Q4 directly on the chart.
True Open (Q2 Open):
The True Open is the opening price of Q2, considered a key reference point in Quarterly Theory.
A horizontal red line is drawn at the True Open price with a label showing the exact value.
This line helps traders filter bullish and bearish setups:
Buy below the True Open if the market is bullish.
Sell above the True Open if the market is bearish.
Session Awareness:
The indicator can automatically detect market sessions and reset lines and labels for each new session.
Ensures that only the current session’s True Open and quarter lines are displayed, reducing chart clutter.
Timeframe Flexibility:
Works on any chart timeframe (1-minute to daily).
Maintains accurate alignment of quarters and True Open regardless of the timeframe used.
Purpose of Quarterly Theory:
Quarterly Theory is based on the idea that market behavior is fractal and time-driven. By dividing sessions into four quarters, traders can anticipate potential market phases:
Q1: Initial price discovery and setup for the session.
Q2: Accumulation or manipulation phase, where the True Open is established.
Q3: Manipulation or Judas Swing phase designed to trap traders.
Q4: Distribution or trend continuation/reversal.
By visualizing these quarters and the True Open, traders can reduce ambiguity, identify high-probability setups, and improve their timing in line with the ICT AMD (Accumulation, Manipulation, Distribution) framework.
Malama's Quantum Swing Modulator# Multi-Indicator Swing Analysis with Probability Scoring
## What Makes This Script Original
This script combines pivot point detection with a **weighted scoring system** that dynamically adjusts indicator weights based on market regime (trending vs. ranging). Unlike standard multi-indicator approaches that use fixed weightings, this implementation uses ADX to detect market conditions and automatically rebalances the influence of RSI, MFI, and price deviation components accordingly.
## Core Methodology
**Dynamic Weight Allocation System:**
- **Trending Markets (ADX > 25):** Prioritizes momentum (50% weight) with reduced oscillator influence (20% each for RSI/MFI)
- **Ranging Markets (ADX < 25):** Emphasizes mean reversion signals (40% each for RSI/MFI) with no momentum bias
- **Price Wave Component:** Uses EMA deviation normalized by ATR to measure distance from central tendency
**Pivot-Based Level Analysis:**
- Detects swing highs/lows using configurable left/right lookback periods
- Maintains the most recent pivot levels as key reference points
- Calculates proximity scores based on current price distance from these levels
**Volume Confirmation Logic:**
- Defines "volume entanglement" when current volume exceeds SMA by user-defined factor
- Integrates volume confirmation into confidence scoring rather than signal generation
## Technical Implementation Details
**Scoring Algorithm:**
The script calculates separate bullish and bearish "superposition" scores using:
```
Bullish Score = (RSI_bull × weight) + (MFI_bull × weight) + (price_wave × weight × position_filter) + (momentum × weight)
```
Where:
- RSI_bull = 100 - RSI (inverted for oversold bias)
- MFI_bull = 100 - MFI (inverted for oversold bias)
- Position_filter = Only applies when price is below EMA for bullish signals
- Momentum component = Only active in trending markets
**Confidence Calculation:**
Base confidence starts at 25% and increases based on:
- Market regime alignment (trending/ranging appropriate conditions)
- Volume confirmation presence
- Oscillator extreme readings (RSI < 30 or > 70 in ranging markets)
- Price position relative to wave function (EMA)
**Probability Output:**
Final probability = (Base Score × 0.6) + (Proximity Score × 0.4)
This balances indicator confluence with proximity to identified levels.
## Key Differentiators
**vs. Standard Multi-Indicator Scripts:** Uses regime-based dynamic weighting instead of fixed combinations
**vs. Simple Pivot Indicators:** Adds quantified probability and confidence scoring to pivot levels
**vs. Basic Oscillator Combinations:** Incorporates market structure analysis through ADX regime detection
## Visual Components
**Wave Function Display:** EMA with ATR-based uncertainty bands for trend context
**Pivot Markers:** Clear visualization of detected swing highs and lows
**Analysis Table:** Real-time probability, confidence, and action recommendations for current pivot levels
## Practical Application
The dynamic weighting system helps avoid common pitfalls of multi-indicator analysis:
- Reduces oscillator noise during strong trends by emphasizing momentum
- Increases mean reversion sensitivity during sideways markets
- Provides quantified probability rather than subjective signal interpretation
## Important Limitations
- Requires sufficient historical data for pivot detection and volume calculations
- Probability scores are based on current market regime and may change as conditions evolve
- The scoring system is designed for confluence analysis, not standalone trading decisions
- Past probability accuracy does not guarantee future performance
## Technical Requirements
- Works on all timeframes but requires adequate lookback history
- Volume data required for entanglement calculations
- Best suited for liquid instruments where volume patterns are meaningful
This approach provides a systematic framework for evaluating swing trading opportunities while acknowledging the probabilistic nature of technical analysis.

CHoCH Reversal Hunter🔥 CHoCH Reversal Hunter — Detect Bearish CHoCH Patterns & Fibonacci Golden Zone For Precision Reversal Setups
📈 Overview
CHoCH Reversal Hunter is a Pine Script™ indicator for structured bearish market analysis.
It combines major/minor pivot detection, Change of Character (CHoCH) filtering, and logarithmic Fibonacci retracements into one framework.
The goal: identify Small LL → CHoCH → Golden Zone setups with higher precision.
🧠 Core Logic
1. 📊 Market Structure Backbone
Tracks the 4 most recent major highs (H0–H3) and 3 major lows.
These pivots form the basis for trend evaluation.
2. 🔻 Bearish Background Conditions
A bearish market context is confirmed when:
// Bearish Background Condition
isBearish = (High 3 < High 2) and (
(High 2 > High 1 and High 2 < High 0) or
(High 2 <= High 1)
)
// Reset to neutral if High 2 < High 3
This ensures that only a true lower-high structure activates the bearish framework.
3. 🎯 Hunt for Small Lower Low (LL)
Monitors minor pivot lows with a smaller lookback period.
A valid Small LL must break below the third major low (Low 2).
This Small LL becomes the 0% Fibonacci anchor.
4. 🔄 Change of Character (CHoCH) Selection
The indicator scans recent bars for three possible CHoCH patterns:
// CHoCH Type Definitions in CHoCH Hunter
// Inside → current bar inside previous bar
isInsideBar = high < high and low > low
// Smarty → short-term reversal clue
isSmartyBar = low > low and low < low
// Pivot → minor swing high (small swing detection)
isSmallPivotHigh = ta.pivothigh(high, small_swing_period, small_swing_period)
Filter rules for validity:
CHoCH must occur before the Small LL bar.
Its high must be greater than the Small LL bar’s high (dominance criterion).
5. ⚡ Confirmation & Fibonacci Activation
Once price crosses above the selected CHoCH → setup confirmed.
Fibonacci retracements (logarithmic scale) are calculated:
100% → current high (dynamic, updates before breach).
65% → Golden Zone upper boundary.
50% → Golden Zone lower boundary.
0% → Small LL anchor.
6. 📈 Dynamic Management & Reset Rules
Before 50% breach → Fibo High auto-updates with new highs.
After breach → Levels freeze.
Setup resets if:
Price drops below Small LL.
Price breaks beyond frozen levels.
New Small LL formation detected.
✨ Key Features
📍 Automatic detection of major & minor pivots.
🔍 Clear definitions for Inside, Smarty, Pivot CHoCHs.
📐 Logarithmic Fibonacci retracements for exponential markets.
🎯 Golden Zone highlighting (50%–65%).
🔄 Built-in reset logic to invalidate weak setups.
🎨 Visualization
Pivot markers for Major (📕) & Minor (📘) swings.
Labels for CHoCH points with type (“Inside”, “Smarty”, “Pivot”).
Golden Zone highlighted between 50%–65%.
Optional structure labels for clarity.
⚙️ Inputs & Customization
Major Structure Period (default: 4) — sensitivity for big swings.
Minor Structure Period (default: 2) — sensitivity for small swings.
Toggle display of pivots, structure labels, and Golden Zone.
📚 Educational Value
CHoCH Reversal Hunter is designed to help traders learn:
How bearish structures are objectively defined.
Different CHoCH types and how to filter them.
Applying Fibonacci retracements in structured setups.
⚠️ Risk Disclaimer
🚨 This indicator is for educational purposes only and does not constitute financial advice.
Trading involves significant risk — always backtest and apply sound risk management.
🆕 Release Notes v1.0
Bearish structure detection logic added.
CHoCH type classification (Inside, Smarty, Pivot).
Logarithmic Fibonacci retracement with Golden Zone.
Automatic reset & invalidation rules.
💡 Pro Tip: Watch for the sequence Bearish Background → Small LL → CHoCH → Golden Zone — this is the core hunting pattern of CHoCH Reversal Hunter.

TrueOpens [AY]¹ See how price reacts to key multi-day and monthly open levels—perfect for S/R-focused traders.
Experimental indicator for tracking multi-day openings and ICT True Month Open levels, ideal for S/R traders.
TrueOpens ¹ – Multi-Day & True Month Open Levels
This indicator is experimental and designed to help traders visually track opening price levels across multiple days, along with the ICT True Month Open (TMO).
Key Features:
Supports up to 12 configurable multi-day opening sessions, each with independent color, style, width, and label options.
Automatically detects the True Month Open using the ICT method (2nd Monday of each month) and plots it on the chart.
Lines can extend dynamically and are limited to a user-defined number of historical bars for clarity.
Fully customizable timezones, label sizes, and display options.
This indicator is ideal for observing how price interacts with key levels, especially for traders who favor support and resistance-based strategies.
Disclaimer: This is an analytical tool for observation purposes. It does not provide buy or sell signals. Users should combine it with their own analysis and risk management.

VWAP RIBBONVWAP Ribbon Indicator
The VWAP Ribbon Indicator is a comprehensive technical analysis tool designed for TradingView, utilizing multiple Volume-Weighted Average Price (VWAP) calculations across different timeframes (Daily, Weekly, Monthly, Yearly, and Custom) to identify potential trading opportunities. It generates buy/sell signals, detects institutional bias, compression zones, breakouts, false breakouts, and reversions, providing traders with a robust framework for decision-making. The indicator is highly customizable, allowing users to tailor its settings to their trading style and timeframe.
Features
Multi-Timeframe VWAPs: Plots VWAPs for Daily, Weekly, Monthly, Yearly, and a user-defined Custom timeframe, each with configurable deviation bands.
Buy/Sell Signals: Generates signals based on price interactions with VWAPs, rebounds, and crosses, with adjustable sensitivity and minimum conditions.
Institutional Bias: Identifies bullish or bearish institutional bias based on VWAP alignments and slopes.
Compression Zones: Detects areas where VWAPs converge, indicating potential accumulation or distribution phases.
Breakout and False Breakout Detection: Identifies confirmed breakouts and false breakouts after compression zones, with volume and price confirmation.
Reversion Signals: Detects reversions after price excesses beyond VWAP deviation bands, anchored to pivot points.
Custom VWAP: Allows users to define a custom VWAP timeframe (e.g., specific hours, days, weeks) for tailored analysis.
Tactical Panel: Displays real-time signal and market data in a customizable panel (compact or detailed).
Advanced Filters: Incorporates volume, RSI, EMA, and candlestick patterns to enhance signal accuracy.
How to Use
Adding the Indicator:
In TradingView, go to the Pine Editor, paste the provided code, and click "Add to Chart."
The indicator will overlay VWAP lines and deviation bands on your chart, with optional labels and a tactical panel.
Configuration: The indicator is divided into several input groups for easy customization:
⚙️ Activate VWAPs in Signals: Enable or disable Daily, Weekly, Monthly, Yearly, or Custom VWAPs for signal generation.
Visual VWAP Ribbon Settings: Toggle visibility and adjust colors for VWAP lines and deviation bands. Customize the Custom VWAP timeframe (e.g., 4 hours, 2 days).
Buy/Sell Signals: Enable labels for basic signals ("B" for Buy, "S" for Sell), set minimum conditions (1–10), and adjust signal sensitivity (0.1–1.0).
Institutional Bias Conditions: Enable background coloring for bias, set minimum VWAP spacing (%), and optionally require price alignment with VWAPs.
Statistical Signals: Enable reversion labels, adjust lookback periods, and set volume gates for reversions.
VWAP Compression: Enable detection of VWAP convergence zones and breakout/false breakout signals.
Custom Signals: Enable labels for Custom VWAP rebounds with configurable cooldowns.
Pro Filters: Apply advanced filters like minimum VWAP slope, relative price confirmation, volume thresholds, RSI, and EMA weights.
Signal Weight Configuration: Assign weights to various conditions (e.g., price crosses, rebounds) to fine-tune signal scoring.
Tactical Panel: Enable the panel, choose its position (e.g., top-right), and select compact or detailed mode.
Interpreting Signals:
Buy/Sell Signals: Appear as "B" (Buy) or "S" (Sell) labels with detailed tooltips listing triggered conditions (e.g., price crossing Daily VWAP, rebound from lower band). Signals require a minimum number of conditions (default: 3) and a normalized score above the sensitivity threshold (default: 0.5).
Institutional Bias: Background coloring (green for bullish, red for bearish) indicates VWAP alignment (e.g., Daily > Weekly > Monthly) and slope conditions. Neutral bias has no coloring.
Compression Zones: Gray background highlights areas where VWAPs are within a user-defined threshold (default: 0.5%), signaling potential accumulation/distribution.
Breakout Signals: Labeled as "BREAK ▲" or "BREAK ▼" after exiting a compression zone with strong candlestick confirmation and volume.
False Breakout Signals: Labeled as "FALSE ▲" or "FALSE ▼" when price crosses a Daily VWAP band but reverses back, indicating a failed breakout.
Reversion Signals: Labeled as "▲ R ▬ BUY" or "▼ R ▬ SELL" at pivot points after price excesses beyond VWAP bands, confirmed by volume (if enabled).
Custom VWAP Signals: Labeled as "C-BUY" or "C-SELL" for rebounds off the Custom VWAP’s deviation bands, with configurable volume and candlestick filters.
Tactical Panel: Displays the latest signal, price, date, bias, compression status, trend direction, VWAP distances, volume state, and technical summary (slopes, band distances).
Best Practices:
Timeframe Selection: The indicator auto-scales parameters for different timeframes (Daily+, Intraday ≥1h, Sub-hour). Adjust settings like lookbackBars or devThreshold for specific timeframes if autoScaleReversion is disabled.
Signal Sensitivity: Increase signalSensitivity (e.g., 0.7) for stricter signals or decrease (e.g., 0.3) for more frequent signals. Adjust minConditions to balance signal frequency and reliability.
Volume Filters: Enable useVolumeGate or useLiquidityFilter for high-liquidity assets to reduce false signals in low-volume conditions.
Compression and Breakouts: Use compression zones to anticipate breakouts. Enable showBreakoutLabels and showfalseBreakoutLabels to monitor confirmed and failed breakouts.
Custom VWAP: Set a specific timeframe (e.g., 4 hours) for intraday trading or longer periods (e.g., 2 weeks) for swing trading. Enable showCustomSignalLabels for tailored signals.
Reversion Trading: Use reversion signals for mean-reversion strategies, especially in range-bound markets. Adjust devThreshold and pivotLength for sensitivity.
Tactical Panel: Use the detailed panel for a quick overview of market conditions. Compact mode is ideal for minimal screen clutter.
Alerts:
Set up alerts for:
Institutional Bias (Buy/Sell)
VWAP Compression (Start/End)
Basic Buy/Sell Signals
Reversion Signals (Buy/Sell)
Breakout Signals (Bullish/Bearish)
False Breakout Signals (Bullish/Bearish)
Custom VWAP Rebound Signals (Buy/Sell)
Weekly/Monthly/Yearly VWAP Rebound Signals
In TradingView, go to the Alerts tab, select the indicator, and choose the desired condition. Customize alert messages as needed.
Notes
Performance: The indicator uses max_bars_back=5000 and max_labels_count=500 to ensure compatibility with most assets. For low-liquidity assets, consider enabling useLiquidityFilter to avoid noisy signals.
Customization: Experiment with weights in the "Signal Weight Configuration" group to prioritize specific conditions (e.g., increase wReboundD for Daily VWAP rebounds).
Limitations: Signals are based on historical data and VWAP interactions. Always combine with other analysis tools and risk management strategies.
License: This indicator is released under the Mozilla Public License 2.0.

FREEDOM - TJR Model\ FREEDOM – TJR Model\ 🚀
\ Automates TJR’s well-known NQ playbook with clean visuals, filters, and alerts—so you can focus on execution.\
\ Core idea\
1. Trade \ NQ\ in the \ New York session\ 🗽
2. Wait for a \ liquidity sweep\ of a \ prior session\ High/Low (Asia or London) ✂️
3. Confirm with \ SMT (NQ vs ES) divergence\ 🔀
4. Act on a \ proprietary entry signal\ 🔒
5. Risk at the swing 🛡️, target \ untapped internal/session liquidity\ 🎯
This indicator draws those session levels for you, tracks sweeps, detects SMT, applies higher-timeframe confluence, and fires alerts that respect your time window and filters.
---
\ What it draws & detects\
\ • Sessions & Liquidity Sweeps\ 🕒
* Plots \ Asia / London / New York\ session bands.
* On session close, it freezes the session’s \ High/Low\ as dotted “previous-session levels” and \ extends them forward\ until price \ crosses\ (choose \ Wicks\ or \ Close\ ).
* When price takes a previous-session \ High\ → \ Buyside sweep\ ; takes a \ Low\ → \ Sellside sweep\ .
* Optional \ Sweep Zones\ expand around the swept level using an \ ATR(21)\ margin; can auto-fade “fake” sweeps.
\ Tip: Keep “Extend previous session High/Low until cross” ON to maintain a clean roadmap into NY open.\
\ • SMT Divergence (NQ vs ES)\ 🔀
* Classic pivot-to-pivot SMT:
* \ Bearish SMT\ = NQ makes a \ higher high\ while ES does \ not\ .
* \ Bullish SMT\ = NQ makes a \ lower low\ while ES does \ not\ .
* Draws \ lines\ from pivot to pivot (no chart spam), with optional inline “SMT” label and optional confidence \ score\ (0–100) based on strength + recency.
* Context aware:
* Only shows \ Bearish SMT\ after a \ buy-side sweep\ (previous-session High taken).
* Only shows \ Bullish SMT\ after a \ sell-side sweep\ (previous-session Low taken).
* Respects your \ NY time window\ if enabled.
\ • Proprietary Entry Signals\ 🔒
* Prints entry lines + arrows only when your rules align (proprietary detection under the hood).
* Respects:
* \ Session-sweep bias\ (optional): Sells only after buy-side sweep; Buys only after sell-side sweep.
* \ Monotonic filter\ : new Sell must be \ higher\ than last Sell; new Buy must be \ lower\ than last Buy (resets each session).
* \ Minimum distance\ to nearest previous-session dotted level (in ticks).
* \ NY time filter\ window.
* \ HTF confluence\ (see below).
---
\ HTF Confluence (optional)\ 📈
* Choose \ MA slope\ (\ EMA/SMA/RMA/WMA\ ) or \ HH/HL structure\ on a higher timeframe (e.g., 60m/240m).
* Entry arrows and alerts can be gated so they only print when HTF bias agrees with the setup.
\ Tip: Start with EMA 50 on 60m for a smooth directional filter; add HH/HL only if you want stricter structure confirmation.\
---
\ Dashboard (bottom-right)\ 🧩
* \ VWAP state\ :
* \ Overbought\ (🔴) if close > VWAP + (mult × stdev)
* \ Oversold\ (🟢) if close < VWAP − (mult × stdev)
* Otherwise \ Neutral\ (⚪️)
* \ Premium / Discount\ vs previous-session 50% midline: Premium = above (red bias), Discount = below (green bias).
* \ SMT row\ : Bullish / Bearish / Neutral with optional score.
---
\ How to use the settings (quick tour)\
\ ENTRY\
* \ Entry Swing Length\ : lower = more signals.
* \ Confirmation\ : \ Candle Close\ or \ Wicks\ for breakout.
* \ Filter entry by session sweeps\ : enforces “sell after buy-side sweep, buy after sell-side sweep.”
* \ Minimum distance (ticks)\ : blocks entries too close to previous-session dotted levels.
* \ Replay mode\ : keeps entries visible in Bar Replay.
* \ NY Time filter\ : default \ 08:00–14:00 NY\ ; arrows/alerts respect the window.
* \ Arrow offset (ticks)\ : how far above/below the candle to plot the arrow.
\ SESSION SWEEPS\
* Toggle \ Buyside/Sellside zones\ , adjust \ ATR(21)\ margin & length.
* \ Hide Fake Sweep Zones\ (default ON).
* \ Extend H/L until cross\ (Wicks/Close).
* Optional \ daily reset\ for unswept dotted lines.
\ SESSIONS\
* Enable/disable \ Asia, London, NY AM, NY PM\ ; set start/end; choose color; extend midline if desired.
* DST toggles for NY/London.
\ HTF Confluence\
* Turn it ON/OFF; pick timeframe & method (MA slope or HH/HL); set MA type/length or swing length.
\ Dashboard\
* Show/hide table; set VWAP stdev length/multiplier.
* SMT settings: comparison symbol (\ default ES1!\ ), pivot length, show score/labels, recency window, etc.
\ Alerts\ (always last) 🔔
* \ Session line cross\ : choose Highs/Lows and crossing mode (\ Same as extension / Wicks / Close\ ).
* \ Entry alerts\ : \ Filtered / Unfiltered / Both\ .
* \ Filtered\ = respects sweep bias, HTF confluence, minimum distance, monotonic rule, and time window.
* \ Unfiltered\ = ignores sweep bias/HTF/monotonic (still respects minimum distance + time window).
* All entry alerts also respect the \ NY time window\ when enabled.
---
\ Suggested workflow\
* Open NQ on a 1–5m chart.
* Let the dotted \ previous-session H/L\ extend into NY; wait for a \ sweep\ .
* Check \ SMT\ : after buy-side sweep → look for \ bearish SMT\ ; after sell-side sweep → look for \ bullish SMT\ .
* Take the \ proprietary entry\ when filters agree.
* Stop at the swing; aim for \ untapped internal/session liquidity\ .
* Let \ alerts\ handle the monitoring.
---
\ Why traders like it\
* It mirrors the model popularized by \ TJR\ while removing the chart admin: sessions, sweeps, SMT, HTF gating, distances, monotonic sequencing, time windows, and ready-to-use alerts—so your execution stays consistent. ✨
---
\ Disclaimer\ ⚠️
\ This tool is for educational purposes only and does not constitute financial advice. Markets involve risk; always do your own research and test in replay/paper before trading live. FREEDOM – TJR Model is inspired by TJR’s publicly known framework but is not affiliated with, endorsed by, or sponsored by TJR. You are solely responsible for your trading decisions and outcomes.\

Egg vs Tennis Ball — Drop/Rebound StrengthEgg vs Tennis Ball — Drop/Rebound Meter
What it does
Classifies selloffs as either:
Eggs — dead‑cat, no bounce
Tennis Balls — fast, decisive rebound
Core features
Detects swing drops from a Pivot High (PH) to a Pivot Low (PL)
Requires drops to be meaningful (volatility‑aware, ATR‑scaled)
Draws a bounce threshold line and a deadline
Decides outcome based on speed and extent of rebound
Tracks scores and win rates across multiple lookback windows
Includes a color‑coded meter and current streak display
Visuals at a glance
Gray diagonal — drop from PH to PL
Teal dotted horizontal — bounce threshold, from PH to the deadline
Solid green — Tennis Ball (bounce line broken before the deadline)
Solid red — Egg (deadline expired before the bounce)
Optional PH / PL labels for clarity
How the decision is made
1) Find pivots — symmetric pivots using Pivot Left / Right; PL confirms after Right bars.
2) Qualify the drop — Drop Size = PH − PL; must be ≥ (Drop Threshold × ATR at PL).
3) Define the bounce line — PL + (Bounce Multiple × Drop Size). 1.00× = full retrace to PH; up to 2.00× for overshoot.
4) Set the deadline — Drop Bars = PL index − PH index; Deadline = Drop Bars × Recovery Factor; timer starts from PH or PL.
5) Resolve — Tennis Ball if price hits the bounce line before the deadline; Egg if the deadline passes first.
Scoring system (−100 to +100)
+100 = perfect Tennis Ball (fastest possible + full overshoot)
−100 = perfect Egg (no recovery)
In between: scored by rebound speed and extent, shaped by your weight settings
Meter Table
Columns (toggle on/off)
All (off by default)
Last N1 (default 5)
Last N2 (default 10)
Last N3 (default 20)
Rows
Tennis / Eggs — counts
% Tennis — win rate
Avg Score — normalized quality from −100 to +100
Streak — overall (not windowed), e.g., +3 = 3 Tennis Balls in a row, −4 = 4 Eggs in a row
Alerts
Tennis Ball – Fast Rebound — triggers when the bounce line is broken in time
Egg – Window Expired — triggers when the deadline passes without a bounce
Inputs
① Drop Detection
Pivot Left / Right
ATR Length
Drop Threshold × ATR
② Bounce Requirement
Bounce Multiple × Drop Size (0.10–2.00×)
③ Timing
Timer Start — PH or PL
Recovery Factor × Drop Bars
Break Trigger — Close or High
④ Display
Show Pivot/Outcome Labels
Line Width
Table Position (corner)
⑤ Meter Columns
Show All (off by default)
Show N1 / N2 / N3 (5, 10, 20 by default)
⑥ Scoring Weights
Tennis — Base, Speed, Extent
Egg — Base, Strength
How to use it
Pick strictness — start with Drop Threshold = 2.0 ATR, Bounce Multiple = 1.0×, Recovery Factor = 3.0×; adjust to timeframe and volatility.
Watch the dotted line — it ends at the deadline; turns solid green (Tennis) if broken in time, solid red (Egg) if it expires.
Read the meter — short windows (5–10) show current behavior; Avg Score captures quality; Streak shows momentum.
Blend with your system — combine with trend filters, volume, or regime detection.
Tips
Close vs High trigger: Close is stricter; High is more responsive.
PH vs PL timer start: PH measures round‑trip; PL measures recovery only.
Increase pivot strength for fewer, more reliable signals.
Higher timeframes generally produce cleaner patterns.
Defaults
Pivot L/R: 5 / 5
ATR Length: 14
Drop Threshold: 2.0× ATR
Bounce Multiple: 1.00×
Recovery Factor: 3.0×
Break Trigger: Close
Windows: Last 5, 10, 20 (All off)
Interpreting results
Tennis‑y: Avg Score +30 to +70, %Tennis > 55%
Mixed: Avg Score near 0
Egg‑y: Avg Score −30 to −80, %Tennis < 45%
Clean Pivot Lines with AlertsTechnical Overview
This Script is designed for detecting untouched pivot highs and lows. It draws horizontal levels only when those pivots remain unviolated within a configurable lookback window and removes them automatically upon price breaches or sweeps.
Key components include:
Pivot detection logic : Utilizes ta.pivothigh()/ta.pivotlow() (or equivalent via request.security for HTF) with parameterized pivotLength to ensure flexibility and adaptability to different timeframes.
Cleanliness filtering : Checks lookbackBars prior to line creation to skip levels already violated, ensuring only uncontaminated pivots are used.
Dynamic level tracking : Stores active levels in arrays (highLines, lowLines) for continuous real-time monitoring.
Violation logic : Detects both close-based breaks (breakAbove/breakBelow) and wick-based sweeps (sweepAbove/sweepBelow), triggering alerts and automatic teardown.
Periodic housekeeping : Every N (10) confirmed bars, re-verifies “clean” status and removes silently invalidated levels—maintaining chart hygiene and avoiding stale overlays.
Customization options : Supports pivot timeframe override, colors, line width/style, lookback length, and alert toggling.
Utility
This overlay script provides a disciplined workflow for drawing meaningful support/resistance levels, filtering out contaminated pivot points, and signaling validations (breaks/sweeps) with alerts. Its modular design and HTF support facilitate integration into systematic workflows, offering far more utility than mere static pivot plots.
Usage Instructions
1. Adjust `pivot_timeframe`, `pivot_length`, and `lookback_bars` to suit your strategy timeframe and volatility structure.
2. Customize visual parameters as required.
3. Enable alerts to receive in-platform messages upon pivot violations.
4. Use HTF override only if analyzing multi-timeframe pivot behavior; otherwise, leave empty to default to chart timeframe.
Performance & Limitations
- Pivot lines confirmation lags by `pivot_length` bars; real-time signals may be delayed.
- Excessive active lines may impact performance on low-TF charts.
- The “clean” logic is contingent on the `lookback_bars` parameter; choose sufficiently high values to avoid false cleanliness.
- Alerts distinguish between closes beyond and wick-only breaches to aid strategic nuance.

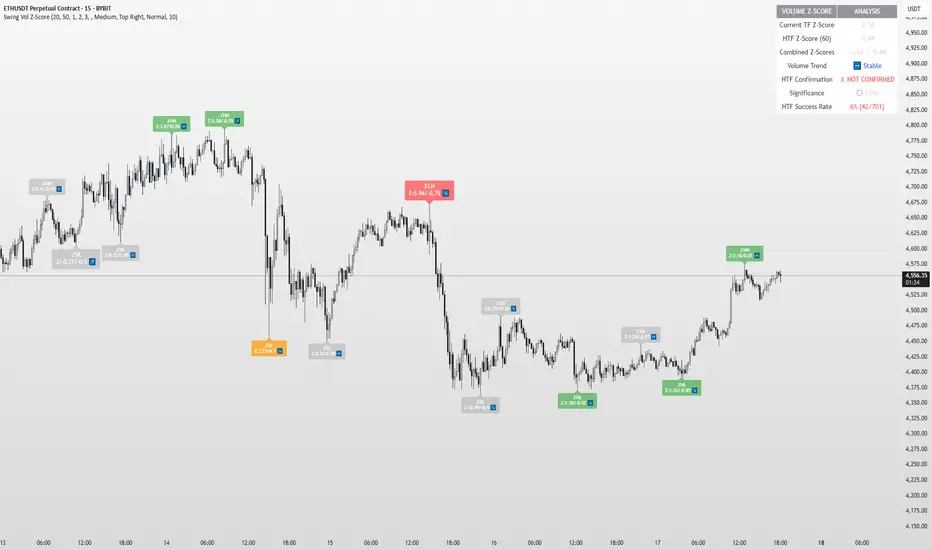
Swing Point Volume Z-ScoreSWING POINT VOLUME Z-SCORE INDICATOR
A volume analysis tool that identifies statistical volume spikes at swing points with optional higher timeframe confirmation.
This indicator uses Leviathan's method of swing detection. All credit to him for his amazing work (and any mistakes mine). I was also inspired by Trading Riot, who's Capitulation indicator gave me the idea to create this one.
WHAT IT DOES
This indicator combines three analytical approaches:
- Volume Z-score calculation to measure volume significance statistically
- Automatic swing point detection (higher highs, lower lows, etc.)
- Optional higher timeframe volume confirmation
The Z-score measures how many standard deviations current volume is from the average, helping identify when volume activity is genuinely elevated rather than relying on visual assessment.
VISUAL SYSTEM
The indicator uses a color-coded approach for quick assessment:
GREEN - Normal Activity (Z-Score 1.0-2.0)
Above-average volume levels
ORANGE - Elevated Activity (Z-Score 2.0-3.0)
High volume activity that may indicate increased interest
RED - Potential Institutional Activity (Z-Score 3.0+)
Very high volume levels that could suggest significant market participation
HIGHER TIMEFRAME CONFIRMATION
When enabled, the indicator checks volume on a higher timeframe:
- Checkmark symbol indicates HTF volume also shows elevation
- X symbol indicates HTF volume doesn't confirm
- Auto-selects appropriate higher timeframe or allows manual selection
KEY FEATURES
Statistical Approach: Uses Z-score methodology rather than arbitrary volume thresholds
Adaptive Thresholds: Can adjust based on market volatility conditions
Swing Focus: Concentrates analysis on structurally important price levels
Volume Trends: Shows whether volume is accelerating or decelerating
Success Tracking: Monitors how often HTF confirmation proves effective
DISPLAY OPTIONS
Basic Mode: Essential features with clean interface
Advanced Mode: Additional customization and analytics
Label Sizing: Four size options to fit different screen setups
Table Position: Moveable info table with transparency control
Custom Colors: Adjustable for different chart themes
PRACTICAL APPLICATIONS
May help identify:
- Volume spikes at support/resistance levels
- Potential accumulation or distribution zones
- Breakout confirmation with volume backing
- Areas where larger market participants might be active
Works on all liquid markets and timeframes, though generally more effective on 15-minute charts and higher.
USAGE NOTES
This is an analytical tool that highlights statistically significant volume events. It should be used as part of a broader analysis approach rather than as a standalone trading system.
The indicator works best when combined with:
- Price action analysis
- Support and resistance identification
- Trend analysis
- Proper risk management
Default settings are designed to work well across most instruments, but users can adjust parameters based on their specific needs and trading style.
TECHNICAL DETAILS
Built with Pine Script v5
Compatible with all TradingView subscription levels
Open source code available for review and learning
Works on stocks, forex, crypto, futures, and other liquid instruments
The statistical approach helps remove some subjectivity from volume analysis, though like all technical indicators, it should be used thoughtfully as part of a complete trading plan.
Prev D/W/M + Asia & London Levels [Oeditrades]Prev D/W/M + Asia & London Levels
Author: Oeditrades
Platform: Pine Script® v6
What it does
Plots only the most recent, fully completed:
Previous Day / Week / Month highs & lows
Asia and London session highs & lows
Levels are drawn as true horizontal lines from the period/session start and extended to the right for easy confluence reading. The script is non-repainting.
How it works
Prev Day/Week/Month: Uses completed HTF candles (high / low ) so values are fixed for the entire next period.
Sessions (NY time): Asia (default 20:00–03:00) and London (default 03:00–08:00) are tracked in America/New_York time. High/low are locked when the session ends, and the line is anchored at that session’s start.
Inputs & customization
Visibility: toggle Previous Day/Week/Month, Asia, London, and labels.
Colors: highs default red; lows default green (user-configurable). Session highs default pink, lows aqua (also editable).
Style: line style (solid/dotted/dashed) and width.
Sessions: editable time windows for Asia and London (still interpreted in New York time).
Disclaimer: optional on-chart disclaimer panel with editable text.
Notes
Works on any timeframe. For intraday charts, the HTF values remain constant until the next HTF bar completes.
If your market’s overnight hours differ, simply adjust the session windows in Inputs.
Lines intentionally show only the latest completed period/session to keep charts clean.
Use cases
Quick view of PDH/PDL, PWH/PWL, PMH/PML for bias and liquidity.
Intraday planning around Asia/London range breaks, retests, and overlaps with prior levels.
Disclaimer
This tool is for educational purposes only and is not financial advice. Markets involve risk; past performance does not guarantee future results.

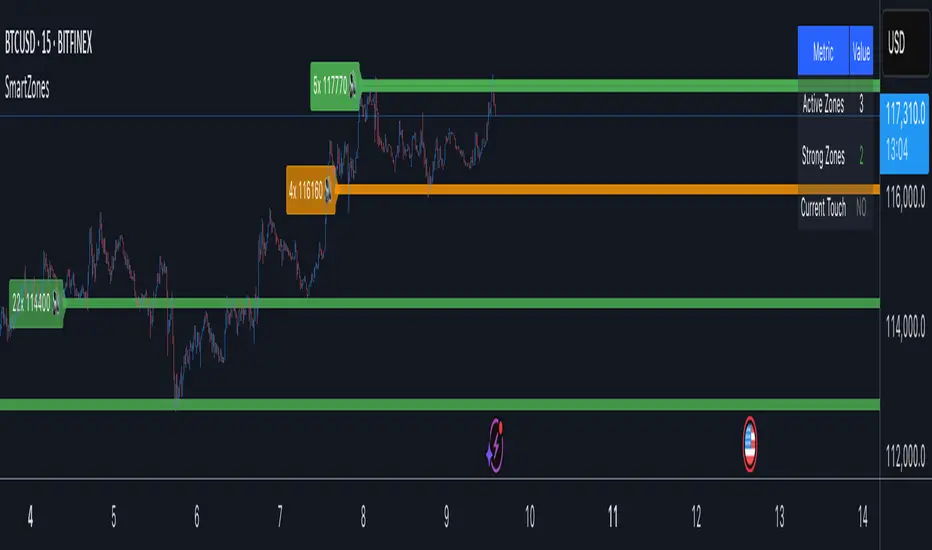
Smart Zone Detector by Mihkel00Advanced support/resistance indicator with dynamic zones and volume confirmation.
Smart Zone Detector automatically identifies key support and resistance zones using pivot points with following features:
Dynamic ATR-based zones that adapt to market volatility
Volume confirmation to filter out weak levels
Touch counting with strength classification (3x, 8x, 13x+ touches)
What You Get
Active Zones: Current qualified S/R levels (3+ touches)
Strong Zones: High-confidence areas with multiple confirmations
Color-coded zone strength (Green=Strong, Orange=Medium, Red=Weak)
Touch count labels showing zone significance
How to Use
Zone Identification: Look for zones with 3+ touches - these are qualified levels
Strength Assessment: Higher touch counts (8x, 13x+) = stronger zones
Volume Confirmation: volume-backed zones (more reliable)
Zone Interactions: Green/red X-crosses show real-time support/resistance tests
Dynamic Sizing: Zones automatically adjust width based on ATR
Settings
Lookback: How far back to scan for pivots (default: 100 bars)
Min Touches: Qualification threshold (default: 3 touches)
Volume Confirmation: Enable for higher-quality zones
Zone Tolerance: Sensitivity for merging nearby levels
Dynamic S/R Zones Pro [By TraderMan]Dynamic S/R Zones Pro
Short pitch:
Dynamic S/R Zones Pro automatically maps support and resistance levels using pivot highs/lows and draws surrounding zones. It displays lines, labels and a table — making it fast to spot relevant price areas on your chart. 📊✨
🔎 What does this indicator do?
Detects pivot highs/lows and converts them into dynamic S/R levels.
Draws a zone around each level (upper & lower bands) so you can see the interaction area. 🟢🔴
Counts how often each level was tested and writes that “strength” in the table — so you can prioritize levels.
Fully configurable colors, line styles, zone width and table display. 🎛️
Note: Pivot-based S/R is a widely used, objective way to map price levels — see pivot basics.
Investopedia
⚙️ How it works (technical)
Uses pivotRange = 10 to search for highs/lows inside that window.
Looks back analysisPeriod (284 in your script) and selects meaningful pivots; filters by strengthSR threshold.
channelPercent and zonePercent define band thickness (zone), with zoneWidthPercent applied over the last 300 bars.
Strength = number of times price tested that band; used for filtering and the table.
High/Low Zones option draws wide reference bands around the period’s highest/lowest pivots.
(Pivot logic here is pivot-based SR mapping — not classical static pivot formulas, but the same principle of marking widely watched price levels.)
Investopedia
🛠️ How to use (step-by-step)
Enable SR: toggle S/R drawing on/off.
Strength (strengthSR): increase to show only well-tested levels, decrease to show more levels.
Line Style / Width: readability and aesthetics.
Show Zones / Zone Width %: enable zones and set width (e.g. 2% of recent range).
Show High/Low Zones: draw wide reference zones for the highest/lowest pivots.
Extend SR: extend lines across the chart (past/future) for clarity.
Show Table: display levels, zone boundaries and strength in the top-right table. 📋
🎯 Trade entry ideas (examples)
Not financial advice — examples of how traders commonly use S/R zones.
1) Bounce Long (support zone buy)
Condition: Price arrives at a support zone and shows a bullish confirmation candle (e.g., hammer, bullish engulfing).
Extra confirmation: oversold RSI or supportive volume.
Entry: on confirmed candle close (market or limit).
SL: slightly below the zone’s lower band.
TP: next resistance or target R:R ≥ 1:2. (Retest confirmations reduce false-breakout risk.)
fxopen.com
Investopedia
2) Breakout Long
Condition: Price breaks resistance with increased volume.
Tactic: wait for a retest of the broken resistance (now support). Enter on confirmation.
SL: below the retest low or zone lower band.
TP: next zone / predetermined R:R target. Breakouts need volume/retest confirmation to avoid fakeouts.
Investopedia
fxopen.com
3) Scalp
Use narrower zones, smaller TF, very tight SL and smaller R:R (e.g., 1:1), account for spreads/fees.
🛡️ Risk management
Don’t risk too much per trade — follow a fixed % (e.g., 1–2% max).
cmegroup.com
Plan SL & TP before entry; avoid emotional adjustments.
Investopedia
Calculate risk/reward; aim for a favorable R:R and backtest your rules.
CenterPoint Securities
✔️ Practical tips
Filter by strength to remove noisy levels.
Timeframe matters: higher TF = stronger levels.
Combine with other indicators (volume, RSI, MAs) for better confirmation.
Backtest the script and your entry rules before deploying live.
Quick summary: Dynamic S/R Zones Pro is a pivot-based S/R & zone mapper that highlights strong levels and helps you trade bounces, breakouts and retests — but always use SL/TP and solid risk management.
Investopedia
+2
Investopedia
+2
fxopen.com
Disclaimer: Not financial advice. Trading involves risk. 🔒

Key Session Levels (KUUUMZ)
📜 Summary
Tired of manually drawing the same key levels every single trading day? The KUUMZ-Key Session Levels indicator automates this entire process, plotting the most critical intraday and previous day levels directly on your chart. This tool provides a clean, dynamic framework of potential support and resistance zones, allowing you to focus on your trading strategy, not on chart setup.
Built for day traders and scalpers of US equities, this indicator helps you instantly visualize the market's structure from the moment the session begins.
🎯 Key Levels Plotted
This indicator automatically identifies and draws horizontal lines for the following session levels:
Previous Day High (PDH) & Low (PDL): The highest and lowest points of the prior trading day, which often act as major psychological support and resistance magnets.
Pre-Market High & Low (PMH/PML): The range established during the pre-market session (4:00 - 9:30 AM ET). A breakout from this range can often signal the initial directional bias.
5-Minute Opening Range High & Low (OR5): The high and low of the first 5 minutes of the regular session (9:30 - 9:35 AM ET). A crucial level for opening range breakout (ORB) strategies.
15-Minute Opening Range High & Low (OR15): The high and low of the first 15 minutes (9:30 - 9:45 AM ET), providing a slightly broader view of the initial balance area.
📈 How to Use This Indicator
These levels are fundamental to many intraday trading strategies:
Support & Resistance: Watch how price reacts as it approaches these levels. A bounce or rejection can signal a potential reversal, while a clean break can indicate continuation.
Breakout Trading: A strong, high-volume move through one of these levels (e.g., breaking above the Pre-Market High) can be an entry signal for a breakout trade.
Market Context: Quickly gauge market sentiment. Is the price trading above or below the previous day's range? Is it trapped within the opening range? These levels provide immediate context to the current price action.
Setting Targets & Stops: Use these levels to set logical profit targets or place stop-loss orders. For example, if you go long on a breakout of the 5-min OR, the Pre-Market High or Previous Day High could be your first target.
⚙️ Features & Customization
The script is designed to be flexible and clean, allowing you to tailor it to your specific charting style.
Toggle Any Level: Enable or disable any set of levels (Previous Day, Pre-Market, etc.) to reduce clutter.
Full Style Control: Customize the Color, Width, and Style (Solid, Dotted, Dashed) for each pair of high/low lines independently.
Optional Labels: A master switch allows you to show or hide all price labels (like "PDH", "PM Low", etc.) with a single click.
Automatic & Dynamic: Levels are calculated and drawn in real-time as each session concludes and are automatically cleared and reset for the next trading day.

Session High/Low/PD Selector with Realtime AlertsThis indicator displays key intraday and multi-day price levels directly on the chart for short-term traders. It includes:
Session Highs and Lows for Asia, London, and New York sessions
→ Automatically plots each completed session’s high and low, with lines extended to the right and labeled.
Previous Day High, Low, and Close
→ Draws levels from the prior daily candle with adjustable colors and labels.
Previous Week High and Low
→ Weekly key levels are plotted just like daily ones.
Real-time Alerts
→ Optional alerts trigger immediately when price touches or breaks any session, PDH/PDL, or PWH/PWL levels.
Fully Customizable
→ Toggle sessions, previous day/week levels, label positions, and colors per user preference.

Multi-Timeframe SFP + SMTImportant: Please Read First
This indicator is not a "one size fits all" solution. It is a professional and complex tool that requires you to learn how to use it, in addition to backtesting different settings to discover what works best for your specific trading style and the assets you trade. The default settings provided are my personal preferences for trading higher-timeframe setups, but you are encouraged to experiment and find your own optimal configuration.
Please note that while this initial version is solid, it may still contain small errors or bugs. I will be actively working on improving the indicator over time. Also, be aware that the script is not written for maximum efficiency and may be resource-intensive, but this should not pose a problem for most users.
The source code for this indicator is open. If you truly want to understand precisely how all the logic works, you can copy and paste the code into an AI assistant like Gemini or ChatGPT and ask it to explain any part of the script to you.
Author's Preferred Settings (Guideline)
As a starting point, here are the settings I personally use for my trading:
SFP Timeframe: 4-Hour (Strength: 5-5)
Max Lookback: 35 Bars
Raid Expiration: 1 Bar
SFP Lines Limit: 1
SMT Timeframe 1: 30-Minute (Strength: 2-2) with 3-Minute LTF Detection.
SMT Timeframe 2: 15-Minute (Strength: 3-3) with 3-Minute LTF Detection.
SMT Timeframe 3: 1-Hour (Strength: 1-1) with 3-Minute LTF Detection.
SMT Timeframe 4: 15-Minute (Strength: 1-1) with 3-Minute LTF Detection.
Multi-Timeframe SMT: An Overview
This indicator is a powerful tool designed to identify high-probability trading setups by combining two key institutional concepts: Swing Failure Patterns (SFP) on a higher timeframe and Smart Money Technique (SMT) divergences on a lower timeframe. A key feature is the ability to configure and run up to four independent SMT analyses simultaneously, allowing you to monitor for divergences across multiple timeframes (e.g., 15m, 1H, 4H) from a single indicator.
Its primary purpose is to generate automated signals through TradingView's alert system. By setting up alerts, the script runs server-side, monitoring the market for you. When a setup presents itself, it will send a push notification to your device, allowing you to personally evaluate the trade without being tied to your screen.
The Strategy: HTF Liquidity Sweeps into LTF SMT
The core strategy is built on a classic institutional trading model:
Wait for a liquidity sweep on a significant high timeframe (e.g., 4-hour, Daily).
Once liquidity is taken, look for a confirmation of a shift in market structure on a lower timeframe.
This indicator uses an SMT divergence as that confirmation signal, indicating that smart money may be stepping in to reverse the price.
How It Works: The Two-Step Process
The indicator's logic follows a precise two-step process to generate a signal:
Step 1: The Swing Failure Pattern (SFP)
First, the indicator identifies a high-timeframe liquidity sweep. This is configured in the "Swing Failure Pattern (SFP) Timeframe" settings.
It looks for a candle that wicks above a previous high (or below a previous low) but then closes back within the range of that pivot. This action is known as a "raid" or a "swing failure," suggesting the move failed to find genuine momentum.
Step 2: The SMT Divergence
The moment a valid SFP is confirmed, the indicator's multiple SMT engines activate.
Each engine begins monitoring the specific SMT timeframe you have configured (e.g., "SMT Timeframe 1," "SMT Timeframe 2," etc.) for a Smart Money Technique (SMT) divergence.
An SMT divergence occurs when two closely correlated assets fail to move in sync. For example, after a raid on a high, Asset A makes a new high, but Asset B fails to do so. This disagreement suggests weakness and a potential reversal.
When the script finds this divergence, it plots the SMT line and triggers an alert.
The Power of Alerts
The true strength of this indicator lies in its alert capabilities. You can create alerts for both unconfirmed and confirmed SMTs.
Enable Alerts LTF Detection: These alerts trigger when an unconfirmed, potential SMT is spotted on the lower "LTF Detection" timeframe. While not yet confirmed, these early alerts can notify you of a potential move before it fully happens, allowing you to be ahead of the curve and find the best possible trade entries.
Enable Alerts Confirmed SMT: These alerts trigger only when a permanent, confirmed SMT line is plotted on your chosen SMT timeframe. These signals are more reliable but occur later than the early detection alerts.
Key Concepts Explained
What is Pivot Strength?
Pivot Strength determines how significant a high or low needs to be to qualify as a valid structural point. A setting of 5-5, for example, means that for a candle's high to be considered a valid pivot high, its high must be higher than the highs of the 5 candles to its left and the 5 candles to its right.
Higher Strength (e.g., 5-5, 8-8): Creates fewer, but more significant, pivots. This is ideal for identifying major structural highs and lows on higher timeframes.
Lower Strength (e.g., 2-2, 3-3): Creates more pivots, making it suitable for identifying the smaller shifts in momentum on lower timeframes.
Raid Expiration & Validity
An SFP signal is not valid forever. The "Raid Expiration" setting determines how many SFP timeframe bars can pass after a raid before that signal is considered "stale" and can no longer be used to validate an SMT. This ensures your SMT divergences are always in response to recent liquidity sweeps.
Why You Must Be on the Right Chart Timeframe to See SMT Lines
Pine Script™ has a fundamental rule: an indicator running on a chart can only "see" the bars of that chart's timeframe or higher.
When the SMT logic is set to the 15-minute timeframe, it calculates its pivots based on 15-minute data. To accurately plot lines connecting these pivots, you must be on a 15-minute chart or lower (e.g., 5-minute, 1-minute).
If you are on a higher timeframe chart, like the 1-hour, the 15-minute bars do not exist on that chart, so the indicator has no bars to draw the lines on.
This is precisely why the alert system is so powerful. You can set your alert to run on the 15-minute timeframe, and TradingView's servers will monitor that timeframe for you, sending a notification regardless of what chart you are currently viewing.

CPR by myBiniyogCPR by myBiniyog
Purpose:
Clearly plots the Central Pivot Range (CPR), Support, and Resistance levels daily, weekly, and monthly (optional). CPR levels help intraday traders identify potential market direction, trends, and reversal points. CPR lines plotted clearly (blue), Support levels (green), and Resistance levels (red).
Calculation Method:
Pivot (P) = (High + Low + Close) / 3
Bottom Central (BC) = (High + Low) / 2
Top Central (TC) = Pivot + (Pivot - BC)
Support (S1-S3) and Resistance (R1-R3) levels calculated traditionally from pivot formulas.
Uniqueness & Originality:
Fully original script combining multi-timeframe (Daily/Weekly/Monthly) pivots.
Unique, clear visual representation designed for ease of use.
Closed-source to protect custom visual style and original logic.
Recommended Timeframes:
For optimal clarity and performance, use on 5-minute, 10-minute, or 15-minute intraday charts.
Compliance Statement:
Fully compliant with TradingView House Rules. Original work, not derived from publicly available scripts.

Price Widget on ScreenSimple yet useful script, to see the PRICE/CHANGE of the chart you are on. I use it in my 6/8 charts screen, so you can see the graph and the price.

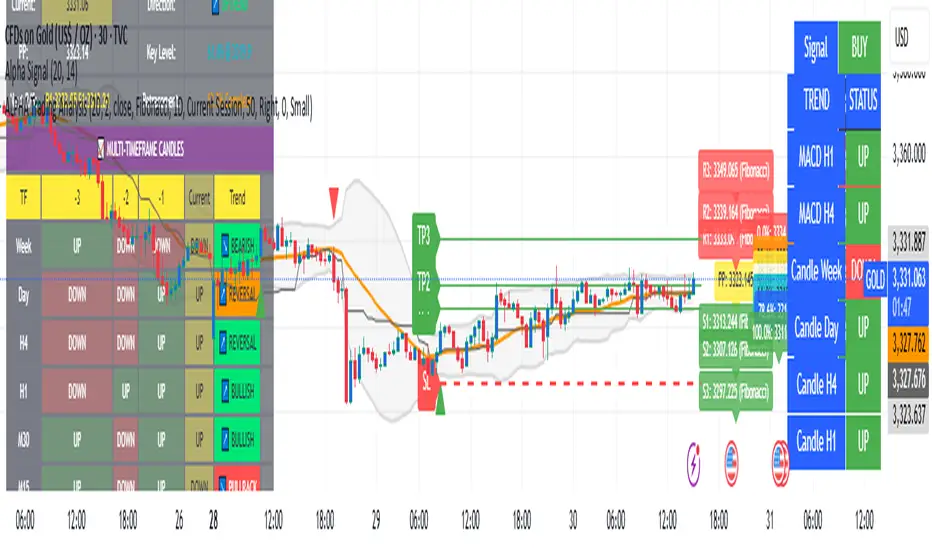
Alpha Trading AnalysisAlpha Trading Dashboard Analysis
- Candle Analysis
- Pivot Point and Fibonacci
- Bollinger band
Hurst Criticality EngineThe Hurst Criticality Engine (HCE) is an advanced trading indicator designed to detect potential breakout (BUY) and exhaustion (SELL) conditions by combining multi‑scale Hurst exponent analysis with tactical confirmations such as VWAP, RSI, volume spikes, Fibonacci log‑periodic patterns and price channels.
It is optimized for traders seeking structured confluence in volatile or trending markets, and can be applied across different timeframes, from intraday scalping (1m–15m) to swing trading (1h–4h).
What It Does
HCE identifies potential turning points and momentum shifts by evaluating market persistence and volatility across several dimensions. It generates three main types of labels:
CRITICAL Signals: Triggered when multiple Hurst scales align and tactical validations confirm the setup. These can indicate breakout (BUY) or exhaustion (SELL) conditions.
CPC (Critical Pivot Confirmation): Appears at structural highs or lows validated by Hurst exponent alignment and VWAP context.
PIVOT Labels: Marks confirmed structural highs (▼) and lows (▲) that can be used to anticipate reversals or continuation setups.
A dynamic Tactical Panel shows real‑time information on signal strength, VWAP zones, last confirmed signals and the current alignment of the Hurst scales.
How It Works
The indicator integrates several analytical components, each designed to filter noise and add context:
Hurst Exponent Analysis:
Evaluates price persistence across up to five customizable time scales (default: 10, 20, 40, 80, 160 bars).
A signal is considered when at least a minimum number of scales (default: 3) align as bullish (>0.6) or bearish (<0.4).
Rolling VWAP with Standard Deviation Bands:
Plots a rolling VWAP and three customizable bands (±1σ, ±2σ, ±3σ).
Signals are validated if price is correctly positioned relative to VWAP (above for BUY, below for SELL) or if it breaks the outermost band, suggesting volatility extremes.
RSI and Volume Confirmation:
Uses RSI (default: 14‑period) to confirm momentum alignment (e.g., oversold for BUY, overbought for SELL).
Incorporates volume spikes (default: 1.5× average) as an additional confirmation of institutional participation.
Fibonacci Log‑Periodic Patterns:
Validates critical signals by checking whether price oscillations align with harmonic Fibonacci ratios (default: 0.618).
Channel Detection:
Runs a 50‑bar regression channel to identify structural boundaries.
Signals are reinforced when price interacts significantly with channel extremes or breaks out from them.
Dynamic Scoring System:
Every signal receives a score from 0 to 8 based on the confluence of all the above factors.
Scores ≥6 indicate strong alignment, 4–5 medium, 2–3 weak and ≤1 neutral.
Why This Combination?
Each component provides different insights: the Hurst exponent captures market persistence, VWAP defines value areas, RSI and volume confirm momentum and participation, while Fibonacci and channels provide structural references. This synergy allows HCE to filter noise and focus on conditions where multiple factors align, increasing the reliability of the setups.
How to Use It
Add the Indicator to the Chart:
Works on any instrument and timeframe (e.g., 1m, 5m, 15m for scalping; 1h, 4h for swing trading).
Configure Settings:
General Parameters: Set the minimum number of Hurst scales, cooldown between signals and spacing mode (manual or adaptive).
Tactical Validations: Enable or disable RSI, volume, Fibonacci or channel filters.
VWAP Settings: Adjust length (default: 50 bars) and deviation bands.
Hurst Scales: Enable up to five scales and customize their lengths.
Tactical Panel and Labels: Choose compact or detailed view and toggle the display of CRITICAL, CPC, PIVOT or Observation labels.
Interpret Signals:
CRITICAL (B/S): Labels appear above/below price with tooltips showing the signal score, VWAP status and momentum context.
CPC (⚡CPC↑ / ⚡CPC↓): Indicates critical pivots confirmed at structural highs or lows.
PIVOT (▲ / ▼): Marks confirmed highs/lows for additional context.
Observation Labels (⚠️): Highlight potential setups not meeting full CRITICAL criteria.
Monitor the Tactical Panel:
Displays the VWAP zone, number of aligned Hurst scales, signal score and last confirmed signals.
Recommendations
Use HCE as a confluence filter, not as a standalone entry tool.
Focus on signals with Medium (4–5) or Strong (≥6) scores.
Combine CPC and PIVOT labels with broader context for swing or reversal trades.
Apply on clean charts (without overlapping indicators) for optimal visualization.
Always use proper risk management, as no indicator can predict outcomes with certainty.
Chart Setup and Alerts
The script includes customizable alerts for CRITICAL, CPC, PIVOT and VWAP breakouts.
For clear visualization, use it on charts without clutter.
Works best on liquid markets (e.g., forex, crypto, stocks) and in volatile or trending conditions

🔁 A.X.I.S Fibonacci Engine V2 – Smart Projected Pathway🔁 A.X.I.S Fibonacci Engine V2 – Smart Projected Pathway indicator
The A.X.I.S Fibonacci Engine V2 is a next-generation Fibonacci projection tool designed for traders seeking advanced, adaptive levels that respond to true multi-timeframe market structure. Built from the ground up for active traders—scalpers, swing traders, and position players—it fuses traditional Fibonacci logic with dynamic price projection and smart anchor logic.
How It Works:
Multi-Timeframe Anchoring:
Anchors your Fibonacci levels to High Timeframe (HTF) pivots for powerful bias and “macro” market structure, while also utilizing Low Timeframe (LTF) swing detection for precise “micro” projection and pathway analysis.
Dynamic Pathway Projection:
Beyond static lines, this engine allows Fibonacci levels to be projected forward, following the price path between significant swings—giving you projected targets and active “pathways” instead of just fixed retracement bands.
Trend-Adaptive Logic:
Determines bullish/bearish bias based on where HTF price closes relative to a moving average (HTF EMA-20), meaning the plotted fibs automatically adjust to uptrends or downtrends. No need to guess direction.
Auto-Cleanup & Smart Management:
Old lines and labels are deleted automatically to keep your chart clean, and levels are recalculated with every new significant swing (“leg”)—no manual intervention needed.
Key Features:
Multi-Timeframe Input:
Choose both HTF (for “anchor” pivots) and LTF (for “projection” pivots) independently.
Fine-tune swing sensitivity for both anchors and pathway pivots.
Classic + Projected Mode:
Choose between standard horizontal Fibs or enable Dynamic Pathway Mode to project levels diagonally into future bars, creating “fib pathways.”
Color Customization:
Individualize bullish/bearish fib colors, line style (solid, dashed, dotted), thickness, label position, and transparency.
Special “golden zone” highlighting for the most critical levels (0.618/0.786).
Visual Anchors:
Optionally plot markers for HTF swing pivots for extra clarity.
Chart Cleanliness:
Script manages and deletes its own objects—no more chart clutter!
Real-Time Auto-Update:
All levels and pathways update in real time as market structure changes.
User-Friendly Labels:
Toggle on/off fib level labels, with position and background adjustments.
Practical Trading Applications:
Swing/Position Trading:
Use HTF pivots for macro context, then project LTF fibs into the future for potential reversal/extension targets.
Scalping:
Deploy on lower timeframes with micro pivots for intraday levels and short-term projected moves.
Dynamic Take-Profit & Entry Zones:
Identify evolving TP and re-entry zones as price carves out new swings, even in choppy or trending conditions.
Trend Confirmation:
Let the engine determine trend direction, so your fibs are always aligned with prevailing momentum.
How to Use:
Add to Chart:
Apply the indicator to any chart or timeframe.
Set Your Anchors:
Pick the HTF (anchor) and LTF (projection) timeframes.
Adjust swing sensitivity (lookback) as needed.
Enable/Disable Dynamic Pathway:
For regular fibs, leave off.
For projected “pathways,” turn it ON—lines will project forward along the likely path of the next move.
Adjust Colors, Labels, and Styles:
Fine-tune everything for clarity and your personal style.
Watch for Changes:
As new pivots form, the script will update levels in real time, keeping your roadmap fresh.
(Optional) Show Macro Swings:
Toggle on/off to plot markers for the most recent HTF pivots.
Who Is It For?
Day traders, scalpers, and swing traders wanting true projected price targets—not just static fibs.
Traders tired of redrawing fibs after every new swing.
Anyone who wants a clean, dynamic, and truly adaptive fib tool that blends macro and micro market structure into one engine.
What Makes It Different?
True multi-timeframe awareness:
Adapts to both macro (HTF) and micro (LTF) structure.
Automatic trend recognition:
Fibs align with price action—no manual flipping.
Projected, not just static:
See where fib levels could land, not just where they were.
Cleanest chart management:
Deletes its own lines and labels on every update—no mess, ever.
Note:
This tool is for educational and informational purposes only. Not financial advice. Always use proper risk management!
Any issues or feature requests? Drop a comment below or reach out!
Happy trading and welcome to the A.X.I.S revolution.
— I5X-Albatross

SMT Divergences V2 [OutOfOptions]Smart Money Technique (SMT) Divergence is designed to identify discrepancies between correlated assets within the same timeframe. It occurs when two related assets exhibit opposing signals, such as one forming a higher low while the other forms a lower low. This technique is particularly useful for anticipating market shifts or reversals before they become evident through other Premium Discount (PD) Arrays.
This indicator works by identifying the highs and lows that have formed for an asset on the current chart and the correlated symbol defined in the settings. Once a pivot on either asset is formed, it checks if the pivot has taken liquidity as identified by the previous pivot in the same direction (i.e., a new high taking out a previous high). If this is the case and the corresponding asset has not taken a similar pivot, the condition is determined to be a potential valid divergence. The indicator will then filter out SMTs formed by adjacent candles, requiring at least one candle difference between the candles forming the SMT.
If the “Candle Direction Validation” setting is enabled, the indicator will further check both assets to ensure that for bullish SMTs, the last high on both assets was formed by down candle, and for bearish SMTs, the low was formed by an up candle. This check can often eliminate low-probability SMTs that are frequently broken.
The referenced chart shows divergence between Nasdaq (NQ) and S&P 500 (ES) futures, which are normally closely correlated assets that move in the same direction. The lines shown represent bullish and bearish divergences between the two when they are formed. As you can see from the chart, SMT Divergences may not always indicate a reversal, or a reversal might be just a short-term retrace. Therefore, SMT Divergences should not be used independently. However, in conjunction with other PD arrays, they can provide strong confirmation of a change in market direction.
Configurability:
Pivot strength - Indicates how many bars to the left/right of a high for pivot to be considered, recommended to keep at 1 for maximum detection speed
Candle Direction Validation - Additional SMT validation to filter out weak/low-probability SMTs be examining candle direction
Remove Broken SMTs - Keeps the chart clean by removing broken (invalidate) SMTs from the chart, once price moves beyond the outmost edge of the SMT
Work in Realtime - Enabled real-time mode for even faster detection of SMTs
Line Styling for Bullish/Bearish SMTs - Ability to customize line style, color & width for bullish/bearish SMTs
Label Control - Whether or not to show SMT label and if shown what font size & color should be used and if labels should include a tooltip containing information about the SMT
What makes this indicator different:
When used on NQ/ES it will automatically detect the matching the corresponding ticker, i.e. if you have chart on NQU2025 it'll automatically match to ESU2025 and vice-versa. Works for mini/micro/continuous contract
Unlike other SMT indicators, this indicator has an option to remove broken (no longer valid SMTs)
Allows real-time detection of SMTs prior to the pivot being fully formed
Allows validation of SMTs to only display high-probability SMTs, that are more likely to signal a possible reversal
Includes alerting capability for both SMT creation and when the SMT is broken (invalidated)
