Support & Resistance Automated📌 Support and Resistance Automated (Pivot-Based)
Support and Resistance Automated is a lightweight and fully automated indicator that plots key support and resistance levels using pivot highs and pivot lows. It helps traders quickly identify important price reaction zones without manual drawing.
This indicator is especially useful for price-action traders, swing traders, and intraday traders who rely on clean charts and objective levels.
🔍 How It Works
Pivot Highs → Resistance Levels
Pivot Lows → Support Levels
Each detected pivot creates a horizontal dotted line that extends forward, allowing you to observe how price reacts over time.
Once a level is formed, it is kept permanently on the chart — no repainting, no disappearing levels.
⚙️ Customizable Settings
You can easily adjust:
Left & Right Pivot Bars – control how strong a pivot must be
Line Extension Length
Line Width
Support & Resistance Colors
Show / Hide Pivot Highs and Pivot Lows independently
This flexibility allows the indicator to adapt to intraday, swing, or higher-timeframe analysis.
✅ Key Features
✔ Fully automatic support & resistance detection
✔ Based on proven pivot-point logic
✔ No repainting
✔ Clean, minimal chart appearance
✔ Unlimited support & resistance levels
✔ Works on all timeframes & instruments
📈 Best Use Cases
Identifying key demand and supply zones
Planning entries, targets, and stop-losses
Confluence with price action, RSI, moving averages
Breakout and rejection-based strategies
Pivot-points

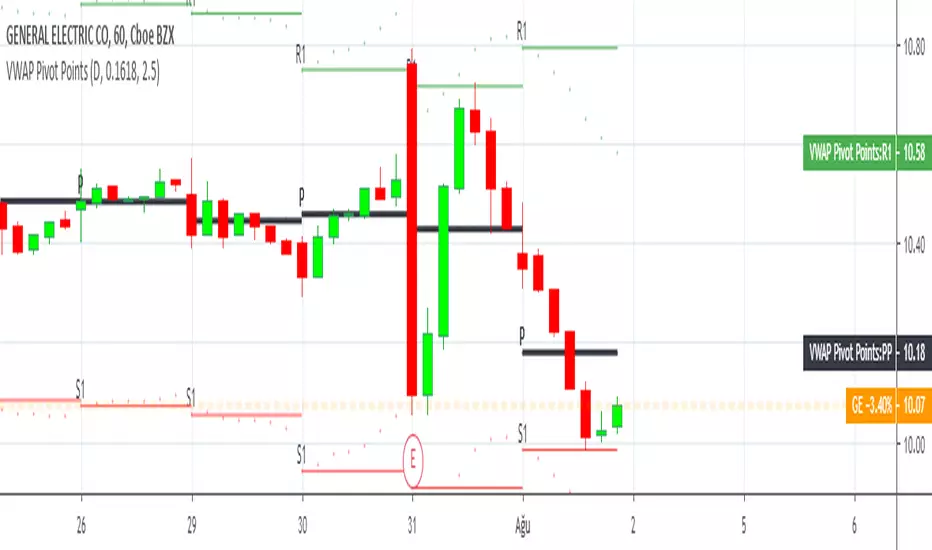
Pivot Points Standard w/ Future PivotsPivot Points Standard with Future Projections
This indicator displays traditional pivot point levels with an added feature to project future pivot levels based on the current period's price action.
Key Features:
Multiple Pivot Types: Choose from Traditional, Fibonacci, Woodie, Classic, DM, and Camarilla pivot calculations
Flexible Timeframes: Auto-detect or manually select Daily, Weekly, Monthly, Quarterly, Yearly, and multi-year periods
Future Pivot Projections: Visualize potential pivot levels for the next period based on current price movement
Custom Price Scenarios: Test "what-if" scenarios by entering a custom close price to see resulting pivot levels
Customizable Display: Adjust line styles, colors, opacity, and label positioning for both historical and future pivots
Historical Pivots: View up to 200 previous pivot periods for context
Future Pivot Options:
The unique future pivot feature calculates what the next period's support and resistance levels would be using the current period's High, Low, Open, and either the current price or a custom price you specify for the closing value. Future pivots are displayed with customizable line styles (solid, dashed, dotted) and opacity to distinguish them from historical levels.
Use Cases:
Plan entries and exits based on projected support/resistance
Scenario analysis with custom price targets
Identify key levels before the period closes
Multi-timeframe pivot analysis
Works on all timeframes and instruments.

Support & Resistance Trendlines with PP + Fib. Channel█ Support & Resistance Trendlines with Pivot Points + Fibonacci Channel
This script automatically draw support and resistance trend lines based on pivot points and add a fibonacci channel.
It will show potential patterns with the help of support and resistance lines as well as breakout target and pullback entry with the fibonacci extension and retracement levels.
It is based on atolelole's script, I only made it more configurable so please check out his script.
I added the possibility to change values and add additional retracement and extension levels.
I also made it customizable with the possibility to change lines color, width and style.

Pivot Order Blocks// How it Works \\
Order Blocks based on pivot reversal candle
When a pivot High or Pivot Low is found and confirmed, a box will be plotted on the open and close values of that pivot candle
// Settings \\
In the settings you have the ability to change the distances required to confirm an pivot High or Low
These are the lengths where the script checks to see if it is at its local high or low.
You also have the ability to change the amount of candles the box stretches over as well as the colors of the bullish and bearish boxes
// Use Case \\
Pivot points often provide Support and Resistance points on their own,
one way of marking up order blocks is by taking the pivot candle and marking that up as a resistance area where you could be looking for price to reverse
// Suggestions \\
Happy for anyone to make any suggestions on changes which could improve the script,
// Terms \\
Feel free to use the script, If you do use the script could you please just tag me as I am interested to see how people are using it. Good Luck!

Logging in Pine ScriptI'm building quite a lot of pretty complicated indicators/strategies in Pine Script. Quite often they don't work from the 1 try so I have to debug them heavily.
In Pine Script there are no fancy debuggers so you have to be creative. You can plot values on your screens, check them in the data window, etc.
If you want to display some textual information, you can plot some info as labels on the screen.
It's not the most convenient way, so with the appearance of tables in Pine Script, I decided to implement a custom logger that will allow me to track some useful information about my indicator over time.
Tables work much better for this kind of thing than labels. They're attached to your screen, you can nicely scale them and you can style them much better.
The idea behind it is very simple. I used few arrays to store the message, bar number, timestamp, and type of the message (you can color messages depend on the type for example).
There is a function log_msg that just append new messages to these arrays.
In the end, for the last bar, I create the table and display the last X messages in it.
In parameters, you can show/hide the entire journal, change the number of messages displayed and choose an offset. With offset, you can basically scroll through the history of messages.
Currently, I implemented 3 types of messages, and I color messages according to these types:
Message - gray
Warning - yellow
Error - red
Of course, it's a pretty simple example, you can create a much fancier way of styling your logs.
What do you think about it? Is it useful for you? What do you use to debug code in Pine Script?
Disclaimer
Please remember that past performance may not be indicative of future results.
Due to various factors, including changing market conditions, the strategy may no longer perform as good as in historical backtesting.
This post and the script don’t provide any financial advice.

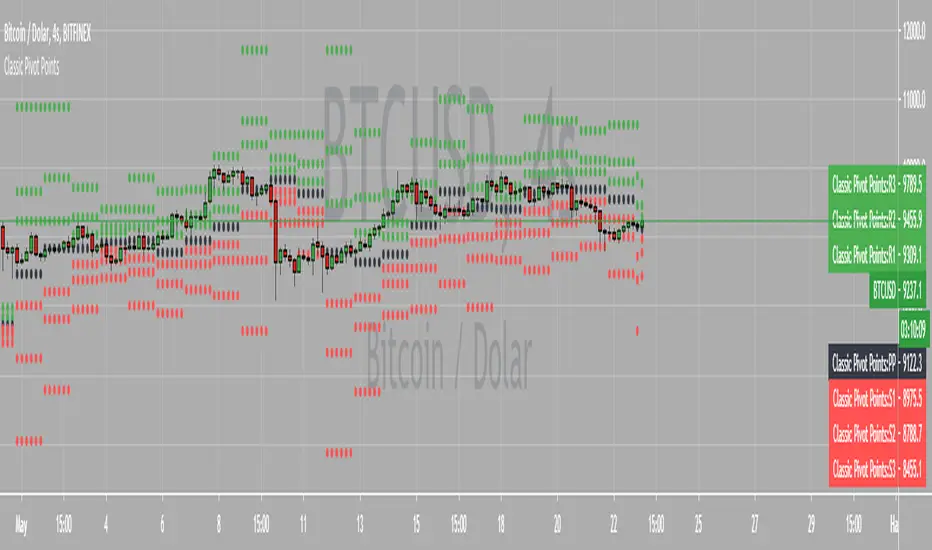
Chonky Pivot Pointsstandard pivot points re-written with circle plots.
Only shows the current pivot points. P, R1/R2, S1/S2
I don't use R3, R4 etc. so I didnt include them but feel free to modify the code.
You can change the resolution in indicator settings, default is set to Monthly.
Also to change the size of the circles all at once, you can input a number 1-4 in the inputs section.