Weighted ATRWeighted ATR is a volatility indicator that computes True Range and smooths it using a selectable kernel (native Wilder ATR, SMA, EMA, WMA, VWMA, or HMA). It outputs a single volatility line in price units for risk sizing, stop distances, and regime filtering.
Wskaźniki i strategie

SR Channel + EMA + RSI MTF + VolHighlight - Edited by MochiSR + Volume + RSI MTF – edited by Mochi
This indicator combines three tools into a single script:
SR Zones from Pivots
Automatically detects clusters of pivot highs/lows and groups them into support and resistance zones.
Zone width is tightened using a percentage of the pivot cluster range so levels are more precise and cleaner.
Each zone includes:
A colored box (SR area),
A dashed midline,
A POC line (price level with the highest traded volume inside the zone),
A label showing the zone price and distance (%) from current price.
Zone color is dynamic but simple and stable:
If price closes below the mid of the zone → it is treated as resistance (red).
If price closes above the mid of the zone → it is treated as support (green).
Box, lines, and label always share the same color.
Volume Inside the Zone + POC
Calculates buy/sell volume for candles whose close lies inside each zone.
Uses abs(buyVol − sellVol) / (buyVol + sellVol) to measure volume imbalance and control box opacity:
Stronger, more one‑sided volume → darker box (stronger zone).
POC is drawn as a thin line with the same color as the zone to highlight the best liquidity level for entries/TP.
Multi‑Timeframe RSI Dashboard
Shows RSI(14) values for multiple timeframes (1m, 5m, 15m, 30m, 1h, 4h, 8h, 1d), each can be toggled on/off.
Background color of each RSI cell:
RSI > 89 → red (strong overbought),
80–89 → orange (warning area),
RSI < 28 → lime (strong oversold),
Otherwise → white (neutral).
The goal of this script is to give traders a clear view of:
Key support/resistance zones,
Their volume quality and POC,
And multi‑TF overbought/oversold conditions via the RSI dashboard – all in one indicator to support retest/flip‑zone trading.

MA150 Respect Ratio (ATR-adjusted)This indicator measures how reliably price respects the 150-day moving average as support.
It computes an empirical probability (Respect Ratio) based on historical interactions with MA150:
– Dynamic touch tolerance based on ATR
– Optional shallow breaks allowed (user-defined)
– Trend filter (MA150 rising + price above)
– Minimum event count for statistical reliability
The output is a probability score (0–1) indicating how often MA150 held as support when tested.
This tool is intended for research and decision support, not as a standalone trading signal.

Simple ATR Volatility Context v1.0This indicator provides a simple visual view of market volatility using ATR expressed as a percentage of price. It is designed to help identify when a market transitions from low-activity (compression) to higher-activity (expansion).
What it does
Calculates ATR as a percentage of price
Highlights the chart when volatility exceeds a user-defined threshold
Helps distinguish between quiet markets and trade-worthy conditions
How to use it
Green background indicates elevated volatility
Neutral / muted background indicates low volatility
Use alongside your own trend, structure, or entry tools
What this is not
Not a buy or sell signal
Not predictive
No performance claims
This tool is intended for market context and awareness, not standalone trading decisions.

Price Levels [TickDaddy]I hope you enjoy this indicator as much as I do!
it draws out price levels to your liking, by ticks or points, how many ticks/points between levels, very customizable. it also has an info box showing how many ticks/points between levels as well as dollar amount for that level, and you can change contract size as well as micros or minis just to see if price moved that distance, what you can expect to make.
any feedback greatly appreciated.

ATR Volatility FilterA Basic Volatility Filter
3 Modes
1- Absolute ATR filter
2- Filter Based on ATR threshold relative percentage of the price
3- ATR Threshold relative to its moving average

PSP 4H USD Divergence Highlighter (EURUSD + GBPUSD vs DXY)PSP indicator for the 4H chart. This compares the divergence between the EURUSD, GBPUSD, & DXY

Absolute VWAP and EMA9 Difference indicator - TF Pascal
The Absolute VWAP–EMA9 Difference indicator measures the absolute distance between the session’s VWAP and the EMA 9, highlighting the magnitude of separation regardless of direction. A 100-period moving average of this difference shows the typical distance. Low values indicate price near fair value and low momentum, while high values suggest strong momentum or overextension.
built for the M1 chart

Impulse Trend Suite LITE🚀 Impulse Trend Suite LITE
Smart trend visualization with precise flip arrows. A lightweight, momentum-filtered trend tool designed to stay clean, avoid repeated signals, and keep you focused only on real market direction.
🔍 Quick Guide
BUY setup = green arrow + green background
SELL setup = red arrow + red background
Stay in the move while color doesn’t change
ATR channel helps avoid chasing overextended candles

Multiple Time Frame Stoch-RSIThis indicator is designed to show users the values for default stochastic RSI and default RSI settings across multiple time frames.
I have made many bad trades focusing too closely on one particular time frame and indicators that suggest the price will move one way, to be superseded by a higher timeframe pushing price in another direction.
The timeframes are customisable so you can select your own timeframes, but the default timeframes chosen here are part of the BareNaked Crypto or Naked Nation strategy, looking at timeframes in multiples of 3 for lower timeframes.
The idea in its simplest form is that when timeframes like the 3/6/9m are all over sold or over bought (coloured red or green) then it could be a suitable time to place an order. Or at least be more favourable for your trade.
This indicator as with all indicators is designed as a tool to add to whatever arsenal of strategy or tools you are already using and does not constitute financial advice, just be cause 3/6/9m is in red or green does not guarantee that the trade will go your way.
The orange on the timeframes are generally designed to show users where price can reverse so for example if the stochastic 3m is at 10 and in green, but the 9m is at 65 in orange, it could be that a push up is not finished and the 9m drop from oversold to 65 could be reversed due to a low 3m stochastic number and then 9m goes from 65 back up to 100, and vice versa.
The arrows for direction also allow you to quickly deduce the direction of the stochastic RSI, ^ up, V down, and stable -. this should allow you to see if the stochastic has been rising and is beginning to turn around or not.

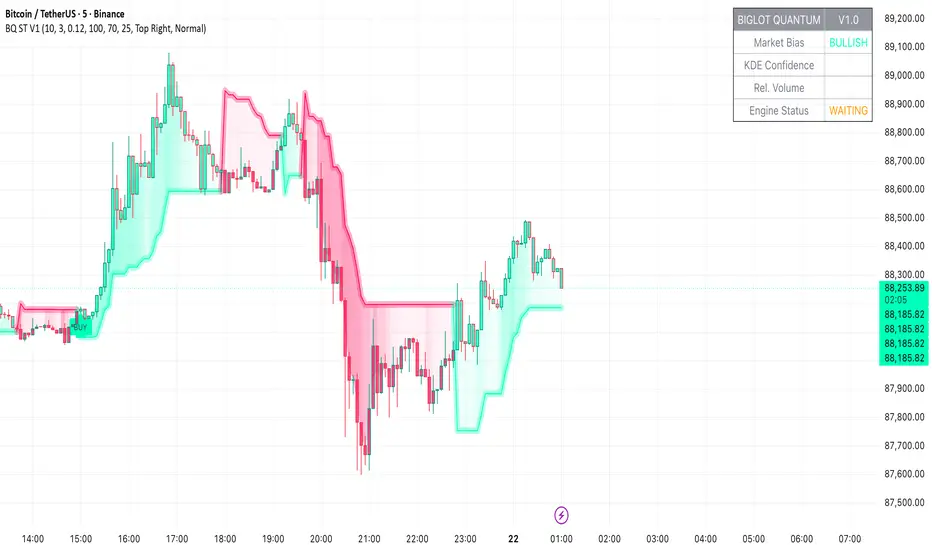
BigLot Quantum SuperTrend V1BigLot Quantum SuperTrend V1 is a trend-following indicator that enhances the traditional SuperTrend by integrating statistical volume analysis.
The script combines an ATR-based SuperTrend engine with Kernel Density Estimation (KDE) applied to relative buy and sell volume. Volume behavior is modeled statistically, allowing the indicator to filter breakout signals and activate only when volume conditions show high probability compared to historical data.
Bullish and bearish signals are generated when price crosses the SuperTrend line and the corresponding volume probability exceeds a user-defined threshold. This approach helps reduce false signals during low-liquidity or sideways market conditions.
The script includes visual trend highlighting, probability-based confidence filtering, and a real-time dashboard displaying trend direction, volume strength, and signal status. It is designed to work across all markets and timeframes without repainting.
Dynamic EMA Trend Table [Customizable]Overview
The Dynamic EMA Trend Table is a comprehensive dashboard designed to give traders an instant overview of the market trend across five distinct Exponential Moving Averages (EMAs). Instead of cluttering your chart with multiple lines, this script organizes the data into a clean, customizable table, allowing you to assess trend alignment at a glance.
How It Works
This indicator calculates five user-defined EMAs (defaulting to the popular 5, 20, 50, 100, and 200 periods). It then compares the Current Price against each EMA value to determine the immediate trend status:
Bullish State: When the current price is above the specific EMA, the table cell turns Green (customizable).
Bearish State: When the current price is below the specific EMA, the table cell turns Red (customizable).
This logic allows swing traders and scalpers to instantly see if the asset is in a strong uptrend (all cells Green), a strong downtrend (all cells Red), or a consolidation phase (mixed colors).
Key Features
Fully Customizable Periods: Change the length of all 5 EMAs to fit your specific strategy (e.g., Fibonacci numbers or standard Swing Trading settings).
Dynamic UI: Position the table anywhere on the screen (Top/Bottom/Left/Right) and adjust the size to fit your screen resolution.
Visual Cleanliness: You can choose to show the table only, or toggle the "Show EMAs on Chart" option to plot the actual lines on your chart.
Smart Coloring: The lines on the chart (if enabled) inherit the same color logic as the table—turning Green when price is above them and Red when price is below.
Settings & Configuration
Price Source: Select Close, High, Low, etc. (Default is Close).
Table Position & Size: Customize where the dashboard appears.
EMA Lengths: Set your 5 preferred lookback periods.
Color Theme: Fully adjustable colors for Bullish, Bearish, Neutral, and Background elements to match your chart theme (Dark/Light mode friendly).
Use Case Example
Trend Confirmation: A trader looking for a "Buy" entry might wait for the short-term EMAs (5 and 20) and the medium-term EMA (50) to all turn Green in the table before entering.
Support/Resistance Watch: By quickly glancing at the values in the table, you can see exactly where the 200 EMA sits without needing to scroll back on your chart to find the line.

NeuralFlow Forecast Levels - User InputsThis is a companion indicator that plots AI-adaptive market equilibrium and expansion mapping levels directly on the SPY chart.
NeuralFlow Forecast Levels are generated through a Artificial Intelligence framework trained to identify:
Where price is statistically inclined to re-balance
Where expansion zones historically exhaust rather than extend
This is structure mapping, not prediction.
......................................................................................
What the Bands Represent?
AI Equilibrium (white core)
Primary weekly balance zone where price is most likely to mean-revert.
Predictive Rails (aqua / purple)
High-confidence corridor of institutional flow containment.
Outer Zones (green / red)
Expansion limits where continuation historically begins to decay.
Extreme Zones (top / bottom)
Rare deviation envelope where auction completion is statistically favored.
.The engine updates only when underlying structure changes —
not when candles fluctuate intraday.
.................................................................................................................
Usage Context
These levels are contextual reference zones, not entry signals. They are designed to answer:
Where does price matter?
Where does continuation weaken?
Where does balance statistically reassert itself?
Risk Disclaimer
Educational and analytical use only. Not financial advice.

Kira Buy Sell EMA & VWAP Trend IndicatorThis indicator provides buy and sell signals based on short-term
momentum shifts while aligning trades with the broader market
trend.
Core logic:
• Fast and slow EMAs are used to identify short-term momentum
changes
• VWAP is applied to confirm price acceptance in the trade
direction
• A higher-period EMA is used as a trend filter to reduce
counter-trend signals
Buy signals are generated when bullish momentum aligns with
VWAP positioning and the prevailing trend. Sell signals are
generated when bearish momentum aligns with VWAP and the
broader trend direction.
This approach keeps the logic simple and responsive while
helping to avoid signals during unfavorable market conditions.
Best suited for liquid stocks and indices on intraday
timeframes such as 5-minute to 1-hour charts.
This script does not repaint and is intended as a
decision-support indicator, not a standalone trading system.

Pre-Market + Daily + Weekly REGULAR HOURS 📦 Pre-Market + Daily + Weekly RTH Range Boxes
This indicator automatically plots Pre-Market, Daily, and Weekly range boxes based strictly on US Regular Trading Hours (RTH).
What it does:
Pre-Market Box (04:00–09:30)
Captures the full pre-market high and low, then projects the range forward from the RTH open.
Daily RTH Box (09:30–16:00)
Tracks the previous day’s regular session high and low and plots the range starting at 04:00 AM the next day.
Weekly RTH Box (Mon–Fri, 09:30–16:00)
Accumulates the full weekly RTH range and plots it at 04:00 AM on Monday.

VOLD RatioThis indicator calculates the ratio between NYSE Up Volume and Down Volume (USI:UVOL / USI:DVOL).
It helps assess market participation and short-term buying vs. selling pressure.
Higher values indicate dominant buying volume, while lower values suggest increasing selling pressure.
Useful as a breadth and confirmation tool alongside index price action.

Cantillon Clean Moving Averages [Free]Overview Standard Moving Averages are static. The Cantillon Clean MA is dynamic. It automatically changes color based on price interaction, giving you an instant visual read on the trend health of the Short (20), Medium (50), and Long (200) term flows.
Features
Dynamic Coloring: Green when Bullish, Red when Bearish.
Smart Weighting: Uses Exponential Moving Averages (EMA) to react faster than standard SMAs.
Crossover Signals: Subtle "X" markers when the short-term trend flips.
Want the Real Institutional Trend? Moving averages lag. To track the True Institutional Cost Basis (Anchored VWAP) and statistical reversal points, you need the Cantillon Terminal .

yon Price Above 200 EMA & RSI < 11The indicator will highlight potential oversold bounce opportunities when price is in an uptrend (above 200 EMA) but temporarily oversold on the RSI-2.
Check on youtube for video that explains the mechanics of Larry Connors' 2-period RSI strategy and how it differs from traditional RSI use, which is essential for applying it to volatile instruments like 0DTE QQQ.

RVOL Text This script will give you the Relative volume at the time in a numbered text on your charts.

RSI Strategy with Auto Tuner (PF)# RSI Auto‑Tuner Strategy — How To Use
This document explains **how to use** the RSI Auto‑Tuner strategy. It intentionally avoids math and implementation details. Follow this as an operating guide.
---
## 1. What This Tool Is For
This strategy helps you:
* Discover **which RSI length works best** on a given ticker and timeframe
* Measure performance using **Profit Factor (PF)**
* Improve RSI performance on noisy markets by **transforming price first**
The auto‑tuner is a **research tool**, not a live trading signal generator.
---
## 2. Two Modes You Must Treat Differently
### Research Mode
Used to explore and discover parameters.
* Auto‑Tune: **ON**
* Parameters are allowed to change
* Results may look very good
* Overfitting risk is real
### Trading Mode
Used for forward testing or live trading.
* Auto‑Tune: **OFF**
* Parameters are fixed
* Behavior is stable and repeatable
* This is the only acceptable mode for live use
**Never trade live with Auto‑Tune enabled.**
---
## 3. Manual Mode (Trading Mode)
Use this after parameters are finalized.
Steps:
1. Set **Auto‑Tune = OFF**
2. Choose:
* Source (raw price or transformed price)
* RSI Length (manual, default 14)
* Oversold / Overbought levels
3. The strategy will:
* Enter long when RSI crosses up through Oversold
* Enter short when RSI crosses down through Overbought
* Flip positions on opposite signals
This mode is predictable and safe for forward testing.
---
## 4. Auto‑Tune Mode (Research Mode)
Use this to find optimal RSI lengths.
Steps:
1. Set **Auto‑Tune = ON**
2. Configure the search range:
* Minimum Length (default 5)
* Maximum Length (default 14)
* Step Size (default 1)
3. The strategy will:
* Internally simulate trades for each RSI length
* Track gross profit, gross loss, and trades
* Select the length with the highest Profit Factor
4. The best length is applied automatically
Auto‑Tune evaluates historical data only.
---
## 5. Using a Transform on Price (Critical)
RSI does **not** have to run on raw price.
You can significantly improve results by:
* Applying a **price transform** first
* Feeding the transformed series into the RSI Source input
Examples of transforms:
* Moving averages
* Low‑pass filters
* Butterworth filters
* Any smoother or denoiser
Why this works:
* Busy, wicky markets cause RSI to whipsaw
* Transforms remove micro‑noise
* RSI responds to structure instead of chaos
* Profit Factor often increases dramatically
Best practice:
* Auto‑tune on raw price
* Auto‑tune on transformed price
* Compare PF, trade count, and stability
---
## 6. Reading the Status Label
At the last bar, the on‑chart label shows:
* Whether Auto‑Tune is ON or OFF
* Whether candidates were built successfully
* Number of RSI lengths tested
* Best RSI length found
* Profit Factor and trade count
If Auto‑Tune is OFF, the label shows the manual length.
---
## 7. Recommended Workflow
1. Choose ticker and timeframe
2. Enable Auto‑Tune on **raw price**
3. Record best RSI length and PF
4. Enable Auto‑Tune on **transformed price**
5. Compare results
6. Lock parameters
7. Disable Auto‑Tune
8. Forward test
---
## 8. Warnings and Discipline
* High PF with few trades is unreliable
* Transforms can hide execution costs
* Always validate on a different period
* Auto‑Tune is a **lens**, not an edge
Treat this tool as a research microscope, not an autopilot.

Optimized Options Day Trading Script -Anurag Dec20-2025This indicator is a specialized Multi-Timeframe Trend & Regime System designed specifically for intraday trading on SPY, QQQ, and SPX. It is optimized for high-volatility execution (like 0DTE) by filtering out "choppy" low-probability conditions before they happen.
Unlike standard indicators that only look at the current chart, this script runs a background check on the 15-Minute Timeframe

Performance with Okuninushi Line Area Determinations**Performance Indicator with Market Structure Analysis**
Building upon TradingView's official Performance indicator, I've added a custom column to assess current market structure using my Okuninushi Line methodology, which visualizes the AB structure concept.
**What is the AB Structure?**
The AB structure identifies equilibrium levels based on recent price action. The Okuninushi Line calculates the 50% midpoint between the highest high and lowest low over a specified lookback period. In this implementation, I use a 65-day period on the daily timeframe (representing one quarter: 13 weeks × 5 trading days), though this is fully customizable.
**Market Structure Classification:**
- **Above Okuninushi Line** → "upper to okuni" → Price is in the **Premium Area** (bullish structure)
- **Below Okuninushi Line** → "down to okuni" → Price is in the **Discount Area** (bearish structure)
This additional column provides an instant visual reference for whether each asset is currently trading above or below its equilibrium level, complementing the traditional performance metrics with structural context.
---

High/Low Tracker ARDR/ADR V4High and lows in 2 timeframes
16:00 -> 03:55
19:30 -> 02:55
Toggle on/off of
- Auto extending untill 09:25
- Live updating during price action
Configure linestyles, box styles
It is now displaying correctly for both CL and ES
