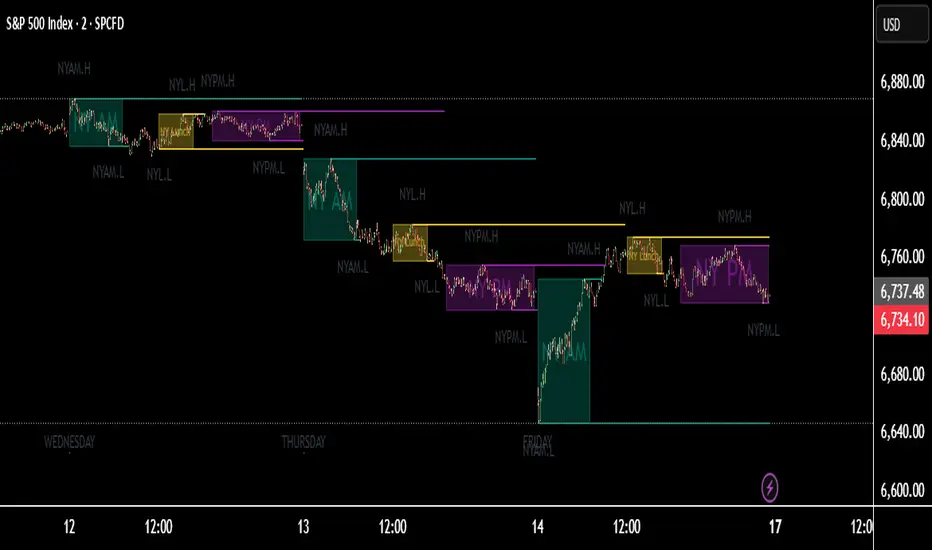
TNT TRADER Sessions and Zones Premarket sessions and zone indicator full customization for premarket, yesterdays high and low , london, asia after hours etc.
Wskaźniki i strategie
TNT TRADER MARKET ClOSEVertical Line of red showing the New York market close. Color and time can be changed

TNT TRADER EMA FANEMA fan of 8 20 50 200, very simple and straight forward with color change options.

Slope Rank ReversalThis tool is designed to solve the fundamental problem of "buying low and selling high" by providing objective entry/exit signals based on momentum extremes and inflection points.
The System employs three core components:
Trend Detection (PSAR): The Parabolic SAR is used as a filter to confirm that a trend reversal or transition is currently underway, isolating actionable trade setups.
Dynamic Momentum Ranking: The indicator continuously measures the slope of the price action. This slope is then ranked against historical data to objectively identify when an asset is in an extreme state (overbought or oversold).
Signal Generation (Inflection Points):
Oversold/Buy: A 🟢 Green X is generated only when the slope ranking indicates the market is steeply negative (oversold), and the slope value begins to tick upwards (the inflection point), signaling potential mean reversion.
Overbought/Sell: A 🔴 Red X is generated only when the slope ranking indicates the market is steeply positive (overbought), and the slope value begins to tick downwards, signaling momentum exhaustion.
The core philosophy is simple: Enter only when the market is exhausted and has started to turn.

Live 1H ATR(1) & ATR(5) on Lower TimeframesSynthetic 1-Hour ATR Indicator (on lower timeframe charts)
Reconstructs 1-hour candles on any lower timeframe (like 5m or 15m):
Tracks open, high, low, close for the current 1-hour period.
Updates high and low live as new lower timeframe bars arrive.
Tracks completed 1-hour True Ranges (TRs):
Stores TRs of past 1-hour bars in an array (tr_hist).
Keeps the last 50 completed hourly TRs for ATR calculation.
Computes the current (live) TR:
Calculates the TR of the in-progress 1-hour candle relative to the last completed hour’s close.
Updates on every lower timeframe bar, so ATR values reflect live volatility.
Calculates ATR(1) and ATR(5):
ATR(1) = most recent TR (current hour).
ATR(5) = average of the last 5 TRs (current + last 4 completed hours).
Plots ATR lines in a separate indicator pane:
Green line = ATR(1)
Orange line = ATR(5)
Background coloring for volatility detection:
Checks New York time using timestamp("America/New_York", ...).
Between 09:20 and 09:30 NY time, calculates ATR ratio = ATR(1)/ATR(5).
Turns the background red if ATR(1) is ≤ 65% or ≥ 165% of ATR(5).
Semi-transparent red (opacity=80) so it doesn’t block the chart.
Designed for lower timeframe charts:
Allows you to read 1-hour ATRs on a 5m chart.
Works live, updating with every lower timeframe bar.

PEG Ratio Screener ColumnCreating a column for PEG so I can easily rank stocks of interest based on whether their PEG is >1, 1, or <1.

CandelaCharts - Trend Oscillator 📝 Overview
Trend Oscillator is a simple yet effective trend identification tool that uses the relationship between two exponential moving averages (EMAs) to determine market direction. It calculates the spread between a fast and slow EMA, applies a bias multiplier, and smooths the result to produce a clean oscillator that oscillates above and below a zero line. When the oscillator is above zero, the trend is considered bullish (upward); when below zero, it's bearish (downward). The indicator provides clear visual feedback through color-coded plots and optional price bar coloring, making it easy to identify trend direction at a glance.
📦 Features
This section highlights the core capabilities you'll rely on most.
Dual EMA system — Uses a fast EMA (default 9) and slow EMA (default 21) to capture trend momentum and direction.
Bias multiplier — Applies a small multiplier (default 1.001) to the EMA spread, providing a slight bias that helps filter noise and confirm trend strength.
Smoothed output — Applies an additional EMA smoothing (default 5 periods) to the raw spread, creating a cleaner, less choppy oscillator line.
Zero-line reference — Plots a horizontal zero line that serves as the critical threshold between bullish and bearish conditions.
Color-coded visualization — Automatically colors the oscillator line green/lime when bullish (above zero) and red when bearish (below zero).
Price bar coloring — Optional feature to color price bars based on the current trend direction, providing immediate visual context on the main chart.
Customizable parameters — Adjust EMA lengths, bias multiplier, smoothing period, and colors to match your trading style and timeframe.
⚙️ Settings
Use these controls to fine-tune the oscillator's sensitivity, appearance, and behavior.
Fast EMA Length — Period for the fast exponential moving average (default: 9). Lower values make the indicator more responsive to price changes.
Slow EMA Length — Period for the slow exponential moving average (default: 21). Higher values create a smoother baseline for trend identification.
Bias Multiplier — Multiplier applied to the EMA spread (default: 1.001). Small adjustments can help filter minor whipsaws and confirm trend strength.
Smoothing Length — Period for smoothing the raw spread calculation (default: 5). Higher values create a smoother oscillator line but may lag price action.
Colors — Set the bullish (default: lime) and bearish (default: red) colors for the oscillator line.
Color Price Bars — Toggle to enable/disable coloring of price bars based on the current trend direction.
⚡️ Showcase
Oscillator Line
Bar Coloring
Divergences
📒 Usage
Follow these steps to effectively use Trend Oscillator for trend identification and trading decisions.
1) Select your timeframe — The indicator works across all timeframes, but higher timeframes (daily, weekly, monthly) typically provide more reliable trend signals with less noise. Lower timeframes (1m, 5m, 15m) may produce more frequent but potentially less reliable signals. Consider your trading style: swing traders benefit from daily/weekly charts, while day traders can use 15m/1h timeframes. Always align the indicator's sensitivity with your timeframe choice.
2) Adjust EMA lengths — The default 9/21 combination works well for most cases. For faster signals, try 5/13; for slower, more conservative signals, try 12/26 or 20/50. Match the lengths to your trading style and timeframe.
3) Interpret the zero line — When the oscillator is above zero (green/lime), the trend is bullish. When below zero (red), the trend is bearish. The further from zero, the stronger the trend.
4) Watch for crossovers — Trend changes occur when the oscillator crosses the zero line. A cross from below to above indicates a shift to bullish; from above to below indicates a shift to bearish.
5) Identify divergences — Divergences can signal potential trend reversals. Bullish divergence : price makes lower lows while the oscillator makes higher lows (suggests weakening bearish momentum). Bearish divergence : price makes higher highs while the oscillator makes lower highs (suggests weakening bullish momentum). Divergences are most reliable when they occur near extreme levels and should be confirmed with price action before taking trades.
6) Use smoothing wisely — The smoothing parameter helps reduce noise but adds lag. Lower smoothing (3-5) is more responsive; higher smoothing (7-10) is more stable but slower to react.
7) Combine with price action — Use the oscillator to confirm trend direction, then look for entry opportunities when price pulls back in the direction of the trend. The optional price bar coloring helps visualize trend alignment on the main chart.
8) Filter with bias multiplier — The bias multiplier can help reduce false signals. Experiment with values between 1.000 and 1.005 to find the sweet spot for your instrument and timeframe.
🚨 Alerts
There are no built-in alerts in this version.
⚠️ Disclaimer
Trading involves significant risk, and many participants may incur losses. The content on this site is not intended as financial advice and should not be interpreted as such. Decisions to buy, sell, hold, or trade securities, commodities, or other financial instruments carry inherent risks and are best made with guidance from qualified financial professionals. Past performance is not indicative of future results.


PRO Live ATR Engine – 1H ATR(1) & ATR(5) for Lower Timeframes✔ Accurate Live ATR(1)
Uses true range formula, not just high-low.
✔ Accurate Live ATR(5)
Rolling ATR that increases/decreases continuously as the hour forms.
✔ Works in Replay on 1m/5m
Does not rely on 1-hour candle closes.
✔ Only flags inside 09:20–09:25
No more random background outside your window.
✔ Correct “Do Not Trade” logic
If price is between midnight and 8:30, background turns red.

O'Neil Market TimingBill O'Neil Market Timing Indicator - User Guide
Overview
This Pine Script indicator implements William O'Neil's market timing methodology, which assigns one of four distinct states to a market index (such as SPY or QQQ) to help traders identify optimal market conditions for investing. The indicator is designed to work exclusively on Daily timeframe charts.
The Four Market States
The indicator tracks the market through four distinct states, with specific transition rules between them:
1. Confirmed Uptrend (Green)
- Meaning: The market is in a healthy uptrend with institutional support
- Action: Favorable conditions for building positions in leading stocks
- Can transition to: State 2 (Uptrend Under Pressure)
2. Uptrend Under Pressure (Yellow)
- Meaning: The uptrend is showing signs of weakness with increasing distribution
- Action: Be cautious, tighten stops, reduce position sizes
- Can transition to: State 1 (Confirmed Uptrend) or State 3 (Downtrend)
3. Downtrend (Red)
- Meaning: The market is in a confirmed downtrend
- Action: Stay mostly in cash, avoid new purchases
- Can transition to: State 4 (Rally Attempt)
4. Rally Attempt (Pink/Fuchsia)
- Meaning: The market is attempting to bottom and reverse
- Action: Watch for Follow-Through Day to confirm new uptrend
- Can transition to: State 1 (Confirmed Uptrend) or State 3 (Downtrend)
Key Concepts
Distribution Day
A distribution day occurs when:
1. The index closes down by more than the critical percentage (default 0.2%)
2. Volume is higher than the previous day's volume
Distribution days indicate institutional selling and are marked with red triangles on the indicator.
Follow-Through Day
A follow-through day occurs during a Rally Attempt when:
1. The index closes up by more than the critical percentage (default 1.6%)
2. Volume is higher than the previous day's volume
A Follow-Through Day confirms a new uptrend and triggers the transition from Rally Attempt to Confirmed Uptrend.
State Transition Logic
Valid Transitions
The system only allows specific transitions:
- 1 → 2: When distribution days reach the "pressure number" (default 5) within the lookback period (default 25 bars)
- 2 → 1: When distribution days drop below the pressure number
- 2 → 3: When distribution days reach "downtrend number" (default 7) AND price drops by "downtrend criterion" (default 6%) from the lookback high
- 3 → 4: When the market doesn't make a new low for 3 consecutive days
- 4 → 3: When a new low is made, undercutting the downtrend low
- 4 → 1: When a Follow-Through Day occurs during the Rally Attempt
Input Parameters
Distribution Day Parameters
- Distribution Day % Threshold (default 0.2%, range 0.1-2.0%)
- Minimum percentage decline required to qualify as a distribution day. While 0.2% seems to be the canonical number I see in literature about this, I use a much higher threshold (at least 0.5%)
Follow-Through Day Parameters
- Follow-Through Day % Threshold (default 1.6%, range 1.0-2.0%)
- Minimum percentage gain required to qualify as a follow-through day
### State Transition Parameters
- Pressure Number (default 5, range 3-6)
- Number of distribution days needed to transition from Confirmed Uptrend to Uptrend Under Pressure
- Lookback Period (default 25 bars, range 20-30)
- Number of days to count distribution days
- Downtrend Number (default 7, range 4-10)
- Number of distribution days needed (with price drop) to transition to Downtrend
- Downtrend % Drop from High (default 6%, range 5-10%)
- Percentage drop from lookback high required for downtrend confirmation
Visual Settings
- Color customization for each state
- Table position selection (Top Left, Top Right, Bottom Left, Bottom Right)
## How to Use This Indicator
### Installation
1. Open TradingView and navigate to SPY or QQQ (or another major index)
2. **Important**: Switch to the Daily (1D) timeframe
3. Click on "Indicators" at the top of the chart
4. Click "Pine Editor" at the bottom of the screen
5. Copy and paste the Pine Script code
6. Click "Add to Chart"
### Interpretation
**When the indicator shows:**
- **Green (State 1)**: Market is healthy - consider adding quality positions
- **Yellow (State 2)**: Exercise caution - tighten stops, be selective
- **Red (State 3)**: Defensive mode - preserve capital, avoid new buys
- **Pink (State 4)**: Watch closely - prepare for potential Follow-Through Day
### The Information Table
The table displays:
- **Current State**: The current market condition
- **Distribution Days**: Number of distribution days in the lookback period
- **Lookback Period**: Number of bars being analyzed
- **Rally Attempt Day**: (Only in State 4) Days into the current rally attempt
### Visual Elements
1. **State Line**: A stepped line showing the current state (1-4)
2. **Red Triangles**: Mark each distribution day
3. **Horizontal Reference Lines**: Dotted lines marking each state level
4. **Color-Coded Display**: The state line changes color based on the current market condition
## Trading Strategy Guidelines
### In Confirmed Uptrend (State 1)
- Build positions in stocks breaking out of proper bases
- Use normal position sizing
- Focus on stocks showing institutional accumulation
- Hold winners as long as they act properly
### In Uptrend Under Pressure (State 2)
- Take partial profits in extended positions
- Tighten stop losses
- Be more selective with new entries
- Reduce overall exposure
### In Downtrend (State 3)
- Move to cash or maintain very light exposure
- Avoid new purchases
- Focus on preservation of capital
- Use the time for research and watchlist building
### In Rally Attempt (State 4)
- Stay mostly in cash but prepare
- Build a watchlist of strong stocks
- On Day 4+ of the rally attempt, watch for Follow-Through Day
- If FTD occurs, begin cautiously adding positions
## Best Practices
1. **Use with Major Indices**: This indicator works best with SPY, QQQ, or other broad market indices
2. **Daily Timeframe Only**: The indicator is designed for daily bars - do not use on intraday timeframes
3. **Combine with Stock Analysis**: Use the market state as a filter for individual stock decisions
4. **Respect the Signals**: When the market enters Downtrend, reduce exposure regardless of individual stock setups
5. **Monitor Distribution Days**: Pay attention when distribution days accumulate - it's a warning sign
6. **Wait for Follow-Through**: Don't jump back in too early during Rally Attempt - wait for confirmation
## Alert Conditions
The indicator includes built-in alert conditions for:
- State changes (entering any of the four states)
- Distribution Day detection
- Follow-Through Day detection during Rally Attempt
To set up alerts:
1. Click the "Alert" button while the indicator is on your chart
2. Select "O'Neil Market Timing"
3. Choose your desired alert condition
4. Configure notification preferences
## Customization Tips
### For More Sensitive Detection
- Lower the "Pressure Number" to 3-4
- Lower the "Distribution Day % Threshold" to 0.15%
- Reduce the "Downtrend Number" to 5-6
### For More Conservative Detection
- Raise the "Pressure Number" to 6
- Raise the "Distribution Day % Threshold" to 0.3-0.5%
- Increase the "Downtrend Number" to 8-9
### For Different Market Conditions
- **Bull Market**: Consider slightly higher thresholds
- **Bear Market**: Consider slightly lower thresholds
- **Volatile Market**: May need to increase percentage thresholds
## Limitations and Considerations
1. **Not a Crystal Ball**: The indicator identifies conditions but doesn't predict the future
2. **False Signals**: Follow-Through Days can fail - use proper risk management
3. **Whipsaws Possible**: In choppy markets, the indicator may switch states frequently
4. **Confirmation Lag**: By design, there's a lag as the system waits for confirmation
5. **Works Best with Price Action**: Combine with your analysis of individual stocks
## Historical Context
This methodology is based on William J. O'Neil's decades of market research, documented in books like "How to Make Money in Stocks" and through Investor's Business Daily. O'Neil's research showed that:
- Most major market tops are preceded by accumulation of distribution days
- Most successful rallies begin with a Follow-Through Day on Day 4-7 of a rally attempt
- Identifying market state helps prevent buying during unfavorable conditions
## Troubleshooting
**Problem**: Indicator shows "Initializing"
- **Solution**: Let the chart load at least 5 bars to establish the initial state
**Problem**: No distribution day markers appear
- **Solution**: Verify you're on daily timeframe and check if volume data is available
**Problem**: Table not visible
- **Solution**: Check the table position setting and ensure it's not off-screen
**Problem**: State seems to change too frequently
- **Solution**: Increase the lookback period or adjust threshold parameters
## Support and Further Learning
For deeper understanding of this methodology:
- Read "How to Make Money in Stocks" by William J. O'Neil
- Study Investor's Business Daily's "Market Pulse"
- Review historical market tops and bottoms to see the pattern
- Practice identifying distribution days and follow-through days manually
## Version History
**Version 1.0** (November 2025)
- Initial implementation
- Four-state system with proper transitions
- Distribution day detection and marking
- Follow-through day detection
- Customizable parameters
- Information table display
- Alert conditions
---
## Quick Reference Card
| State | Number | Color | Action |
|-------|--------|-------|--------|
| Confirmed Uptrend | 1 | Green | Buy quality setups |
| Uptrend Under Pressure | 2 | Yellow | Tighten stops, be selective |
| Downtrend | 3 | Red | Cash position, no new buys |
| Rally Attempt | 4 | Pink | Watch for Follow-Through Day |
**Distribution Day**: Down > 0.2% on higher volume (red triangle)
**Follow-Through Day**: Up > 1.6% on higher volume during Rally Attempt (triggers State 4→1)
---
*Remember: This indicator is a tool to help identify market conditions. It should be used as part of a comprehensive trading strategy that includes proper risk management, position sizing, and individual stock analysis.*
Also, I created this with the help of an AI coding framework, and I didn't exhaustively test it. I don't actually use this for my own trading, so it's quite possible that it's materially wrong, and that following this will lead to poor investment decisions.. This is "copy left" software, so feel free to alter this to your own tastes, and claim authorship.

Fractional Candlestick Long Only Experimental V10Fractional Candlestick Long-Only Strategy – Technical Description
This document provides a professional English description of the "Fractional Candlestick Long Only Experimental V6" strategy using pure CF/AB fractional kernels and wavelet-based filtering.
1. Fractional Candlesticks (CF / AB)
The strategy computes two fractional representations of price using Caputo–Fabrizio (CF) and Atangana–Baleanu (AB) kernels. These provide long-memory filtering without EMA approximations. Both CF and AB versions are applied to O/H/L/C, producing fractional candlesticks and fractional Heikin-Ashi variants.
2. Trend Stack Logic
Trend confirmation is based on a 4-component stack:
- CF close > AB close
- HA_CF close > HA_AB close
- HA_CF bullish
- HA_AB bullish
The user selects how many components must align (4, 3, or any 2).
3. Wavelet Filtering
A wavelet transform (Haar, Daubechies-4, Mexican Hat) is applied to a chosen source (e.g., HA_CF close). The wavelet response is used as:
- entry filter (4 modes)
- exit filter (4 modes)
Wavelet modes: off, confirm, wavelet-only, block adverse signals.
4. Trailing System
Trailing stop uses fractional AB low × buffer, providing long-memory dynamic trailing behavior. A fractional trend channel (CF/AB lows vs HA highs) is also plotted.
5. Exit Framework
Exit options include: stack flip, CF

PEGY Ratio (Robust)
Using the PEG but incorporating Dividends in order to find value investing opportunities by better understanding growth vs. forward P/E.

PEGY Ratio (Div Adj PEG)Identifying the PEGY (Dividend Adjusted PEG) to find value investment opportunities.

2 EMA Cross Signals – AL / SATIt gives signals at EMA crossovers. It gives buy and sell signals. You can change the EMA settings. It is very good for trend following.

Positional Supertrend Strategy (1D Filter + 2H Entry)Positional Supertrend Strategy (1D Filter + 2H Entry)

Turtle 20-Day Breakout (Donchian)Yes, the most important indicator used in the Turtle Rules (Turtle Trading Strategy) for finding breakouts above previous highs is the Donchian Channel. 🐢📈
Donchian Channel
The Donchian Channel is a trend-following indicator composed of three lines plotted on the chart:
Shutterstock
Upper Band: The highest high over the defined number of periods.
Lower Band: The lowest low over the defined number of periods.
Middle Line: The average of the Upper and Lower bands (not always used, but sometimes added for orientation).
The Turtle Rules use the following periods for the entry signals (breakouts) you mentioned in your query:
Short-Term (System 1): Crossing the 20-day high (this corresponds to the upper band of a Donchian Channel with a 20-period setting).
Mid-Term/Long-Term (System 2): Crossing the 55-day high (this corresponds to the upper band of a Donchian Channel with a 55-period setting).
Crossing the upper band signals a breakout and serves as the buy signal for a long position (for short positions, crossing below the lower band is used).
Is there anything else I can translate for you, or would you like me to elaborate on the Average True Range (ATR), the other key indicator used by the Turtles?

Scalper Pro - MA's and Bias - ChartThought I would share this for anybody interested. There is a table in the upper right and you can toggle the moving averages and table on and off as well. Happy Trading!

X ATM Option Ladder Premium (1DTE Dynamic Wings)X ATM Option Ladder Premium is a specialized options-market visualization tool designed for intraday tracking of at-the-money (ATM) option premiums in index ETFs such as QQQ and SPY.The script dynamically identifies the ATM contract on every bar and plots real-time call-versus-put premium differences, with columns for positive/negative diffs and markers (blue dots for positive, red squares for negative) to represent upward price ticks in the option premiums.By analyzing premium levels and direction data from multiple strikes within a dynamic ± range (approximating 0.25 delta wings for 1DTE), the indicator produces a real-time histogram that reflects how premium skew evolves relative to the underlying price.Complementary status tables display the active strike, ladder position, IV-derived wing depth, and warnings when the underlying moves outside the monitored range.Core FeaturesDynamic ATM selection – Each bar automatically maps to the option contract closest to the underlying’s price.Bidirectional premium comparison – Visual separation of call and put premiums (optional columns), with premium diff as the primary histogram and “up” markers highlighting contracts trading above their prior close.Multi-strike ladder analysis – Samples strikes within IV-adjusted wings (±2-5 points typical for 1DTE at 15-25% IV) from the defined center to capture skew and momentum near the money; uses VIX1D for real-time IV approximation.Optimized data calls – Uses tuple requests to minimize request.security() load, enabling a wider ladder within TradingView limits.Session awareness – Restricts processing to the 9:30 AM – 4:15 PM ET option-trading window.Status dashboard – Displays date, active strike, warning flags (“⚠︎ / •outside”), wing parameters (e.g., “±3 (VIX1D=20%)”), and ladder details directly on chart.Use CaseThe indicator is intended for intraday traders and options-premium analysts who want to visualize how short-term pricing dynamics and sentiment migrate across the ATM region as the underlying moves. Typical applications include:Monitoring real-time call/put premium imbalances to detect skew shifts, put-call parity deviations, or implied vol divergences.Identifying premium clustering near the money—where theta decay or gamma effects can signal underlying price acceleration or pinning.Detecting when price exits the monitored ladder (⚠︎ / •outside), signaling a potential regime change or requiring manual recentering.Integrating premium flow into broader volatility or ETF models (e.g., VIX alignment or QQQ/SPY skew confirmation for straddle/strangle trades).Technical NotesStatic-center architecture ensures historical consistency: prior bars remain fixed even after re-centering.Ladder depth is dynamically computed for 1DTE 0.25Δ wings via VIX1D IV (fallback to fixed ±3); capped at ±5 to stay under TradingView’s security-call limits.auto_nudge is enabled to smoothly align the selected lane with the active ATM without requiring user intervention.Indicator is optimized for 1-minute to 5-minute charts; use overlay = false to preserve scale clarity. Manual 1DTE expiry input required (e.g., YYMMDD format).

Quarterly Theory ChecklistThis indicator gives you a fully customizable trading checklist directly on your chart, helping you stay consistent and avoid emotional or impulsive trades.
You can pin the checklist to one specific symbol, so it only appears when you’re analyzing the pair or asset you want to track. Each checklist item has:
A checkbox you can manually toggle
A text label you can customize
Automatic coloring (green check ✔ or red cross ✘)
The indicator also calculates a Trade Score based on how many criteria you’ve checked off.
This score updates live and is color-coded:
Green = 75–100% confidence
Yellow = 50–74%
Red = below 50%
You can choose:
The position of the table
Text size
Header text & colors
Border color
Number of visible checklist rows (1–8)
Enable or disable the Trade Score
Everything is organized inside a clean 2-column checklist table with a polished UI.
Perfect for:
→ System traders
→ Checklists (HTF bias, POIs, confirmations, timing, etc.)
→ Evaluations & trade grading
→ Staying disciplined and rule-based


Session Range Boxes GR v2.1This indicator draws intraday range boxes for the main Forex sessions based on Europe/Budapest time (CET/CEST).
Tracked sessions (Budapest time):
Asia: 01:00 – 08:00
Frankfurt (pre-London): 08:00 – 09:00
London: 09:00 – 18:00
New York: 14:30 – 23:00
For each session, the script:
Detects the session start and session end using the current chart timeframe and the Europe/Budapest time zone.
Tracks the high and low of price during the session.
Draws a colored box from session open to session close, covering the full price range between the session high and low.
Draws a white midline inside every box at the midpoint between the session high and low (and keeps it visible for all past sessions).
Optionally plots a small label (“Asia”, “Fra”, “London”, “NY”) above the first bar of each session.
Color scheme:
Asia: soft orange box
Frankfurt: light aqua box
London: darker blue box
New York: light lime box
Use this tool to:
Quickly see which session created the high or low of the day,
Highlight important liquidity zones and prior session ranges that price may revisit,
Visually separate Asia, Frankfurt, London and New York volatility profiles on intraday charts.
Optimized for intraday trading (Forex / indices), but it works on any symbol where session behavior and time-of-day structure matter.

Absorption — Bullish or BearishAbsorption — Bullish or Bearish Only is a lightweight and minimalistic tool designed to identify pure absorption events in the market.
It highlights only two conditions:
Bullish Absorption
• Volume spike
• Small candle body
• Positive delta behavior (close > open)
→ Indicates potential buy-side absorption at lows
Bearish Absorption
• Volume spike
• Small candle body
• Negative delta behavior (close < open)
→ Indicates potential sell-side absorption at highs
This script intentionally keeps the chart clean by marking only “Bullish” or “Bearish” labels, without any additional visuals, colors, or extra signals.
Ideal for traders who want a simple, non-disruptive absorption confirmation tool.
