BulletProof Long Wick Reversal Markers with LinesThis custom Pine Script indicator for TradingView identifies and marks potential reversal points on your chart based on long wick candles at swing highs (tops) and lows (bottoms). It focuses on candles where the wick is significantly longer than the body (e.g., shooting stars or hammers) and where the subsequent price reversal exceeds a minimum percentage move. Markers appear as colored circles (green for tops, red for bottoms), with horizontal lines extending from each marker to the current bar for easy reference as support/resistance levels.Key Features and InterpretationMarkers (Dots): Green circles at tops: Indicate a potential bearish reversal where price was pushed down after a long upper wick candle.
Red circles at bottoms: Indicate a potential bullish reversal where price was pushed up after a long lower wick candle.
These only appear if the wick-to-body ratio meets the threshold (default 2.0) and the reversal move is at least the minimum percentage (default 1%).
Lines: Horizontal lines extend from each marker to the current bar (updating in real-time). Use these as dynamic levels—e.g., a green top line might act as resistance, while a red bottom line could be support. Lines do not extend into the future blank space on the chart.
Time Filtering: By default, only markers from the last 7 days are shown to reduce clutter. Set to 0 to display all historical ones.
Best Used On: 1-hour charts as per your request, but it works on any timeframe. It's ideal for spotting reversals in trending markets or confirming entries/exits with other indicators.
Wskaźniki i strategie

High/Low ARDR-ADR-WDRR-DDR V1Tracks the high and Low in 4 different tIme Frames
ARDR-ADR-WDRR-DDR
-You can set your own time frames
-Display lines or boxes
-Each line can have its own label
-Set own colors and linestyles
-Each box can also have their own lines at 75%, 50% and 25% of the box if that's needed
-Toggle wich session to display
-Toggle to auto extend untill Extended time
-Toggle to live update lines/boxes during live priceaction or to display the lines / boxes after the End Time
DDR lines have no history, so after 15:55 the DDR lines disappear and gets drawn again the next day starting at 04:00.
Happy Trading!!


Advanced Multi-Level S/R ZonesAdvanced Multi-Level S/R Zones: The Comprehensive Guide
1. Introduction: The Evolution of Support & Resistance:
Support and Resistance (S/R) is the backbone of technical analysis. However, traditional methods of drawing these levels are often plagued by subjectivity. Two traders looking at the same chart will often draw two different lines. Furthermore, standard indicators often treat every price point equally, ignoring the critical context of Volume and Time.
The Advanced Multi-Level S/R Zones script represents a paradigm shift. It moves away from subjective line drawing and toward Quantitative Zoning. By utilizing statistical measures of variability (Standard Deviation, MAD, IQR) combined with Volume-Weighting and Time-Decay algorithms, this tool identifies where price is mathematically most likely to react. It treats S/R not as thin lines, but as dynamic zones of probability.
2. Core Logic and Mathematical Foundation:
To understand how to use this tool optimally, one must understand the "engine" under the hood. The script operates on four distinct pillars of logic:
A. Session-Based Data Collection:
The script does not look at every single tick. Instead, it aggregates data into "Sessions" (daily bars by default logic). It extracts the High, Low, and Total Volume for every session within the user-defined lookback period. This filters out intraday noise and focuses on the macro structure of the market.
B. Adaptive Statistical Variability:
Most Bollinger Band-style indicators use Standard Deviation (StdDev) to measure width. However, StdDev is heavily influenced by outliers (extreme wicks). This script offers a sophisticated Adaptive Method-Skewness Detection: The script calculates the skewness of the price distribution. Adaptive Selection: If the data is highly skewed (lots of outliers, typical in Crypto), it switches to MAD (Median Absolute Deviation). MAD is robust and ignores outliers. If the data is moderately skewed, it uses IQR (Interquartile Range). If the data is normal (Gaussian), it uses StdDev.
Benefit: This ensures the zone widths are accurate regardless of whether you are trading a stable Forex pair or a volatile Altcoin.
C. The Weighting Engine (Volume + Time)
Not all price history is equal. This script assigns a "Weight Score" to every session based on two factors:
Volume Weighting: Sessions with massive volume (institutional activity) are given higher importance. A high formed on low volume is less significant than a high formed on peak volume.
Time Decay: Recent price action is more relevant than price action from 50 bars ago. The script applies a decay factor (default 0.85). This means a session from yesterday has 100% impact, while a session from 10 days ago has significantly less influence on the zone calculation.
D. Clustering Algorithm
Once the data is weighted, the script runs a clustering algorithm. It looks for price levels where multiple session Highs (for Resistance) or Lows (for Support) congregate.
It requires a minimum number of points to form a zone (User Input: minPoints).
It merges nearby levels based on the Cluster Separation Factor.
This results in "Primary," "Secondary," and "Tertiary" zones based on the strength and quantity of data points in that cluster.
3. Detailed Features and Inputs Breakdown:
Group 1: Main Settings
Lookback Sessions (Default: 10): Defines how far back the script looks for pivots. A higher number (e.g., 50) creates long-term structural zones. A lower number (e.g., 5) creates short-term scalping zones.
Variability Method (Adaptive): As described above, leave this on "Adaptive" for the best results across different assets.
Zone Width Multiplier (Default: 0.75): Controls the vertical thickness of the zones. Increase this to 1.0 or 1.5 for highly volatile assets to ensure you catch the wicks.
Minimum Points per Zone: The strictness filter. If set to 3, a price level must be hit 3 times within the lookback to generate a zone. Higher numbers = fewer, but stronger zones.
Group 2: Weighting
Volume-Weighted Zones: Crucial for identifying "Smart Money" levels. Keep this TRUE.
Time Decay: Ensures the zones update dynamically. If price moves away from a level for a long time, the zone will fade in significance.
ATR-Normalized Zone Width: This is a dynamic volatility filter. If TRUE, the zone width expands and contracts based on the Average True Range. This is vital for maintaining accuracy during market breakouts or crashes.
Group 3: Zone Strength & Scoring
The script calculates a "Score" (0-100%) for every zone based on:
-Point Count: More hits = higher score.
-Touches: How many times price wicked into the zone recently.
-Intact Status: Has the zone been broken?
-Weight: Volume/Time weight of the constituent points.
-Track Zone Touches: Looks back n bars to see how often price respected this level.
-Touch Threshold: The sensitivity for counting a "touch."
Group 4: Visuals & Display
Extend Bars: How far to the right the boxes are drawn.
Show Labels: Displays the Score, Tier (Primary/Secondary), and Status (Retesting).
Detect Pivot Zones (Overlap): This is a killer feature. It detects where a Support Zone overlaps with a Resistance Zone.
Significance: These are "Flip Zones" (Old Resistance becomes New Support). They are colored differently (Orange by default) and represent high-probability entry areas.
Group 5: Signals & Alerts
Entry Signals: Plots Buy/Sell labels when price rejects a zone.
Detect Break & Retest: specifically looks for the "Break -> Pullback -> Bounce" pattern, labeled as "RETEST BUY/SELL".
Proximity Alert: Triggers when price gets within x% of a zone.
4. Understanding the Visuals (Interpreting the Chart)
When you load the script, you will see several visual elements. Here is how to read them:
The Boxes (Zones)
Red Shades: Resistance Zones.
Dark Red (Solid Border): Primary Resistance. The strongest wall.
Lighter Red (Dashed Border): Secondary/Tertiary. Weaker, but still relevant.
Green Shades: Support Zones.
Dark Green (Solid Border): Primary Support. The strongest floor.
Orange Boxes: Pivot Zones. These are areas where price has historically reacted as both support and resistance. These are the "Line in the Sand" for trend direction.
The Labels & Emojis
The script assigns emojis to zone strength:
🔥 (Fire): Score > 80%. A massive level. Expect a strong reaction.
⭐ (Star): Score > 60%. A solid structural level.
✓ (Check): Score > 40%. A standard level.
"⟳ RETESTING": Appears when a zone was broken, and price is currently pulling back to test it from the other side.
The Dashboard (Top Right)
A statistics table provides a "Head-Up Display" for the asset:
High/Low σ (Sigma): The variability of the highs and lows. If High σ is much larger than Low σ, it implies the tops are erratic (wicks) while bottoms are clean (flat).
Method: Shows which statistical method the Adaptive engine selected (e.g., "MAD (auto)").
ATR: Current volatility value used for normalization.
5. Strategies for Optimum Output
To get the most out of this script, you should not just blindly follow the lines. Use these specific strategies:
Strategy A: The "Zone Fade" (Range Trading)
This works best in sideways markets.
Identify a Primary Support (Green) and Primary Resistance (Red).
Wait for price to enter the zone.
Look for the "SUPPORT BOUNCE" or "RESISTANCE REJECTION" signal label.
Entry: Enter against the zone (Buy at support, Sell at resistance).
Stop Loss: Place just outside the zone width. Because the zones are calculated using volatility stats, a break of the zone usually means the trade is invalid.
Strategy B: The "Pivot Flip" (Trend Following)
This is the highest probability setup in trending markets.
Look for an Orange Pivot Zone.
Wait for price to break through a Resistance Zone cleanly.
Wait for the price to return to that zone (which may now turn Orange or act as Support).
Look for the "RETEST BUY" label.
Logic: Old resistance becoming new support is a classic sign of trend continuation. The script automates the detection of this exact geometric phenomenon.
Strategy C: The Volatility Squeeze
Look at the Dashboard. Compare High σ and Low σ.
If the values are dropping rapidly or becoming very small, the zones will contract (become narrow).
Narrow zones indicate a "Squeeze" or compression in price.
Prepare for a violent breakout. Do not fade (trade against) narrow zones; look to trade the breakout.
6. Optimization & Customization Guide
Different markets require different settings. Here is how to tune the script:
For Crypto & Volatile Stocks (Tesla, Nvidia)
Method: Set to Adaptive (Mandatory, as these assets have "Fat Tails").
Multiplier: Increase to 1.0 - 1.25. Crypto wicks are deep; you need wider zones to avoid getting stopped out prematurely.
Lookback: 20-30 sessions. Crypto has a long memory; short lookbacks generate too much noise.
For Forex (EURUSD, GBPJPY)
Method: You can force StdDev or IQR. Forex is more mean-reverting and Gaussian.
Multiplier: Decrease to 0.5 - 0.75. Forex levels are often very precise to the pip.
Volume Weighting: You may turn this OFF for Forex if your broker's volume data is unreliable (since Forex has no centralized volume), though tick volume often works fine.
For Scalping (1m - 15m Timeframes)
Lookback: Decrease to 5-10. You only care about the immediate session history.
Decay Factor: Decrease to 0.5. You want the script to forget about yesterday's price action very quickly.
Touch Lookback: Decrease to 20 bars.
For Swing Trading (4H - Daily Timeframes)
Lookback: Increase to 50.
Decay Factor: Increase to 0.95. Structural levels from weeks ago are still highly relevant.
Min Points: Increase to 3 or 4. Only show levels that have been tested multiple times.
7. Advantages Over Standard Tools:
Feature Standard S/R Indicator, Advanced Multi-Level S/R Calculation, Uses simple Pivots or Fractals, Uses Statistical Distributions (MAD/IQR). Zone Width Arbitrary or Fixed Adaptive based on Volatility & ATR.
Context Ignores Volume Volume Weighted (Smart Money tracking).
Time Relevance Old levels = New levels Time Decay (Recency bias applied).
Overlaps Usually ignores overlaps Detects Pivot Zones (Res/Sup Flip).
Scoring None 0-100% Strength Score per zone.
8. Conclusion:
The Advanced Multi-Level S/R Zones script is not just a drawing tool; it is a statistical analysis engine. By accounting for the skewness of data, the volume behind the moves, and the decay of time, it provides a strictly objective roadmap of the market structure.
For the optimum output, combine the Pivot Zone identification with the Retest Signals. This aligns you with the underlying flow of order blocks and prevents trading against the statistical probabilities of the market.

Box Theory [Interactive Zones] PyraTimeThis script combines Nicholas Darvas’s "Box Theory" with modern Supply and Demand (Premium/Discount) concepts. It automatically identifies the most recent Swing High and Swing Low to delineate the current trading range.
The purpose of this tool is to visualize market structure and help traders identify when price is relatively expensive (Premium) or cheap (Discount) within a defined range.
Visual Guide: What You Are Seeing
The Box: Represents the active trading range defined by the most recent significant Swing High and Swing Low.
Red Zone (Premium): The top 25% of the range. Mathematically, prices here are considered "expensive" relative to the current structure.
Green Zone (Discount): The bottom 25% of the range. Prices here are considered "cheap" relative to the current structure.
Grey Zone (Equilibrium): The middle 50% of the range. This is the area of fair value where price often consolidates.
Dashed Line (EQ): The exact 50% midpoint of the range.
Tutorial: How to Trade Using This Indicator
Method 1: Mean Reversion (Range Trading) This method applies when the market is moving sideways.
Identify Structure: Wait for a box to form.
Wait for Extremes: Do not trade when price is in the middle (Grey/White area). Wait for price to enter the Red or Green zones.
Entry Trigger:
Shorts: When price enters the Red Zone, look for a rejection (wicks leaving the zone) or a lower timeframe breakdown. Target the EQ (Midline) as your first take profit.
Longs: When price enters the Green Zone, look for support formation. Target the EQ (Midline) as your first take profit.
Method 2: Trend Continuation (Breakouts) This method applies when the market is trending strongly.
Breakout: Monitor the alerts. A close outside the box indicates a potential shift in market structure.
Retest: After a breakout up, the old "Red Zone" (Resistance) often flips to become new Support. Wait for price to pull back to the top of the old box before entering.
Configuration Guide (Settings)
Pivot Left/Right Bars (Sensitivity):
Default (20/20): Best for Swing Trading. It filters out market noise and only draws boxes based on major structural points.
Lower (5/5): Best for Scalping. It will create smaller, more frequent boxes but increases the risk of false signals.
Zone Percentage:
Default (25%): Standard deviation for Supply/Demand zones.
Alternative (15%): Use this for "sniping" entries at the absolute extremes of the range.
Multi-Timeframe (MTF):
Enable "Use Higher Timeframe" to see Daily or Weekly ranges while trading on lower timeframes (like the 15m or 1H). This helps keep your intraday trades aligned with the major trend.
Technical Note on "Lag" This indicator uses Pivots to draw the box. A pivot is only confirmed after a certain number of bars have passed (the "Pivot Right Bars" setting).
Example: If "Pivot Right Bars" is set to 20, the box will update 20 bars after the actual high or low occurred. This is necessary to confirm that the point was indeed a Swing High/Low. Do not treat the box lines as predictive; they are reactive to confirmed structure.

PyraTime FVG [Pro] | Smart Anchored Price ActionPyraTime FVG is a professional-grade institutional trading suite designed to declutter price action analysis. Unlike standard indicators that flood the chart with infinite zones, this tool uses a proprietary "Velcro" Anchoring Engine that physically snaps Fair Value Gaps (FVGs) and Order Blocks to the exact candle geometry.
This tool replaces 4 separate indicators (FVG, Market Structure, Order Blocks, and Trend Dashboard) with a single, performance-optimized Pine Script v6 script.
🎯 Key Features
1. The "Velcro" FVG Engine Most FVG indicators draw boxes that extend infinitely, making charts messy.
Smart Extension: Zones extend to the right but automatically "snap" and cut off the moment price mitigates (fills) them.
Precision Anchoring: Boxes are drawn from the exact wick/body limits of the originating candles—no floating pixels.
Mitigation Tracking: Mitigated zones are instantly dimmed and archived, keeping your chart clean for current price action.
2. Intelligent Structure Mapping (BOS & CHoCH) The script distinguishes between trend continuation and trend reversals:
BOS (Break of Structure): Marked with Dotted Lines. Signals that the current trend is healthy and continuing.
CHoCH (Change of Character): Marked with Solid Lines. Signals a potential major trend reversal (e.g., the first Lower Low after an uptrend).
3. Multi-Timeframe (MTF) Scanner A non-intrusive dashboard in the bottom-right corner scans the 1H, 4H, and Daily timeframes in real-time.
IN BULL GAP: Price is currently inside a Higher Timeframe Buying Zone.
IN BEAR GAP: Price is currently inside a Higher Timeframe Selling Zone.
CLEAR: No major HTF obstacles nearby.
📚 How to Trade With This Tool (Tutorial)
Step 1: Check the "Big Picture" Look at the MTF Scanner (Bottom Right).
If the 1H and 4H say "IN BEAR GAP" (Gold), you know the higher timeframe bias is Down. You should prioritize selling opportunities.
Step 2: Wait for Price to Visit a Zone On your current chart (e.g., 5m or 15m), wait for price to enter a Gold FVG (Resistance).
Note: The box will be bright gold. Once price touches it, the script will snap the box to that candle, confirming the test.
Step 3: Confirm with Structure Don't sell blindly. Wait for a CHoCH Label (Change of Character) to appear. This confirms that the short-term uptrend has broken and sellers are stepping in.
Step 4: Target the Opposing Zone Aim for the next unmitigated Teal FVG (Bullish Support) or Order Block below.
⚙️ Settings & Customization
Filter Small Gaps: Uses an ATR filter (default 0.5) to ignore insignificant noise. Increase to 1.0 for a cleaner "Swings Only" view.
Show Midpoint: Toggles a dotted 50% equilibrium line inside every active gap.
Visual Style: Fully customizable colors. Default scheme is PyraTime Desert Gold & Oasis Teal.

Price Range CHoCH Alert🎯 Smart Money Concept (SMC) indicator that monitors a specific price level and alerts only when price touches that level AND
subsequently creates a Change of Character (CHoCH).
Key Features:
• Set a custom price level to monitor
• Detects CHoCH/BOS based on pivot highs/lows
• Alerts ONLY when: Price touches level → CHoCH occurs
• Visual confirmation with level line and status table
• Configurable tolerance for precise level targeting
• Works for both bullish and bearish scenarios
Perfect for:
✓ Institutional level trading
✓ Key support/resistance breakouts
✓ Liquidity grab confirmations
✓ Structure break validation
Simply set your target price level and let the indicator watch for the perfect SMC setup!

Strat Structure Engine + Trapped TradersStrat Structure Engine + Trapped Traders – Detailed Description
This script identifies high-probability market structure patterns known as “The Strat” setups, specifically focusing on 3-bar → Failed 2, 2-bar → Failed 2, and Failed 2 → Failed 2 (“Dragon’s Tail”) sequences. It is designed to help traders visualize potential reversals, trapped traders, and exhaustion points directly on the chart, combining price action, volatility, and volume metrics to grade signal strength.
Key Features:
3-Bar → Failed 2 (Tiered Scoring):
Detects a 3-bar structure followed immediately by a strict Failed 2 bar.
Evaluates the setup using four criteria:
3-bar range relative to ATR
Failed 2 close position relative to the 3-bar midpoint
Failed 2 body-to-range ratio
Volume relative to recent average
Assigns a tier (A+, A, B, or —) to indicate reliability, giving traders a graded view of signal strength.
2-Bar → Failed 2 (A+ Only):
Identifies strict 2-bar structures immediately followed by a Failed 2 bar.
Uses a similar evaluation system as 3→F2 but filters only for the strongest A+ setups.
Highlights signals where price shows strong directional rejection and high probability for reversal.
Dragon’s Tail – Failed 2 → Failed 2:
Captures consecutive Failed 2 bars in opposite directions, a classic trapped-trader scenario.
Signals both bullish and bearish sequences on bar close, helping traders spot potential quick reversals.
How It Works:
Uses ATR to contextualize bar ranges and volatility.
Incorporates volume averaging to detect unusually high trading activity that validates the strength of a Failed 2 setup.
Strict bar evaluation ensures only fully-formed, confirmed patterns are labeled, reducing noise and false signals.
Optional labels and alerts allow traders to track these structures in real-time or on bar close.
Practical Trading Use:
Ideal for spotting short-term exhaustion points, trapped traders, and reversal zones.
Can be used alongside liquidity zones, VWAP, and fair value gaps to refine entries and exits.
Traders can focus on high-tier signals (A+ / A) for higher probability trades, while lower-tier signals (B) indicate caution or context setups.
Customization Options:
Toggle visibility for each pattern type (3→F2, 2→F2, F2→F2).
Adjust ATR length and volume average period for different instruments or timeframes.
Alerts are available for all major setups, enabling integration with automated monitoring or manual execution strategies.
Summary:
The Strat Structure Engine + Trapped Traders script combines price action structure, volatility, and volume analysis to visualize high-probability reversal setups. By highlighting both strict pattern confirmations and tiered reliability, it provides traders with actionable insight into potential turning points, trapped trader scenarios, and high-conviction market moves without relying on external scripts or assumptions.

CCI Standard DeviationCCI Standard Deviation – Asymmetric Volatility-Adjusted Trend Filter (CCI SD)
The Commodity Channel Index (CCI), created by Donald Lambert in 1980, measures how far the typical price deviates from its statistical average to identify cyclical momentum and trend strength.
The standard formula is:
CCI = (Typical Price − SMA(Typical Price, n)) / (0.015 × Mean Deviation)
where Typical Price = (High + Low + Close)/3.
CCI is unbounded and centered around zero: sustained readings above zero indicate bullish momentum, below zero bearish. Classic interpretations often use zero-line crosses or fixed levels (±100, ±200, ±250), but these can be unreliable when CCI volatility changes across market regimes.
This indicator was developed to create a more disciplined trend-following tool that aligns with my core risk principle: “always protect to the downside.”
Starting from the standard CCI zero-line concept for trend direction, I experimented with standard deviation bands to make the oscillator volatility-adjusted. I then applied deliberate asymmetry: requiring the lower 1σ envelope (CCI − stdev) to cross above a positive threshold for bullish confirmation (high-probability entry only in robust trends), while exiting immediately on any raw CCI weakness below a negative threshold (quick downside protection). User inputs for both thresholds were added to allow fine-tuning and adaptability across different assets and timeframes.
An optional DEMA-smoothed version of the lower envelope provides additional clarity when desired.
Extreme zones
raw CCI ±240 and lower envelope > 200 or < –200 - are highlighted with background shading to flag rare acceleration or capitulation phases.
How it works
Standard CCI calculated on typical price (default length 38).
Rolling standard deviation of the CCI itself (default length 13) measures the oscillator’s recent volatility.
Lower envelope = CCI − stdev (dn).
Optional DEMA smoothing (default length 12) can be toggled.
Trend logic:
Bullish regime only when lower envelope
→ Long Threshold (default +10)
→ statistical proof of strength
Bearish/neutral immediately when raw CCI
→ Short Threshold (default –25)
→ fast downside protection
Origin and development
The indicator emerged from wanting a cleaner, more reliable CCI for trend direction. After testing volatility-adjusted versions, the asymmetric design proved superior:
it enters only high-conviction uptrends and exits rapidly on weakness, significantly reducing whipsaws while preserving trend capture.
Parameters were optimized through extensive backtests on major assets (BTC, ETH, SOL and many more Cryptos; Magnificent 7 stocks, QQQ, SPX, gold).
The defaults were selected for the best average Sortino ratio and lowest maximum drawdown across this broad universe, ensuring robustness and avoiding single-asset overfitting.
How to use it
Green triangle below bar
→ lower envelope crosses above Long Threshold
→ high-conviction bullish trend confirmed
→ enter or add to longs
Magenta triangle above bar
→ CCI crosses below Short Threshold
→ exit longs or go cash/short
While lower envelope remains above Long Threshold
→ hold bullish positions
Extreme background shading (dn >200 or CCI ±240)
→ rare high-attention zones (potential acceleration or exhaustion)
Recommended defaults
CCI length: 38
SD length: 13
Long threshold: +10
Short threshold: –25
Optional MA length: 12 (DEMA of lower envelope)
All visual elements (bar coloring, signals, background, smoothed line) are toggleable for personal preference.
This indicator is designed as a trend-strength and risk-management filter and is not intended as a standalone trading system.
Disclaimer:
This is not financial advice. Backtests are based on past results and are not indicative of future performance.

SignalViper Recon LiteSignalViper Recon Lite — Confluence-Based Market State Summary
Recon Lite is a streamlined market analysis tool that evaluates momentum and trend conditions to identify alignment between key analytical factors. It provides a real-time dashboard summarizing market state, helping traders quickly assess whether conditions favor directional moves or suggest caution.
Core Concepts & Logic
Recon Lite evaluates two primary analytical dimensions:
Momentum Analysis (RSI-Based)
- Evaluates price momentum strength and direction
- Identifies acceleration, deceleration, and reversal potential
- Detects overbought/oversold extremes
Trend Analysis (ADX/DMI-Based)
- Measures trend strength regardless of direction
- Determines whether bulls or bears control directional movement
- Identifies weak, ranging, or strong trending conditions
When both dimensions align in the same direction, Recon Lite identifies confluence — a state where momentum and trend agree, historically associated with higher-probability directional moves.
Narrative Interpretation Layer
Rather than displaying raw indicator values, Recon Lite translates conditions into contextual descriptions:
- "RISING - Accelerating" — Momentum gaining strength
- "BEARISH - but weakening" — Trend losing steam
- "OVERBOUGHT" / "OVERSOLD" — Extreme conditions detected
- "Trend losing steam" — Warning of potential reversal
Signal Tracking & Target Awareness
When confluence is detected, Recon Lite can track the signal with ATR-based target levels:
- Stop Loss — Risk-defined exit level
- TP1 / TP2 — Reward targets at configurable R:R ratios
The dashboard displays real-time proximity to these levels, including warnings when approaching key thresholds.
Visual Outputs
Summary Dashboard
- Momentum state with directional context
- Trend state with strength assessment
- Active warnings when conditions conflict
- Confluence or tracking status
- Target proximity and outcome tracking
Chart Signals
- Visual markers when full confluence is detected
- Optional TP/SL level lines
How to Use Recon Lite
Recon Lite serves as a market context tool. Traders commonly use it to:
- Identify when momentum and trend align
- Understand current market state at a glance
- Track signal outcomes with defined risk levels
- Avoid entries during conflicting or weak conditions
About the Full SignalViper Suite
Recon Lite demonstrates the confluence-based approach used across the SignalViper indicator suite. The full Recon indicator evaluates seven proprietary analytical dimensions — including volume participation, structural proximity, divergence detection, and multi-timeframe alignment — for comprehensive market state analysis.
This free indicator represents only the most basic example of our patent-pending Recon technology. Experience the full power of multi-factor confluence analysis with the complete SignalViper suite.
Learn more at signalviper.com

CVD Table + Alerts📌 Overview
CVD Table + Alerts is a pure order-flow indicator designed to track real buying and selling pressure using Cumulative Volume Delta (CVD).
It highlights momentum shifts and institutional participation through precise, non-repainting alerts, without cluttering your chart with unnecessary visuals.
This indicator does not predict price — it reveals what large participants are actually doing.
🔍 What This Indicator Does
1️⃣ Cumulative Volume Delta (CVD)
Calculates CVD by separating volume into:
Buying volume (close ≥ open)
Selling volume (close < open)
Accumulates this data to show net demand vs supply over time.
This allows traders to see:
Whether moves are sponsored or weak
If price is rising on real buying or just drifting
2️⃣ CVD Flip Detection (Momentum Shift)
The indicator detects when:
CVD changes direction from the previous candle
This represents:
Shift from buyers → sellers
OR sellers → buyers
👉 Acts as an early warning signal before visible price structure changes like ChoCH or BOS.
3️⃣ CVD Burst Detection (Institutional Activity)
A CVD Burst alert triggers when:
The current CVD delta is abnormally large compared to recent averages
This typically signals:
Aggressive market orders
Institutional participation
Potential trend ignition
🔔 Alerts (Exact & Reliable)
This indicator generates only two alert types:
🔹 CVD Flip Alert
Triggered when order-flow direction changes.
CVD Flip! CVD: | Δ: | Direction: ↑ / ↓
🔹 CVD Burst Alert
Triggered when sudden volume imbalance appears.
CVD Burst! CVD: | Δ: | Direction: ↑ / ↓
Alert Behavior
✅ Fires only on candle close
✅ No repainting
✅ No historical spam
✅ One alert per bar maximum
📊 CVD Table (At-a-Glance Insight)
The built-in table shows:
Recent volume
CVD values
Delta direction (↑ / ↓)
Percentage change
Highlights major bull/bear deltas
This gives traders instant context without switching indicators.
🎯 How Traders Benefit
This indicator is best used as a confirmation and context tool, not a standalone strategy.
Ideal Use Cases:
Confirm ChoCH / BOS
Validate EMA-based trend direction
Filter false breakouts at S/R, Gann, Fib, VWAP
Identify trend days vs range days
Spot divergence between price and participation
Best Paired With:
EMA / trend filters
Market structure (ChoCH, BOS)
Support & Resistance
ATR / volatility analysis
⚠️ Important Notes
This is not a buy/sell signal generator
Designed for discretionary traders
Works best in liquid markets (indices, large caps, crypto majors)
🧠 Trading Philosophy
Price shows where it moved.
CVD shows who moved it.
This indicator helps you trade with participation, not hope.

RSI Swing + VWAP + EMA + Camarilla + PDH/PDL+CPRThis script provide the follwing -
1. Daily CPR level
2. Camarilla S3/R3
3. Previous Day High/Low (PDH/PDL)
4. Dynamic VWAP
5. Dynamic EMA 20/200
6. Dynamic RSi Swing
Dec 10
Release Notes
This script provide the follwing -
1. Daily CPR level
2. Camarilla S3/R3
3. Previous Day High/Low (PDH/PDL)
4. Dynamic VWAP
5. Dynamic EMA 20/200/36
6. Dynamic RSi Swing
Which is better: 36 EMA or 36 SMA for Support/Resistance?
✔ 36 EMA (Exponential Moving Average)
Better for intraday, short-term trading, scalping, and momentum trading.
Why?
Reacts faster to price.
Captures trend shifts early.
Works great when market is trending or volatile.
Most traders use EMA for dynamic support/resistance → works better because of crowd behavior.
Ideal for:
NIFTY, BANKNIFTY, FINNIFTY intraday | Options entries | Trend continuation trades.
Why 20 EMA is Important
The 20 EMA is one of the most widely used moving averages for intraday, swing, and positional trading because it captures short-term trend strength and momentum.
📌 20 EMA Works Best For
✔ Intraday trend identification
✔ Momentum continuation entries
✔ Dynamic support/resistance
✔ Quick reversal detection
✔ Options trading (NIFTY/BNF)
✔ Breakout & pullback trades
EMA 200 – Why It’s Extremely Important
The 200 EMA represents the long-term trend and is respected by:
Institutions
Algo systems
Big traders
Swing traders
Index traders
It acts like a major wall of support or resistance.
💡 What EMA 200 Tells You
✔ Long-term trend direction
Price above 200 EMA → Long-term uptrend
Price below 200 EMA → Long-term downtrend
✔ Strong trend reversal signals
When price crosses the 200 EMA on 15m/1h/1D charts → a deeper trend change is possible.
✔ Institutional support/resistance
Very powerful bounce/rejection zones
Many markets reverse exactly at 200 EMA
What is Previous Day High (PDH)?
The highest price the market reached in the previous trading session.
Why PDH is Important?
Acts as strong resistance
Breakout level for uptrend
Sellers often defend this zone
If broken with volume → strong bullish momentum
🔴 What is Previous Day Low (PDL)?
The lowest price the market reached in the previous trading session.
Why PDL is Important?
Acts as strong support
Breakdown level for downtrend
Buyers defend this level
If broken with volume → strong bearish trend
📌 How PDH/PDL Help in Intraday Trading
1️⃣ Range Breakout Trades
If price breaks PDH → bullish breakout (Buy CE)
If price breaks PDL → bearish breakdown (Buy PE)
What is Camarilla R3?
R3 = Resistance Level 3 in the Camarilla Pivot system.
Why R3 is important?
Acts as a major intraday resistance
Price often reverses from R3
If broken with force → strong uptrend starts
Many traders use R3 as a decision zone
Typical Market Behavior at R3
Rejection from R3 → Sell/PE opportunity
Break + Retest above R3 → CE opportunity
🔴 What is Camarilla S3?
S3 = Support Level 3 in the Camarilla Pivot system.
Why S3 is important?
Acts as a major intraday support
Buyers defend this zone
Breakdown of S3 → strong fall
S3 is often a bounce zone in the morning
Typical Market Behavior at S3
Bounce from S3 → Buy/CE opportunity
Break + Retest below S3 → PE opportunity
📌 Trader Logic: R3 & S3 Zones
⭐ 1. Range Reversal Strategy (Most Popular)
At R3 → Sell/PE
At S3 → Buy/CE
What is VWAP?
VWAP = Volume Weighted Average Price
It shows the average price at which most trading has happened during the day, based on both price and volume.
It resets every day at market open.
🔥 Why VWAP Is So Powerful?
VWAP is used by:
Institutions
Algo traders
Scalpers
Intraday traders
Dec 10
Release Notes
This script provide the follwing -
1. Daily CPR level
2. Camarilla S3/R3
3. Previous Day High/Low (PDH/PDL)
4. Dynamic VWAP
5. Dynamic EMA 20/200
6. Dynamic RSi Swing
3 hours ago
Release Notes
This script provide the follwing -
1. Daily CPR level
2. Camarilla S3/R3
3. Previous Day High/Low (PDH/PDL)
4. Dynamic VWAP
5. Dynamic EMA 20/200/36
6. Dynamic RSi Swing
Which is better: 36 EMA or 36 SMA for Support/Resistance?
✔ 36 EMA (Exponential Moving Average)
Better for intraday, short-term trading, scalping, and momentum trading.
Why?
Reacts faster to price.
Captures trend shifts early.
Works great when market is trending or volatile.
Most traders use EMA for dynamic support/resistance → works better because of crowd behavior.
Ideal for:
NIFTY, BANKNIFTY, FINNIFTY intraday | Options entries | Trend continuation trades.
Why 20 EMA is Important
The 20 EMA is one of the most widely used moving averages for intraday, swing, and positional trading because it captures short-term trend strength and momentum.
📌 20 EMA Works Best For
✔ Intraday trend identification
✔ Momentum continuation entries
✔ Dynamic support/resistance
✔ Quick reversal detection
✔ Options trading (NIFTY/BNF)
✔ Breakout & pullback trades
EMA 200 – Why It’s Extremely Important
The 200 EMA represents the long-term trend and is respected by:
Institutions
Algo systems
Big traders
Swing traders
Index traders
It acts like a major wall of support or resistance.
💡 What EMA 200 Tells You
✔ Long-term trend direction
Price above 200 EMA → Long-term uptrend
Price below 200 EMA → Long-term downtrend
✔ Strong trend reversal signals
When price crosses the 200 EMA on 15m/1h/1D charts → a deeper trend change is possible.
✔ Institutional support/resistance
Very powerful bounce/rejection zones
Many markets reverse exactly at 200 EMA
What is Previous Day High (PDH)?
The highest price the market reached in the previous trading session.
Why PDH is Important?
Acts as strong resistance
Breakout level for uptrend
Sellers often defend this zone
If broken with volume → strong bullish momentum
🔴 What is Previous Day Low (PDL)?
The lowest price the market reached in the previous trading session.
Why PDL is Important?
Acts as strong support
Breakdown level for downtrend
Buyers defend this level
If broken with volume → strong bearish trend
📌 How PDH/PDL Help in Intraday Trading
1️⃣ Range Breakout Trades
If price breaks PDH → bullish breakout (Buy CE)
If price breaks PDL → bearish breakdown (Buy PE)
What is Camarilla R3?
R3 = Resistance Level 3 in the Camarilla Pivot system.
Why R3 is important?
Acts as a major intraday resistance
Price often reverses from R3
If broken with force → strong uptrend starts
Many traders use R3 as a decision zone
Typical Market Behavior at R3
Rejection from R3 → Sell/PE opportunity
Break + Retest above R3 → CE opportunity
🔴 What is Camarilla S3?
S3 = Support Level 3 in the Camarilla Pivot system.
Why S3 is important?
Acts as a major intraday support
Buyers defend this zone
Breakdown of S3 → strong fall
S3 is often a bounce zone in the morning
Typical Market Behavior at S3
Bounce from S3 → Buy/CE opportunity
Break + Retest below S3 → PE opportunity
📌 Trader Logic: R3 & S3 Zones
⭐ 1. Range Reversal Strategy (Most Popular)
At R3 → Sell/PE
At S3 → Buy/CE
What is VWAP?
VWAP = Volume Weighted Average Price
It shows the average price at which most trading has happened during the day, based on both price and volume.
It resets every day at market open.
🔥 Why VWAP Is So Powerful?
VWAP is used by:
Institutions
Algo traders
Scalpers
Intraday traders

SMC Post-Analysis Lab [PhenLabs]📊 SMC Post-Analysis Lab
Version: PineScript™ v6
📌 Description
The SMC Post-Analysis Lab is a dedicated hindsight analysis tool built for traders who want to understand what really happened during any historical trading period. Unlike forward-looking indicators, this tool lets you scroll back through time and instantly receive algorithmic classification of market states using Smart Money Concepts methodology.
Whether you’re reviewing a losing trade, studying a successful session, or building your pattern recognition skills, this indicator provides immediate context. The expansion-aware algorithm processes price action within your selected window and outputs clear, actionable classifications ranging from Parabolic Expansion to Consolidation Inducements.
Stop relying on subjective post-trade analysis. Let the algorithm objectively tell you whether institutional players were accumulating, distributing, or running inducements during your trades.
🚀 Points of Innovation
First indicator specifically designed for SMC-based post-trade review rather than live signal generation
Dual-mode analysis system allowing both dynamic scrollback and precise date selection
Expansion-aware classification algorithm that weighs range position against net displacement
Real-time efficiency metrics calculating directional quality of price movement
Integrated visual FVG detection within the analysis window only
Interactive table with clickable date range adjustment via chart interface
🔧 Core Components
Pivot Detection Engine: Uses configurable pivot length to identify significant swing highs and lows for structure break detection
Window Calculator: Determines active analysis zone based on either bar offset or timestamp boundaries
Data Aggregator: Tracks window open, high, low, close and counts bullish/bearish structure break events
State Classification Algorithm: Applies hierarchical logic to determine market state from six possible classifications
Visual Renderer: Draws structure breaks, FVG boxes, and window highlighting within the active zone
🔥 Key Features
Sliding Window Mode: Use the Scroll Back slider to dynamically move your analysis zone backwards through history bar-by-bar
Date Range Mode: Select specific start and end timestamps for precise session or trade review
Six Market State Classifications: Parabolic Expansion (Bull/Bear), Bullish/Bearish Order Flow, Accumulation/Distribution Reversal, and Consolidation/Inducement
Range Position Percentile: See exactly where price closed relative to the window’s high-low range as a percentage
Bull/Bear Event Counter: Quantified count of structure breaks in each direction during the analysis period
Efficiency Calculation: Net move divided by total range reveals trending quality versus chop
🎨 Visualization
Blue Window Highlight: Active analysis zone is clearly marked with blue background shading on the chart
Structure Break Lines: Dashed lines appear at each bullish or bearish structure break within the window
FVG Boxes: Fair Value Gaps automatically render as semi-transparent boxes in bullish or bearish colors
Dashboard Table: Top-right positioned table displays State, Analysis description, and Metrics in real-time
Color-Coded States: Each classification uses distinct coloring for immediate visual recognition
Interactive Tip Row: Optional help text guides users on clicking the table to adjust date range
📖 Usage Guidelines
General Configuration
Analysis Mode: Default is Sliding Window. Choose Date Range for specific timestamp analysis.
Sliding Window Settings
Scroll Back (Bars): Default 0. Increase to move window backwards into history.
Window Width (Bars): Default 100. Range 20-50 for scalping, 100+ for swing analysis.
Date Range Settings
Start Date: Select the beginning timestamp for your analysis period.
End Date: Select the ending timestamp for your analysis period.
Visual Settings
Show Help Tip: Default true. Toggle to hide instructional row in dashboard.
Bullish Color: Default teal. Customize for bullish elements.
Bearish Color: Default red. Customize for bearish elements.
SMC Parameters
Pivot Length: Default 5. Lower values (3-5) catch minor breaks. Higher values (10+) focus on major swings.
✅ Best Use Cases
Post-trade review to understand why entries succeeded or failed
Session analysis to identify institutional activity patterns
Trade journaling with objective algorithmic classifications
Pattern recognition training through historical scrollback
Identifying whether stop hunts were inducements or legitimate breaks
Comparing your real-time read versus what the algorithm detected
⚠️ Limitations
Designed for historical analysis only, not live trade signals
Classification accuracy depends on appropriate pivot length for the timeframe
FVG detection uses simple gap logic without mitigation tracking
State classification is based on window data only, not broader context
Requires manual scrolling or date input to review different periods
💡 What Makes This Unique
Purpose-Built for Review: Unlike most indicators focused on live signals, this is designed specifically for post-trade analysis
Expansion-Aware Logic: Algorithm weighs both position in range AND directional efficiency for accurate state detection
Interactive Date Control: Click the dashboard table to reveal draggable anchors for window adjustment directly on chart
🔬 How It Works
1. Window Definition:
User selects either Sliding Window or Date Range mode
System calculates which bars fall within the active analysis zone
Active zone receives blue background highlighting
2. Data Collection:
Algorithm captures window open, running high, running low, and current close
Structure breaks are detected when price crosses above last pivot high or below last pivot low
Bullish and bearish events are counted separately
3. State Classification:
Range Position calculates where close sits as percentage of high-low range
Efficiency calculates net move divided by total range
Hierarchical logic applies priority rules from Parabolic states down to Consolidation
4. Output Rendering:
Dashboard table updates with State title, Analysis description, and Metrics
Visual elements render within window only to keep chart clean
Colors reflect bullish, bearish, or neutral classification
💡 Note:
This indicator is intended for educational and review purposes. Use it to develop your understanding of Smart Money Concepts by analyzing what institutional order flow looked like during historical periods. Combine insights with your own analysis methodology for best results.

Account GuardianAccount Guardian: Dynamic Risk/Reward Overlay
Introduction
Account Guardian is an open-source indicator for TradingView designed to help traders evaluate trade setups before entering positions. It automatically calculates Risk-to-Reward ratios based on market structure, displays visual Stop Loss and Take Profit zones, and provides real-time position sizing recommendations.
The indicator addresses a fundamental question every trader should ask before entering a trade: "Does this setup make mathematical sense?" Account Guardian answers this question visually and numerically, helping traders avoid impulsive entries with poor risk profiles.
Core Functionality
Account Guardian performs four primary functions:
Detects swing highs and swing lows to identify logical stop loss placement levels
Calculates Risk-to-Reward ratios for both long and short setups in real-time
Displays visual SL/TP zones on the chart for immediate trade planning
Computes position sizing based on your account size and risk tolerance
The goal is to provide traders with instant feedback on whether a potential trade meets their minimum risk/reward criteria before committing capital.
How It Works
Swing Detection
The indicator uses pivot point detection to identify recent swing highs and swing lows on the chart. These swing points serve as logical areas for stop loss placement:
For Long Trades: The most recent swing low becomes the stop loss level. Price breaking below this level would invalidate the bullish thesis.
For Short Trades: The most recent swing high becomes the stop loss level. Price breaking above this level would invalidate the bearish thesis.
The swing detection lookback period is configurable, allowing you to adjust sensitivity based on your trading timeframe and style.
It automatically adjusts the tp and sl when it is applied to your chart so it is always moving up and down!
Risk/Reward Calculation
Once swing levels are identified, the indicator calculates:
Entry Price: Current close price (where you would enter)
Stop Loss: Recent swing low (for longs) or swing high (for shorts)
Risk: Distance from entry to stop loss
Take Profit: Entry plus (Risk × Target Multiplier)
R:R Ratio: Reward divided by Risk
The R:R ratio is then evaluated against your configured thresholds to determine if the setup is valid, marginal, or poor.
Visual Elements
SL/TP Zones
When enabled, the indicator draws colored boxes on the chart showing:
Red Zone: Stop Loss area - the region between your entry and stop loss
Green/Gold/Red Zone: Take Profit area - colored based on R:R quality
The color coding provides instant visual feedback:
Green: R:R meets or exceeds your "Good R:R" threshold (default 3:1)
Gold: R:R meets minimum threshold but below "Good" (between 2:1 and 3:1)
Red: R:R below minimum threshold - setup should be avoided
Swing Point Markers
Small circles mark detected swing points on the chart:
Green circles: Swing lows (potential support / long SL levels)
Red circles: Swing highs (potential resistance / short SL levels)
Dashboard Panel
The dashboard in the top-right corner displays comprehensive trade planning information:
R:R Row: Current Risk-to-Reward ratio for long and short setups
Status Row: VALID, OK, BAD, or N/A based on R:R thresholds
Stop Loss Row: Exact price level for stop loss placement
Take Profit Row: Exact price level for take profit placement
Pos Size Row: Recommended position size based on your risk parameters
Risk $ Row: Dollar amount at risk per trade
Position Sizing Logic
The indicator calculates position size using the formula:
Position Size = Risk Amount / Risk per Unit
Where:
Risk Amount = Account Size × (Risk Percentage / 100)
Risk per Unit = Entry Price - Stop Loss Price
For example, with a $10,000 account risking 1% per trade ($100), if your entry is at 100 and stop loss at 98 (risk of 2 per unit), your position size would be 50 units.
Input Parameters
Swing Detection:
Swing Lookback: Number of bars to look back for pivot detection (default: 10). Higher values find more significant swing points but may be slower to update.
Target Multiplier: Multiplier applied to risk to calculate take profit distance (default: 2). A value of 2 means TP is 2× the distance of SL from entry.
Risk/Reward Thresholds:
Minimum R:R: Minimum acceptable Risk-to-Reward ratio (default: 2.0). Setups below this show as "BAD" in red.
Good R:R: Threshold for excellent setups (default: 3.0). Setups at or above this show as "VALID" in green.
Account Settings:
Account Size ($): Your trading account size in dollars (default: 10,000). Used for position sizing calculations.
Risk Per Trade (%): Percentage of account to risk per trade (default: 1.0%). Professional traders typically risk 0.5-2% per trade.
Display:
Show SL/TP Zones: Toggle visibility of the colored zone boxes on chart (default: enabled)
Show Dashboard: Toggle visibility of the information panel (default: enabled)
Analyze Direction: Choose to analyze Long only, Short only, or Both directions (default: Both)
How to Use This Indicator
Basic Workflow:
Add the indicator to your chart
Configure your account size and risk percentage in the settings
Set your minimum and good R:R thresholds based on your trading rules
Look at the dashboard to see current R:R for potential long and short entries
Only consider trades where the status shows "VALID" or at minimum "OK"
Use the displayed SL and TP levels for your order placement
Use the position size recommendation to determine lot/contract size
Interpreting the Dashboard:
VALID (Green): Excellent setup - R:R meets your "Good" threshold. This is the ideal scenario for taking a trade.
OK (Gold): Acceptable setup - R:R meets minimum but isn't optimal. Consider taking if other confluence factors align.
BAD (Red): Poor setup - R:R below minimum threshold. Avoid this trade or wait for better entry.
N/A (Gray): Cannot calculate - usually means no valid swing point detected yet.
Best Practices:
Use this indicator as a filter, not a signal generator. It tells you IF a trade makes sense, not WHEN to enter.
Combine with your existing entry strategy - use Account Guardian to validate setups from other analysis.
Adjust the swing lookback based on your timeframe. Lower timeframes may need smaller lookback values.
Be honest with your account size input - accurate position sizing requires accurate inputs.
Consider the target multiplier carefully. Higher multipliers mean larger potential reward but lower probability of hitting TP.
Alerts
The indicator includes four alert conditions:
Good Long Setup: Triggers when long R:R reaches or exceeds your "Good R:R" threshold
Good Short Setup: Triggers when short R:R reaches or exceeds your "Good R:R" threshold
Bad Long Setup: Triggers when long R:R falls below your minimum threshold
Bad Short Setup: Triggers when short R:R falls below your minimum threshold
These alerts can help you monitor multiple charts and get notified when favorable setups appear.
Technical Implementation
The indicator is built using Pine Script v6 and includes:
Pivot-based swing detection using ta.pivothigh() and ta.pivotlow()
Dynamic box drawing for visual SL/TP zones
Table-based dashboard for clean information display
Color-coded visual feedback system
Persistent variable tracking for swing levels
Code Structure:
// Swing Detection
float swingHi = ta.pivothigh(high, swingLen, swingLen)
float swingLo = ta.pivotlow(low, swingLen, swingLen)
// R:R Calculation for Long
float longSL = recentSwingLo
float longRisk = entry - longSL
float longTP = entry + (longRisk * targetMult)
float longRR = (longTP - entry) / longRisk
// Position Sizing
float riskAmount = accountSize * (riskPct / 100)
float posSize = riskAmount / longRisk
Limitations
The indicator uses historical swing points which may not always represent optimal SL placement for your specific strategy
Position sizing assumes you can trade fractional units - adjust accordingly for instruments with minimum lot sizes
R:R calculations assume linear price movement and don't account for gaps or slippage
The indicator doesn't predict price direction - it only evaluates the mathematical viability of a setup
Swing detection has inherent lag due to the lookback period required for pivot confirmation
Recommended Settings by Trading Style
Scalping (1-5 minute charts):
Swing Lookback: 5-8
Target Multiplier: 1-2
Minimum R:R: 1.5
Good R:R: 2.0
Day Trading (15-60 minute charts):
Swing Lookback: 8-12
Target Multiplier: 2
Minimum R:R: 2.0
Good R:R: 3.0
Swing Trading (4H-Daily charts):
Swing Lookback: 10-20
Target Multiplier: 2-3
Minimum R:R: 2.5
Good R:R: 4.0
Why Risk/Reward Matters
Many traders focus solely on win rate, but profitability depends on the combination of win rate AND risk/reward ratio. Consider these scenarios:
50% win rate with 1:1 R:R = Breakeven (before costs)
50% win rate with 2:1 R:R = Profitable
40% win rate with 3:1 R:R = Profitable
60% win rate with 1:2 R:R = Losing money
Account Guardian helps ensure you only take trades where the math works in your favor, even if you're wrong more often than you're right.
Disclaimer
This indicator is provided for educational and informational purposes only. It is not intended as financial, investment, trading, or any other type of advice or recommendation.
Trading involves substantial risk of loss and is not suitable for all investors. The calculations provided by this indicator are based on historical price data and mathematical formulas that may not accurately predict future price movements.
Position sizing recommendations are estimates based on user inputs and should be verified before placing actual trades. Always consider factors such as leverage, margin requirements, and broker-specific rules when determining actual position sizes.
The Risk-to-Reward ratios displayed are theoretical calculations based on swing point detection. Actual trade outcomes will vary based on market conditions, execution quality, and other factors not captured by this indicator.
Past performance does not guarantee future results. Users should thoroughly test any trading approach in a demo environment before risking real capital. The authors and publishers of this indicator are not responsible for any losses or damages arising from its use.
Always consult with a qualified financial advisor before making investment decisions.

Adaptive Scaled LevelsThis indicator allows users to manually define a list of price levels (e.g., round or psychological numbers) and automatically scales them to fit any asset's current price range using an intelligent anchor point. It then plots dynamic horizontal zones ideal for identifying potential supply/demand or reaction areas.
How It Works (Technical Methodology)
Manual Price List Input
Users enter a comma-separated list of price levels via a text area input (default example: 50,100,...,1400). These act as a "template" grid – often round numbers, psychological levels, or custom targets.
Auto-Scaling Logic (Core Innovation)
When enabled:
Calculates the average of the input list.
Determines a smart anchor price:
Default (Lock = 0): Close price of the highest-volume bar in the last user-defined lookback period (default 200 bars), fetched from a selectable timeframe (default Daily) via request.security().
Override: User can manually lock the anchor to any fixed price.
Computes a scale factor = Anchor / List Average.
Multiplies every input level by this factor to adapt the entire grid to the current market (e.g., scales low-price templates to BTC's 60k+ range).
Zone Construction
For each scaled level:
Creates a horizontal box centered on the level.
Height = Level × user-defined percentage (default 0.5%) for volatility-adjusted thickness.
Zones extend infinitely to the right for continuous reference.
Supply/Demand Coloring
Levels above current close: Supply color (default light gray) – potential resistance/overhead supply.
Levels below current close: Demand color (default cyan) – potential support/underlying demand.
Visual Elements
Transparent filled boxes with borders.
Optional labels showing "S" (Supply) or "D" (Demand) plus exact price.
Clean, non-cluttering design – redraws only on last bar for performance.
How to Use
This tool is perfect for plotting adaptive psychological/round number grids across any asset without manual adjustment.
Common Template: Use evenly spaced round numbers (e.g., 100 increments) as input – the script handles scaling.
BTC/ETH/Crypto: Enable auto-scaling with Daily timeframe anchor for high-volume alignment (often near fair value).
Forex/Stocks: Lower zone height % for tighter zones; use shorter lookback or lock anchor for stability.
Trading Applications:
Anticipate reactions/bounces at scaled levels (confluence with price action, volume, or order blocks).
Supply zones (above price): Potential short entries or take-profit targets.
Demand zones (below price): Potential long entries or stop-loss placement below.
Override anchor for specific analysis (e.g., lock to all-time high).
Best Practices: Combine with trend direction, higher-timeframe structure, or liquidity concepts for higher-probability setups.
Highly versatile – works on any timeframe/asset, especially volatile ones like cryptocurrencies where fixed levels quickly become irrelevant.
Disclaimer
This indicator is a technical analysis tool and should be used in conjunction with other forms of analysis. Past performance does not guarantee future results. Always use proper risk management.

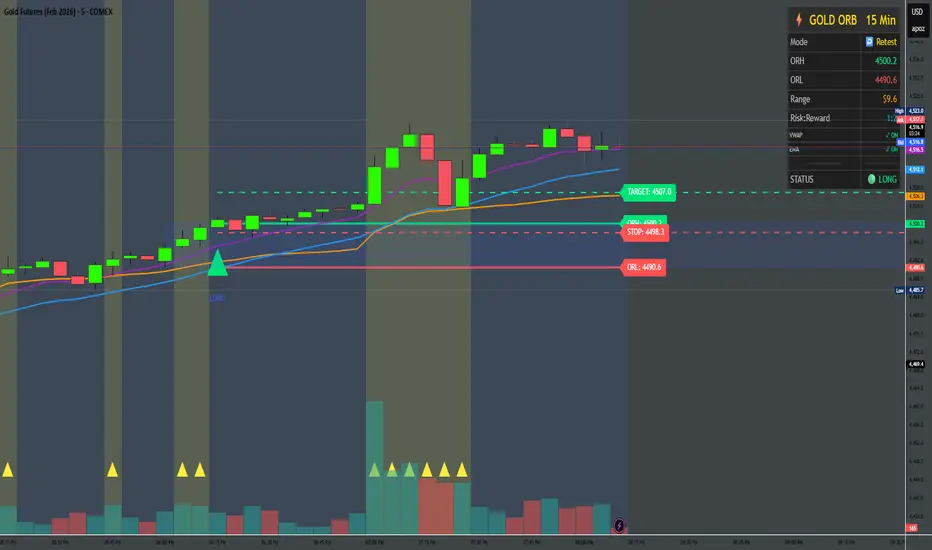
Gold ORB Strategy (3/5/15/30 Min)It's a multi-mode Opening Range Breakout system for Gold futures that automates the detection of the 7:20-7:23 AM CT opening range and provides clear visual signals for four different trading styles.
In Plain English:
"It draws a box around gold's first 3 minutes of trading, then alerts you when price breaks out with confirmation from volume, VWAP, and moving averages. It automatically calculates your entry, stop, and target prices based on your chosen strategy style."
What Makes It Unique:
4 Trading Personalities in One Tool:
Aggressive = "I want every breakout, I'll manage the fakeouts"
Confirmed = "Show me only moves that close beyond the range"
Retest = "I want the pullback entry for better R:R"
Fibonacci = "Let me buy the dip after the initial move"
Smart Confluence Filtering:
Doesn't just show every breakout
Checks if VWAP agrees (trend filter)
Verifies EMA alignment (momentum filter)
Flags volume spikes (conviction filter)
Complete Trade Management:
Automatically calculates stops (3 different methods)
Shows profit targets based on your R:R preference
Labels stick to price levels as you scroll
Visual dashboard shows all key info at a glance
What It's NOT:
Not a "buy here, sell there" robot - you still need to read the market
Not foolproof - no strategy works every day
Not optimized yet - you'll need to backtest and adjust settings for your style
The Real Value:
It takes a proven strategy from your research and makes it systematic and repeatable. Instead of manually drawing boxes and calculating stops every morning, it does the math and shows you exactly where the setup is.
The Strat Candle Labels & Color Inc F2D F2UThis script uses TheStrat candle numbers 1, 2D, 2U, 3 and places the text below or above. I have also now added the Failed 2D/2U labels. You can also change the text size. This also allows you to change the colors of the candles with two options for the 1 & 3 so you can color them in the direction they are going. For example a 1 that is green can be green and a 1 that is red can be red.

Gaps IdentifierThis indicator identifies up and down Gaps using previous period's close price to the next period's open price. Potentially useful for Gap rebound strategies.
(Will identify gaps 4%–11% by default; can change in settings)

Trinity Multi-Timeframe CCITrinity Multi-Timeframe CCI Indicator
This Pine Script indicator is a powerful **multi-timeframe Commodity Channel Index (MTF CCI)** tool that displays three CCI lines on a single pane:
- **Current timeframe** (whatever chart you're viewing, e.g., 1h, 15m, etc.)
- **4-hour timeframe**
- **Daily timeframe**
All three use the same CCI length (default 20, adjustable) and are fully customizable—you can enable/disable each line, change its timeframe, color, and thickness. Horizontal levels at 0 (dashed white by default), +100 (red), and -100 (green) are also included and fully editable.
### Core Functionality & Visual Signals
The standout feature is the **dynamic coloring of the current timeframe CCI line**:
- **Green**: Strong **bullish alignment**. This occurs when **all three CCIs are above the zero line** AND the current timeframe CCI is the **highest** of the three (leading the move upward with higher-timeframe confirmation).
- **Red**: Strong **bearish alignment**. This occurs when **all three CCIs are below the zero line** AND the current timeframe CCI is the **lowest** of the three (leading the move downward with higher-timeframe confirmation).
- **Yellow**: Neutral or no clear alignment (default state when the above conditions aren't met).
An optional light background shading (green or red) highlights when the indicator is in a bullish or bearish state.
Small triangle markers appear on the pane when a new bullish or bearish alignment forms, and built-in alerts notify you of new signals or when a signal ends. These are editable to enable or disable.
### How Traders Can Use It
This indicator helps identify **high-probability trend continuations or reversals** by combining momentum (CCI) across multiple timeframes with alignment confirmation:
- **Trend-following entries**: A green current line (especially with a fresh alert) suggests strong upward momentum backed by higher timeframes—ideal for long entries or adding to positions in an uptrend.
- **Bearish entries/short setups**: A red current line signals strong downward momentum confirmed across timeframes—good for short entries or exiting longs.
- **Confluence filter**: Use it as a filter for other strategies. Only take trades in the direction of the alignment (e.g., only long if current line is green).
- **Early warning of weakness**: When the current line turns yellow after being green/red, it often signals the trend is losing multi-timeframe support—useful for tightening stops or taking partial profits.
In essence, it visually answers the question: “Is the short-term momentum not only strong, but also aligned with and leading the medium- and long-term momentum?” When the answer is yes (green or red), it highlights moments of **multi-timeframe confluence**—some of the most reliable setups in technical trading.
The alerts make it practical for active traders: you get notified the moment a strong aligned signal appears, without needing to watch the chart constantly.
It's clean, highly customizable, and focuses on one clear concept—**multi-timeframe CCI leadership**—making it excellent for trend, swing, and even intraday traders looking for higher-timeframe confirmation.

Volume-Weighted Fibonacci PivotThis indicator automatically plots dynamic Fibonacci retracement and extension levels based on a volume-weighted pivot point within a user-defined lookback period or date range. It intelligently calculates a central "pivot" price biased toward high-volume bars, then draws symmetric levels both upward (extensions) and downward (retracements) for balanced confluence analysis.
How It Works (Technical Methodology)
Lookback Period Determination
Multiple filter modes control the data range used for calculations:
"Last X Bars": Fixed number of recent bars (default 400, max 4999).
"Manual Date": User-specified start date.
"Interactive (Chart)": Confirmed start date via input.
"None": Full available history (falls back to max bars).
Optionally, when using "Last X Bars", calculations can pull data from a higher/lower user-selected timeframe via request.security() for multi-timeframe alignment.
A dotted vertical line marks the start point in date-based modes.
Range and Pivot Calculation
Within the selected period:
Highest high and lowest low define the full price range.
Average volume is computed across the period.
Volume-Weighted Pivot: Average close price only from bars where volume > average volume (fallback to simple midpoint if no high-volume bars).
This creates a "smart" central pivot that leans toward areas of greater participation, often aligning with institutional activity.
Fibonacci Level Generation
User-configurable ratios (default: 0.236, 0.382, 0.5, 0.618, 0.786, 1.0, 1.272, 1.414, 1.618).
Levels are calculated symmetrically around the volume-weighted pivot:
Upward: Pivot + (Range × Ratio × Correction Factor) – teal/cyan shades.
Downward: Pivot - (Range × Ratio × Correction Factor) – red shades.
Correction Factor (default 0.5): Scales level spacing for tighter/wider grids without altering ratios.
Only the user-defined number of active lines (default 9) are drawn.
Visual Construction
Central Pivot Line: Thick yellow horizontal line with label showing exact price.
Up/Down Levels: Dashed lines extended into the future, labeled with ratio direction ("Up" or "Dn").
All objects redraw only on the last bar for performance, clearing previous drawings.
Multi-Timeframe Option
When enabled with "Last X Bars":
Pulls high/low/volume data from specified timeframe.
Aligns the pivot and levels to higher-timeframe structure while displaying on current chart – ideal for intraday traders seeking HTF confluence.
How to Use
This tool provides clean, volume-aware Fibonacci grids for identifying potential support/resistance, reversal zones, and targets.
Volume-Weighted Pivot: Often acts as a strong mean reversion level or fair value area.
Upward Levels (Teal): Potential resistance/extensions in bullish moves; watch for reactions on retests.
Downward Levels (Red): Potential support/retracements in bearish moves.
Confluence: High probability when price reacts at levels aligning with other tools (order blocks, pivots, volume profile).
Correction Factor: Lower values (<0.5) for tighter grids in ranging markets; higher (>0.5) for trending markets.
Multi-Timeframe Mode: Use on lower charts (e.g., 15m) with HTF input (e.g., 4H or Daily) to project major structure levels.
Common Setups:
Pullbacks to 0.618–0.786 zones for continuation entries.
Breaks beyond 1.0–1.618 for extension targets.
Reactions near pivot line for mean reversion trades.
Adjust ratios and active line count to match your preferred Fibonacci style (classic retracement vs. extensions).
Disclaimer
This indicator is a technical analysis tool and should be used in conjunction with other forms of analysis. Past performance does not guarantee future results. Always use proper risk management.

LJ Parsons Adjustable expanding MRT FibBased on premium/discount/fair-value levels the indicator will expand with the market by settable dates.
The levels are not fib based as such but are resonant levels within an multiplicative /12 log scale using the LJ Parsons Market resonance hypothesis.

Squeeze + ADX + TTM [V6]Execution speed: The TradingView engine processes v6 scripts much faster.
Stability: By using standard functions like ta.sma or ta.linreg, the indicator is less prone to calculation errors on lower timeframes.
Clarity: I've reorganized the ADX calculation within a function to make it more readable if you decide to modify it later.
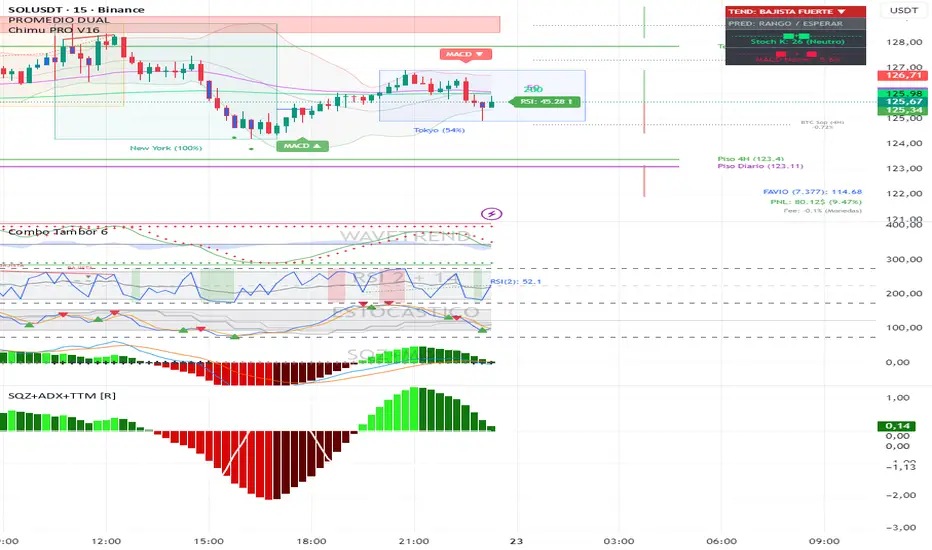
FNO Simple Signals: EMA 9/21 + VWAP by Avis
How it behaves on chart (5 or 15 min F&O):
BUY signal: EMA 9 crosses above EMA 21 and price is above VWAP → one green “BUY” triangle under that candle.
SELL signal: EMA 9 crosses below EMA 21 and price is below VWAP → one red “SELL” triangle above that candle.
Below is a clean, stable indicator for F&O: EMA 9/21 + VWAP + very light ORB, no risky time arithmetic.
