Extreme Entry with Mean Reversion and Trend FilterThis non-repainting indicator is an improved version of my previous work, a more versatile tool designed to provide traders with dynamic and adaptive entry signals while incorporating a mean reversion and trend filtering mechanism. By combining RSI overbought/oversold, regular divergence and confirmatory momentum oscillator such as CCI or MOM, this indicator generates more precise and timely signals for entering trades.
The indicator offers a comprehensive set of entry conditions for both Buy and Sell entries:
• For Buy entries, it checks for oversold conditions based on RSI levels, and detects bullish divergence patterns while oversold and it identifies upward crossovers in the selected entry signal source (CCI or Momentum).
• Similarly, for Sell entries, it identifies downward crossovers of the CCI or Mom, after the recent overbought conditions, and bearish divergence patterns inside the overbought RSI.
To refine the entry signals even further, the indicator utilizes a mean reversion filter. Traders can choose to display signals that occur inside or outside the upper and lower mean reversion bands:
• Range Entries are indicating potential buying opportunities near the lower band and selling opportunities near the upper band. This is based on the concept of mean reversion, which suggests that prices tend to return to the average when they reach the upper or lower bands. By focusing on these signals, traders can take advantage of price movements that have a higher probability of reversing towards the mean.
• Extreme Entries, on the other hand, represent signals that occur outside of the bands, signaling potential pullbacks during strong trends. By entering positions only at extreme highs or lows, traders can avoid getting caught in the middle of the trend. This approach helps traders capitalize more favorable trading opportunities which have a high reward-risk ratio.
Trend Filter acts as a directional bias for the entry signals. When enabled, long and short entry conditions are filtered based on the relationship between the closing price and the EMA.
Traders have the flexibility to customize, tweak the indicator filter and values in the settings according to their preferences strategies and traded assets, tailoring the signals to their specific needs. The script sets alert conditions to trigger alerts for buy, sell, or both entry signals. This indicator can be used in conjunction with price action or other technical analysis tools for confirmation and better trading decisions.
I created this indicator for my own use, and I share this for informational purposes only. It does not constitute financial advice so use at your own risk and consider your financial situation before making any trading decisions. The indicator's accuracy is not guaranteed, and past performance is not indicative of future results.
I appreciate your feedback on this indicator. As I am new to script development, I am open to comments and suggestions to improve it. If you encounter any issues while using this indicator, please let me know in the comments section. If you find it helpful, I kindly ask for your support in boosting it. Thank you for your cooperation.
Oversold

Edri Extreme Points Buy & SellEDRI EXTREME POINTS BUY & SELL INDICATOR
This Buy and Sell (non-repainting) indicator uses signals based on the combined CCI/Momentum and RSI indicators and optional regular divergence.
The idea of the indicator is to look for a potential reversal after the price reached extreme points (overbought or oversold) and signals an entry when the price shows signs of momentum for reversal.
Optionally, it considers finding a divergence while RSI is at the extreme levels to improve the predictability of a possible reversal.
Additionally, the indicator includes a simple Mean Reversion visual on the chart to assist users in identifying extreme price levels and potential reversal opportunities. It features upper and lower bands that can be optionally plotted, showing calculated values where price bounces at those extreme levels.
The purpose of these bands is to help traders avoid getting trapped in the middle of a trend and to guide them to buy low and sell high. (It's important to note that this is purely a visual aid and does not impact the generation of trade signals.)
By utilizing the Mean Reversion bands alongside the entry conditions, traders can gain insights into potential price reversals and make more informed decisions about when to enter or exit trades.
Buy and Sell Entry conditions:
• The indicator looks at the CCI/Momentum indicator to turn positive (if buy) or negative (if sell) after the RSI was overbought or oversold in the recent past.
• It also checks if there is a 3-period regular bullish divergence in the RSI (if buy), or regular bearish divergence (if sell) and consider these in the entry condition.
• If these conditions are met, this indicator suggests that it may be a good time to enter a trade.
In summary this is how this indicator works:
• The indicator takes input settings such as the choice between using CCI or Momentum as the entry signal source, length parameters for CCI/Momentum, RSI levels for overbought and oversold conditions, RSI length, and options to plot mean reversion bands on the chart.
• It calculates the CCI and Momentum and RSI values based on user-defined length..
• It checks for regular bullish and bearish divergences (3 periods) in the RSI if the option is enabled.
• The script plots shapes on the chart to indicate the buy and sell signals based on the entry conditions.
• If the mean reversion bands option is enabled, it calculates the mean reversion, standard deviation, upper band, and lower band values.
• It also plots the upper band, mean reversion line, and lower band on the chart if the mean reversion bands option is enabled.
• This indicator includes alert conditions to generate alerts for the buy and sell signals.
• On top of that, users can opt to use only one alert for both buy and sell signals. (This can save Trading view subscribers with limited alerts.)
Important! Please do not consider everything you read here as financial advice. Additionally, do not rely solely on indicators for making your trading decisions. It is important to note that no indicator or strategy is perfect. Therefore, it is always recommended to backtest everything and practice proper risk management.
I appreciate your feedback on this indicator. As I am new to script development, I am open to comments and suggestions to improve it. If you encounter any issues while using this indicator, please let me know in the comments section. If you find it helpful, I kindly ask for your support in boosting it. Thank you for your cooperation.

Price Exhaustion IndicatorThe Price Exhaustion Indicator (PE) is a powerful tool designed to identify trends weakening and strengthening in the financial markets. It combines the concepts of Average True Range (ATR), Moving Average Convergence Divergence (MACD), and Stochastic Oscillator to provide a comprehensive assessment of trend exhaustion levels. By analyzing these multiple indicators together, traders and investors can gain valuable insights into potential price reversals and long-term market highs and lows.
The aim of combining the ATR, MACD, and Stochastic Oscillator, is to provide a comprehensive analysis of trend exhaustion. The ATR component helps assess the volatility and range of price movements, while the MACD offers insights into the convergence and divergence of moving averages. The Stochastic Oscillator measures the current price in relation to its range, providing further confirmation of trend exhaustion. The exhaustion value is derived by combining the MACD, ATR, and Stochastic Oscillator. The MACD value is divided by the ATR value, and then multiplied by the Stochastic Oscillator value. This calculation results in a single exhaustion value that reflects the combined influence of these three indicators.
Application
The Price Exhaustion Indicator utilizes a unique visual representation by incorporating a gradient color scheme. The exhaustion line dynamically changes color, ranging from white when close to the midline (40) to shades of purple as it approaches points of exhaustion (overbought at 100 and oversold at -20). As the exhaustion line approaches the color purple, this represents extreme market conditions and zones of weakened trends where reversals may occur. This color gradient serves as a visual cue, allowing users to quickly gauge the strength or weakness of the prevailing trend.
To further enhance its usability, the Price Exhaustion Indicator also includes circle plots that signify potential points of trend reversion. These plots appear when the exhaustion lines cross or enter the overbought and oversold zones. Red circle plots indicate potential short entry points, suggesting a weakening trend and the possibility of a downward price reversal. Conversely, green circle plots represent potential long entry points, indicating a strengthening trend and the potential for an upward price reversal.
Traders and investors can leverage the Price Exhaustion Indicator in various ways. It can be utilized as a trend-following tool, or a mean reversion tool. When the exhaustion line approaches the overbought or oversold zones, it suggests a weakening trend and the possibility of a price reversal, helping identify potential market tops and bottoms. This can guide traders in timing their entries or exits in anticipation of a trend shift.
Utility
The Price Exhaustion Indicator is particularly useful for long-term market analysis, as it focuses on identifying long-term market highs and lows. By capturing the gradual weakening or strengthening of a trend, it assists investors in making informed decisions about portfolio allocation, trend continuation, or potential reversals.
In summary, the Price Exhaustion Indicator is a comprehensive and visually intuitive tool that combines ATR, MACD, and Stochastic Oscillator to identify trend exhaustion levels. By utilizing a gradient color scheme and circle plots, it offers traders and investors valuable insights into potential trend reversals and long-term market highs and lows. Its unique features make it a valuable addition to any trader's toolkit, providing a deeper understanding of market dynamics and assisting in decision-making processes. Please note that future performance of any trading strategy is fundamentally unknowable, and past results do not guarantee future performance.

Rough AverageThe Rough Average indicator is a unique technical tool that calculates a modified average to provide insights into market conditions. It incorporates a combination of mathematical operations and existing indicators to offer traders a different perspective on price movements.
The Rough Average indicator aims to capture market dynamics through a specific calculation method. It utilizes two main components: a check for the approximate scale of the price and a profile calculation based on the Relative Strength Index (RSI) of the closing price.
Methodology:
Approximate Scale: The indicator determines the approximate scale of the price by analyzing the magnitude of the closing price. This step involves a mathematical process that identifies the power of 10 that best represents the scale. This function reduces overall lag and gives a better smoothing to the output of the calculation
Profile Calculation: The indicator calculates a profile value by summing the absolute values of the RSI of the closing price over a specified period. The RSI provides insights into the strength or weakness of price movements. The profile calculation considers a range of prices based on the determined scale.
Indicator Calculation:
The Rough Average is derived by applying the Exponential Moving Average (EMA) to the calculated profile. The EMA is a smoothing technique that emphasizes recent price data. The resulting value represents the modified average of the indicator.
Utility:
The Rough Average indicator offers traders an alternative perspective on market conditions. By utilizing a modified average calculation, it can reveal potential trends, reversals, or periods of market strength or weakness. Traders can use the Rough Average to complement their analysis and identify possible trading opportunities.
It is important to note that the effectiveness of the Rough Average indicator may vary depending on the specific market and trading strategy. It is recommended to combine its analysis with other technical indicators and conduct thorough testing before making trading decisions.
Key Features:
Customizable OB\OS Levels
Bar coloring methods: Trend, Reversions, Extremities
Example Charts:

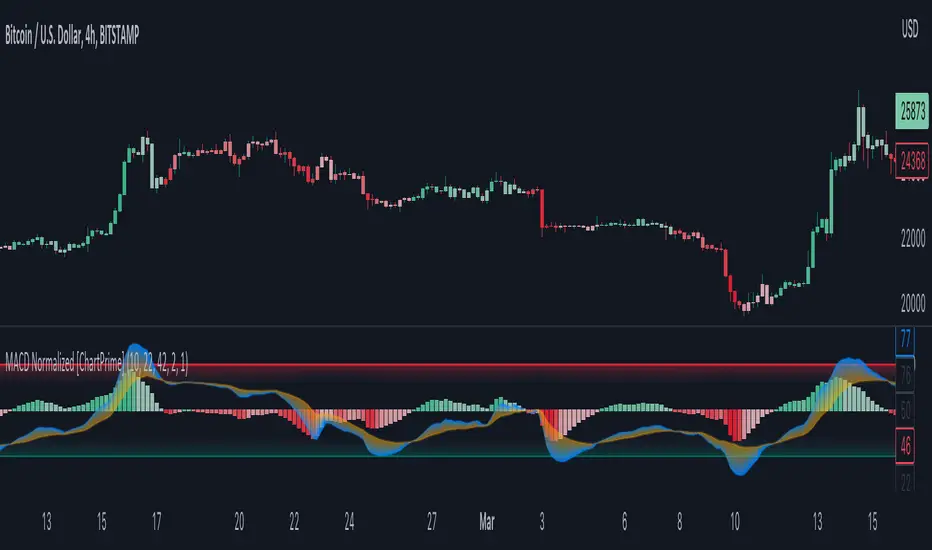
MACD Normalized [ChartPrime]Overview of MACD Normalized Indicator
The MACD Normalized indicator, serves as an asset for traders seeking to harness the power of the moving average convergence divergence (MACD) combined with the advantages of the stochastic oscillator. This novel indicator introduces a normalized MACD, offering a potentially enhanced flexibility and adaptability to numerous market conditions and trading techniques.
This indicator stands out by normalizing the MACD to its average high and average low, also factoring in the deviation of the high-low position from the mean. This approach incorporates the high and low in the calculations, providing the benefits of stochastic without its common drawbacks, such as clipping problems. As a result, the indicator becomes exceptionally versatile and suitable for various trading strategies, including both faster and slower settings.
The MACD Normalized Indicator boasts a variety of options and settings. The features include:
Enable Ribbon: Toggle the display of the ribbon accompanying the MACD Normalized, as desired.
Fast Length: Determine the movement speed of the fast line to receive advance notice of potential market opportunities.
Slow Length: Control the movement pace of the slow line for smoother signals and a comprehensive outlook on market trends.
Average Length: Specify the length used to calculate the high and low averages, providing greater control over the indicator's granularity.
Upper Deviation: Establish the extent to which the high and low values deviate from the mean, ensuring adaptability to diverse market situations.
Inner Band (Middle Deviation): Adjust the balance between the high and low deviations to create an inner band signal, giving traders a secondary level of market analysis and decision-making support.
Enable Candle Color: Enable the coloring of candles based on the MACD Normalized value for effortless visualization of trading potential.
Use Cases for the MACD Normalized Indicator
In addition to analyzing market trends and identifying potential trading opportunities, ChartPrime's MACD Normalized Indicator offers a range of applications for traders. These use cases encompass distinct trading scenarios and strategies:
Overbought and Oversold Regions
One of the key applications of the MACD Normalized Indicator is identifying overbought and oversold regions. Overbought refers to a situation where an asset's price has risen significantly and is expected to face a downturn, while oversold indicates a price drop that may subsequently lead to a reversal.
By adjusting the indicator's parameters, such as the upper and inner deviation levels, traders can set precise boundaries to determine overbought and oversold areas. When the MACD moves into the upper region, it may signal that the asset is overbought and due for a price correction. Conversely, if the MACD enters the lower region, it possibly indicates an oversold condition with the potential for a price rebound.
Signal Line Crossovers
The MACD Normalized Indicator displays two lines: the fast line and the slow line (inner band). A common trading strategy involves observing the intersection of these two lines, known as a crossover. When the fast line crosses above the slow line, it may signify a bullish trend or a potential buying opportunity. Conversely, a crossover with the fast line moving below the slow line typically indicates a bearish trend or a selling opportunity.
Divergence and Convergence
Divergence occurs when the price movement of an asset does not align with the corresponding MACD values. If the price establishes a new high while the MACD fails to do the same, a bearish divergence emerges, suggesting a potential downtrend. Similarly, a bullish divergence takes place when the price forms a new low but the MACD does not follow suit, hinting at an upcoming uptrend.
Convergence, on the other hand, is represented by the MACD lines moving closer together. This movement signifies a potential change in the trend, providing traders with a timely opportunity to enter or exit the market.
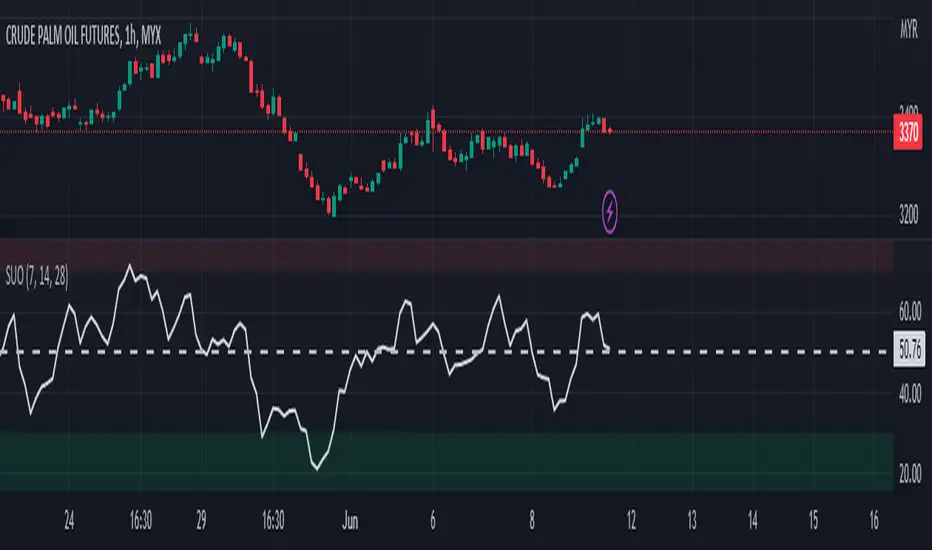
Simple Ultimate Oscillator█ OVERVIEW
This indicator as an educational and showcase the usage of user-defined types (UDT) or objects for Ultimate Oscillator.
█ CREDITS
TradingView
█ FEATURES
1. Color of plot is based on contrast color of chart background.
2. Plot fill of overbought and oversold.
3. Support Multi Timeframe.
Multi Bollinger Bands with Over ZoneThis indicator is called "Multi Bollinger Bands with Over Zone". The indicator uses linear regression to calculate the regression line and standard deviation to calculate the upper and lower deviation lines. It also plots filled areas between the deviation lines to highlight overbought and oversold zones.
The indicator has several customizable inputs, including the length of the regression period, depth, and deviations used to calculate the deviation lines.
The regression line is plotted in green color with circle markers. The upper and lower deviation lines are plotted in blue and red colors, respectively. The area between the deviation lines is filled with light blue color for the overbought zone and light pink color for the oversold zone.
This indicator helps traders in identifying trends and potential price reversals. When the price is above the upper deviation line, it indicates a potential overbought zone, while when the price is below the lower deviation line, it indicates a potential oversold zone.
Please note that this indicator is only a tool for analysis and does not provide direct trading signals. It is important to combine this indicator with additional analysis and appropriate trading strategies.

Risk-Adjusted Return OscillatorThe Risk-Adjusted Return Oscillator (RAR) is designed to aid traders in predicting future price action by analysing the risk-adjusted performance of an asset. This oscillator is displayed directly on the price chart, unlike other oscillators.
By considering the risk-return relationship, the indicator helps identify periods of overvaluation or undervaluation, allowing traders to anticipate potential price reversals or trend accelerations.
HOW TO USE
The Risk-Adjusted Return Oscillator analyses the risk-adjusted performance of an asset to detect price reversals and accelerations. Here's how to interpret its signals:
Ranging Market:
Overbought Signal: When the RAR curve reaches the overbought level (upper red line), it suggests a potential reversal signal. It indicates that the asset may be overvalued, and a price correction or trend reversal could occur.
Oversold Signal: When the RAR curve reaches the oversold level (lower red line), it indicates a potential reversal signal. It suggests that the asset may be undervalued, and a price correction or trend reversal could take place.
Trending Market:
Overbought Signal: In a trending market, an overbought signal (RAR curve reaching upper red line) suggests trend acceleration. It indicates that the existing trend is gaining strength, and buying pressure is increasing.
Oversold Signal: In a trending market, an oversold signal (RAR curve reaching lower red line) also signifies trend acceleration. It suggests that the prevailing trend is intensifying, and selling pressure is increasing.
Thus, it's important to consider the market context when interpreting overbought and oversold signals. In ranging markets, these signals act as potential reversal points. However, in trending markets, they indicate trend acceleration, reinforcing the current price direction.
SETTINGS
Period Length: Adjust the number of bars used to calculate returns and standard deviation.
Smoothing: Define the smoothing period for the RAR curve.
Show Overbought/Oversold Signals: Choose whether to display triangular shapes for overbought and oversold conditions.

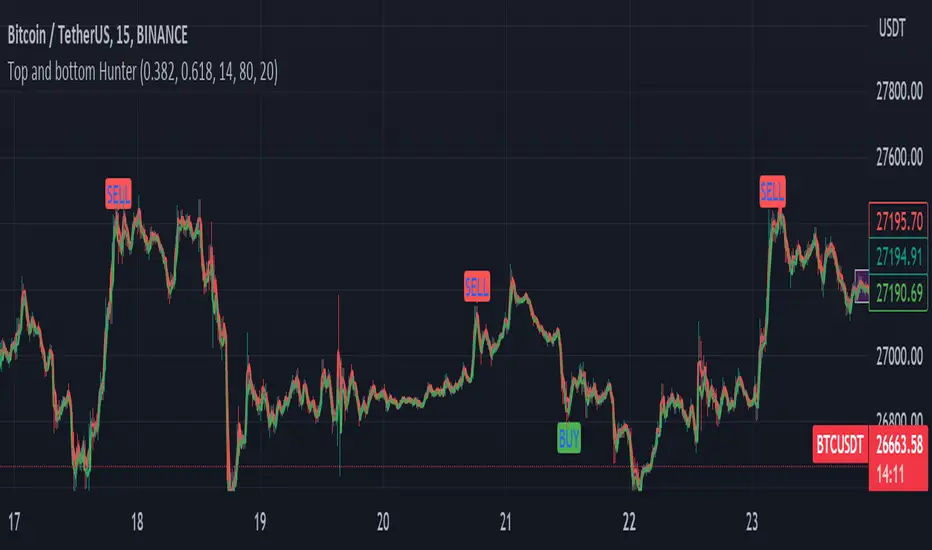
Fib top and bottom Hunter - No Repaint "Top and bottom Hunter" indicator combines two popular technical analysis tools, Fibonacci retracement levels and the Relative Strength Index (RSI), to identify potential trading opportunities in the market.
Fibonacci retracement levels are based on the Fibonacci sequence, a mathematical series where each number is the sum of the two preceding ones. In trading, Fibonacci retracement levels are used to identify potential support and resistance levels based on the recent price action. The indicator uses two Fibonacci levels, fib_0 and fib_1, which are typically set to 0.382 and 0.618, respectively. These levels represent common retracement ratios.
To calculate the Fibonacci levels, the indicator considers the highest and lowest prices within a specified range, typically the highest and lowest of the last two bars. It calculates the fib_range, which is the difference between the highest and lowest prices. Then, fib_level_0 and fib_level_1 are determined by subtracting the Fibonacci ratios from the highest price.
The RSI is a momentum oscillator that measures the speed and change of price movements. It helps identify overbought and oversold conditions in the market. The RSI parameters used in this indicator are rsi_length (length of the RSI calculation), rsi_overbought (upper threshold indicating overbought conditions), and rsi_oversold (lower threshold indicating oversold conditions). The RSI value is calculated based on the closing prices.
The indicator generates buy and sell signals based on specific conditions:
Buy Condition: A buy signal is triggered when the RSI crosses above the oversold level (rsi_oversold) and the closing price is higher than fib_level_1. This indicates a potential reversal or bounce from the Fibonacci support level.
Sell Condition: A sell signal is triggered when the RSI crosses below the overbought level (rsi_overbought) and the closing price is lower than fib_level_0. This suggests a potential reversal or pullback from the Fibonacci resistance level.
In summary, this indicator combines the power of Fibonacci retracement levels and the RSI to identify potential trading opportunities. It helps traders find confluence between the Fibonacci support or resistance levels and the RSI readings, indicating potential trend reversals or bounces. Traders can use this information to make informed decisions about entering or exiting positions in the market.
Feel free to change the settings for what works best for you and use this with other confluences. I personally use RSI overbought and oversold values as 80 and 20
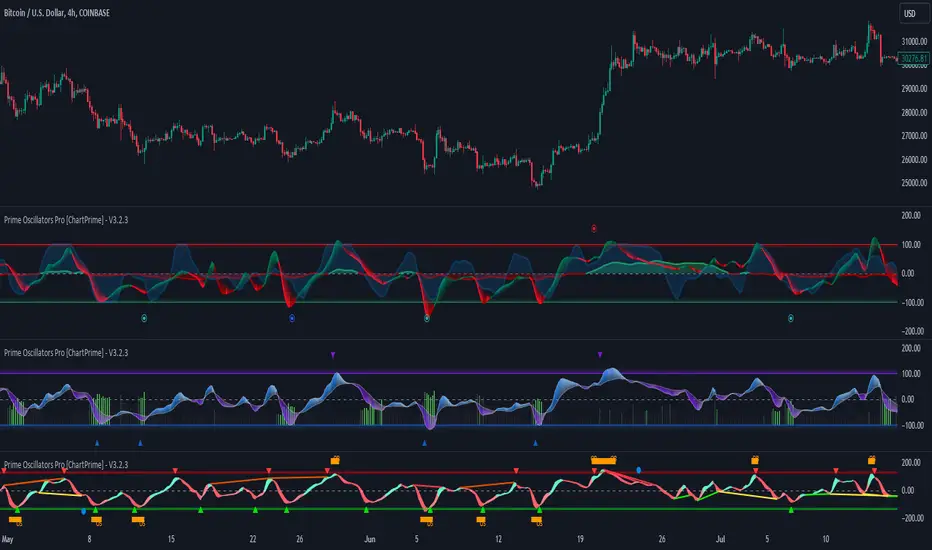
Prime Oscillators Pro [ChartPrime]The Prime Oscillators Pro suite provides two unique oscillators that provide useful insights on divergences, overbought and over sold conditions, momentum reversals, confluence alerts, amongst a myriad of other features.
The Trend Fusion Oscillator
This oscillator uses an amalgamation of price and volume to give market participants useful insight into possible future price action. It is designed in the format of a classical oscillator to be recogniseable and have a easy learning curve.
The main features of the Trend Fusion Oscillator:
Trend mode: The price volume oscillator uses an adaptive calculation to signify when price is entering a downtrend or and uptrend. When the price volume oscillator intersects with the adaptive plot the color of the price volume band will change to signify an uptrend or a down trend. This is easy to interpret with red signifying a down trend and green signifying an uptrend.
Oversold or overbought conditions: A reasonable range calculation was implemented and normalized in order to extrapolate areas of overbought an oversold conditions.
Divergences: When the price volume oscillator ribbon peaks and valleys are diverging with price action a thin line will connect the two diverging peaks or vallyes to indicate to market participants that there is a higher probability of a reversal. Divergences can be used in a classical fashion for trading.
Areas of reversal: These signals incorporate an algorithm that takes the median length of the assets trends, average true range, price deviation, volatility, and gap conditions, to signal areas with high a probability of reversal.
Main Settings
Oscillator Mode: Select the desired type of oscillator via this dropdown
Bands On/Off: Display deviation bands on the oscillators
Bearish Divergences On/Off: Allow for toggling of bearish divergences
Hidden Bearish Divergences On/Off: Allow for toggling of hidden bearish divergences
Bullish Divergences On/Off: Allow for toggling of bullish divergences
Hidden Bullish Divergences On/Off: Allow for toggling of bullish divergences
Max disatance between points: Input to adjust the distances between divergences in terms of candles
Use cases
The Trend Fusion Oscillator can be used in a simple fashion using the red/green waves to idenfity market direction. Using the waves of the market, a trader can filter other indicators and build confluence. This can also apply to contrarian logic. Divergences and oversold/bought levels can be used in confluence with other factors such as classical SR or other user selected indicators.
The Prime oscillator
Reversal signals: These are in essence a contrarian signal predicting the reversal of the market and the oscillator.
The peak seekers are blue dots that analyse multiple indicators to deduce more accurate and confluence within divergences. Settings here are auto optimised depending on the user selected timeframe.
The momentum ribbon analyses market volatility and produces an actionable ribbon on which other calculations are deduced. When it twists it can indicate a shift in the trend.
Divergences are calculated so the indicator can catch the maxmimum number of divergences in order to avoid possible reversals being missed by the trader.
Risk Disclaimer
All content and developments created by ChartPrime are purely for informational & educational purposes only. Past performance does not guarantee future results.
Płatny skrypt
Broadview Underpriced & OverpricedIntroducing the groundbreaking Broadview Underpriced & Overpriced indicator—a convergence of science, technology, and mathematical finance. This cutting-edge development takes the highly acclaimed Overbought & Oversold Heatmap and elevates it to an entirely new level by infusing it with price trends through the application of special moving averages. The result is a revolutionary approach to asset classification, allowing traders, investors, and institutions to categorize assets into four distinct categories: Underpriced, Overpriced, Discounted, and Inflated.
The Broadview Underpriced & Overpriced indicator combines the power of the Overbought & Oversold Heatmap with a sophisticated methodology that leverages special moving averages. These unique moving averages enhance the precision and accuracy of the asset classification process, providing traders with unparalleled insights into market conditions.
Under the Broadview Underpriced & Overpriced framework, assets that are deemed oversold and positioned below the special moving average are identified as Underpriced. This designation implies that the asset's current price is undervalued relative to its intrinsic worth, presenting an opportune moment to consider initiating a buying position. Underpriced assets are represented by a vibrant purple color on the indicator, symbolizing the potential for significant buying opportunities.
Conversely, assets that are considered overbought and situated above the special moving average are labeled as Overpriced. This classification indicates that the asset's current price has exceeded its intrinsic value, suggesting a favorable moment to contemplate selling or reducing exposure to the asset. Overpriced assets are visually depicted by a striking teal color, signifying the potential for optimal selling opportunities.
Moreover, the Broadview Underpriced & Overpriced indicator recognizes a third category known as Discounted assets. These assets are characterized by being positioned above the special moving average while simultaneously experiencing oversold conditions. This classification suggests that although the asset's price may be above its average value, it is currently available at a discounted price relative to its long-term potential. Discounted assets are represented by a deep purple hue, indicating an opportunity for buyers to consider making purchases with a lower aggression dollar-cost averaging (DCA) strategy.
Lastly, the indicator identifies Inflated assets as those positioned below the special moving average while concurrently exhibiting overbought conditions. This classification implies that the asset's price may be temporarily inflated compared to its intrinsic worth. Inflated assets are depicted by a rich teal color, representing an indication for trend traders or those looking to capitalize on consolidations.
The Broadview Underpriced & Overpriced indicator brings forth a groundbreaking evolution in asset classification, meticulously combining the Overbought & Oversold Heatmap with the influence of special moving averages. Through this unique fusion, traders and investors gain access to an unprecedented level of insight, enabling them to make informed decisions based on a comprehensive evaluation of market trends.
The Broadview Underpriced & Overpriced indicator represents a paradigm shift in asset classification, uniting science, technology, and mathematical finance to deliver an innovative and comprehensive trading tool. By leveraging special moving averages in conjunction with the Overbought & Oversold Heatmap, this indicator enables traders, investors, and institutions to categorize assets as Underpriced, Overpriced, Discounted, or Inflated. Its visually captivating color scheme and strategic insights empower market participants to navigate market trends with precision, enhancing their ability to capitalize on optimal buying and selling opportunities while employing various trading strategies.

Investor Satisfaction/Price Divergence Ox_kali The "Investor Satisfaction/Price Divergence" is an indicator designed to quantify investor satisfaction and pinpoint potential price divergences.
The primary goal of this indicator is to provide a reliable tool for gauging investor sentiment and identifying price divergences. These insights can be instrumental in predicting possible market trend reversals.
Key Features
Calculation of the highest and lowest prices over a user-defined period.
Computation of the average satisfaction of investors who have invested over a user-defined period.
Normalization of average satisfaction between 0 and 1 to provide a standardized measure of investor sentiment.
Identification of price divergence between the normalized satisfaction and the actual asset price.
Detection of anomalies in satisfaction change, which can suggest unusual market conditions.
Plotting an histogram display of the difference between normalized satisfaction and price divergence.
Functionality Analysis:
This indicator begins by identifying the highest and lowest prices over a period defined by the user. It then calculates the average investor satisfaction based on the change in the closing price from the investment point to the current price, relative to the range between the highest and lowest prices.
This satisfaction measure is then normalized between 0 and 1, providing a uniform measure of investor sentiment. The indicator also identifies potential price divergence by comparing the normalized satisfaction with the normalized price. This divergence is then plotted as a histogram, with the color of the histogram bars indicating whether the market is oversold, overbought, or in a normal state. Anomalies in satisfaction change are highlighted, helping traders to spot unusual market behavior.
Trading Application
The "Investor Satisfaction & Price Divergence" indicator can be incorporated into a variety of trading strategies. A significant divergence between normalized satisfaction and the asset price can signal a potential market reversal. Additionally, a sudden drop or rise in investor satisfaction could indicate a sell-off or a buying spree, respectively. Additionally, the capability to spot irregularities in satisfaction change may be useful in recognizing unusual market conditions, possibly providing early indications of noteworthy market events
Please note that the investor Satisfaction/Price Divergence by Ox_kali is provided for educational purposes only and is not meant to constitute financial advice. Thi indicator is not a guarantee of future market performance and should be used in conjunction with proper risk management. Always ensure that you have a thorough understanding of the indicator’s methodology and its limitations before making any investment decisions. Additionally, past performance is not indicative of future results.

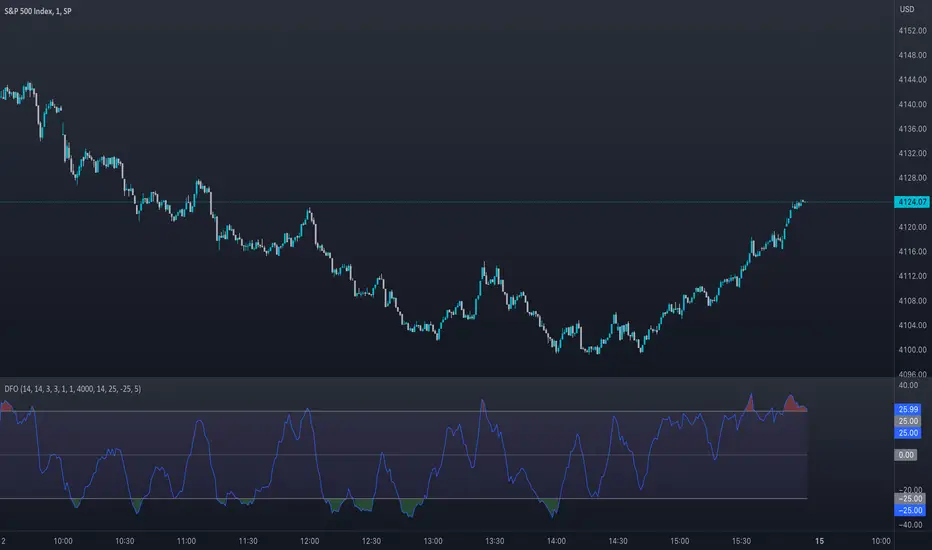
Dynamic Fusion Oscillator (DFO)The Dynamic Fusion Oscillator (DFO) is a uniquely crafted trading indicator that amalgamates the power of the Relative Strength Index (RSI) and the Stochastic Oscillator into a single, comprehensive tool. It provides traders with a more nuanced analysis of market momentum and overbought or oversold conditions. The DFO's distinctiveness lies in its ability to leverage the strengths of both RSI and Stochastic Oscillator, offering a more robust reading of market conditions. Moreover, it does so by offering a weighted approach, which combines the standardized values of both indicators. This flexibility in adjusting the weight of each component enhances its adaptability to different market scenarios, making it a versatile tool in a trader's arsenal. The following sections will delve into the intricacies of the DFO, demonstrating its advantages, usage, and applicability across various market conditions.
Differences from Existing Scripts:
The Dynamic Fusion Oscillator (DFO) is unique from other trading indicators as it combines the strengths of two popular technical analysis tools: the Relative Strength Index (RSI) and the Stochastic Oscillator. This fusion results in a dynamic, weighted oscillator that provides a more comprehensive view of the market's momentum and overbought or oversold conditions.
Usage and Market Conditions:
DFO can be used across different markets, including stocks, forex, commodities, and cryptocurrencies. It is designed to perform well in varying market conditions - trending or ranging. However, like any other technical indicator, it is advised to use it in conjunction with other technical analysis tools and not rely solely on it for making trading decisions.
Importance of Combining RSI and Stochastic Oscillator:
The RSI and Stochastic Oscillator are both momentum indicators, but they have their individual strengths and weaknesses. The RSI excels at identifying overbought and oversold conditions, while the Stochastic Oscillator is adept at predicting price reversals. By combining these two into a single oscillator, we can benefit from the strengths of both while minimizing their weaknesses. This fusion results in a more robust indicator that offers better signal quality and reliability.
Input Explanations:
RSI Length : This determines the number of periods used to calculate the RSI. A smaller value will make the RSI more sensitive to price changes, while a larger value will smooth out the RSI line.
Stochastic Length, Smooth K, Smooth D : These are parameters for calculating the Stochastic Oscillator. Length is the observation period, Smooth K is the smoothing factor for the %K line, and Smooth D is the smoothing factor for the %D line.
RSI Weight, Stochastic Weight : These determine the weights of the RSI and the Stochastic Oscillator in the final calculation. Increasing the weight of one will make the oscillator more sensitive to that component.
Standardization Length : This is the number of periods used to calculate the moving average and standard deviation for standardization purposes.
MA Length : This determines the number of periods used to calculate the moving average of the oscillator.
Upper Band Value, Lower Band Value : These set the maximum and minimum values for the oscillator. Signals are generated when the oscillator crosses these thresholds.
Number of periods above the band for alert condition : This sets the number of periods the oscillator stays above the band to trigger an alert.
Alert Conditions:
Alerts are generated under the following conditions:
Bullish Signal : An alert is generated when the Moving Average (MA) crosses above the Oscillator. This can be seen as a potential bullish signal indicating an upward price trend.
Bearish Signal : An alert is generated when the MA crosses below the Oscillator. This can be seen as a potential bearish signal indicating a downward price trend.
Oscillator above/below upper/lower band : Alerts are also generated when the oscillator has been above the upper band or below the lower band for a specified number of periods. This could signal overbought or oversold conditions, respectively. These signals can help traders identify potential reversal points in the market.
These alerts can help traders by providing timely signals for potential trading opportunities. However, they should be used as part of a comprehensive trading strategy that also takes into account other technical and fundamental factors.
RSI Exponential Smoothing (Expo)█ Background information
The Relative Strength Index (RSI) and the Exponential Moving Average (EMA) are two popular indicators. Traders use these indicators to understand market trends and predict future price changes. However, traders often wonder which indicator is better: RSI or EMA.
What if these indicators give similar results? To find out, we wanted to study the relationship between RSI and EMA. We focused on a hypothesis: when the RSI goes above 50, it might be similar to the price crossing above a certain length of EMA. Similarly, when the RSI goes below 50, it might be similar to the price crossing below a certain length of EMA.
Our goal was simple: to figure out if there is any connection between RSI and EMA.
Conclusion: Yes, it seems that there is a correlation between RSI and EMA, and this indicator clearly displays that relationship. Read more about the study here:
█ Overview of the indicator
The RSI Exponential Smoothing indicator displays RSI levels with clear overbought and oversold zones, shown as easy-to-understand moving averages, and the RSI 50 line as an EMA. Another excellent feature is the added FIB levels. To activate, open the settings and click on "FIB Bands." These levels act as short-term support and resistance levels which can be used for scalping.
█ Benefits of using this indicator instead of regular RSI
The findings about the Relative Strength Index (RSI) and the Exponential Moving Average (EMA) highlight that both indicators are equally accurate (when it comes to crossings), meaning traders can choose either one without compromising accuracy. This empowers traders to pick the indicator that suits their personal preferences and trading style.
█ How it works
Crossings over/under the value of 50
The EMA line in the indicator acts as the corresponding 50 line in the RSI. When the RSI crosses the value 50 equals when Close crosses the EMA line.
Bouncess from the value 50
In this example, we can see that the EMA line on the chart acts as support/resistance equals when RSI rejects the 50 level.
Overbought and Oversold
The indicator comes with overbought and oversold bands equal when RSI becomes overbought or oversold.
█ How to use
This visual representation helps traders to apply RSI strategies directly on the price chart, potentially making RSI trading easier for traders.
-----------------
Disclaimer
The information contained in my Scripts/Indicators/Ideas/Algos/Systems does not constitute financial advice or a solicitation to buy or sell any securities of any type. I will not accept liability for any loss or damage, including without limitation any loss of profit, which may arise directly or indirectly from the use of or reliance on such information.
All investments involve risk, and the past performance of a security, industry, sector, market, financial product, trading strategy, backtest, or individual's trading does not guarantee future results or returns. Investors are fully responsible for any investment decisions they make. Such decisions should be based solely on an evaluation of their financial circumstances, investment objectives, risk tolerance, and liquidity needs.
My Scripts/Indicators/Ideas/Algos/Systems are only for educational purposes!

DOTS [CHE]This indicator is a must-have for every trader as it provides a practical tool to quickly evaluate the current price of a security. Designed specifically for manual trading, this indicator is based on "The Forbidden RSI " indicator and provides an easy way to identify overbought and oversold conditions in the market. By using this indicator, traders can make informed decisions about when to enter or exit a trade, maximizing their potential profits and minimizing their risks. Its simple yet effective design makes it an ideal choice for traders of all experience levels. Whether you are a seasoned professional or just starting out, this indicator can help you take your trading to the next level.
Description:
This is a Pine Script code designed to create an indicator that identifies overbought and oversold conditions in a security. The code first defines a function named "func" that takes three arguments - "close", "length", and "tr". It then calculates a value "k" based on the "close" and "length" arguments using this function.
The code then checks if "k" is greater than a variable named "OverBought" and assigns the resulting Boolean value to "OverboughtCond". It also checks if "k" is less than a variable named "OverSold" and assigns the resulting Boolean value to "OversoldCond".
The code then plots a small circle above the bar if "OverboughtCond" is true and below the bar if "OversoldCond" is true. The circles are colored green for "Overbought" and red for "Oversold". The code also creates a label with the name "Overbought" above the bar and a label with the name "Oversold" below the bar if the respective conditions are met.
Finally, the code sets up alert conditions for both the "Overbought" and "Oversold" cases, with a custom message that includes the name of the security, the current price, and the indicator's name.
I've tested the script for weeks and I hope it brings you as much success as it did me
best regards
Chervolino

WillyCycle Oscillator&DoubleMa/ErkOzi/version 2This oscillator can be customized by adjusting the length of the Willy period, the length of Willy's EMA, and the upper and lower bands. The upper and lower bands help traders identify overbought and oversold conditions.
The WillyCycle Oscillator is a technical analysis tool used to measure the momentum of an asset and identify overbought and oversold conditions based on the price range of a specific period and calculating the percentage of the closing price in that range. The WillyCycle Oscillator consists of two main components: Willy and Willy's EMA. The Willy component is the percentage calculation of the asset's price range, and Willy's EMA is the exponential moving average of the Willy component. Willy's EMA is used to smooth out the Willy component and make it easier to identify trends.
*** When the oscillator is above the 80 level, it indicates that the asset is overbought, and when it is below the 20 level, it indicates that the asset is oversold. Traders can use these levels as a guide for buying and selling signals.
***Traders can also use the WillyCycle Oscillator to identify trend reversals. When the oscillator rises above the 50 level, it signals a potential uptrend, and when it falls below the 50 level, it signals a potential downtrend.
***I have added a smoothed line option to the WillyCycle Oscillator, which allows traders to see a more smoothed version of the oscillator. This option can be enabled by setting the 'smoothed' input to true. The default value for the smoothed line is 15.
***We have also changed the value range of the WillyCycle Oscillator from -100 to 100 to 0 to 100. This change was made to make the oscillator more user-friendly and easier to read.
In conclusion, the WillyCycle Oscillator is a versatile tool that can help traders identify potential trading opportunities and trend reversals. Traders can customize the oscillator to fit their trading style and preferences. Adding a smoothed line and changing the value range can enhance the user experience and make the oscillator easier to use.

WillyCycle Oscillator&DoubleMa/ErkOzi/"This code creates a technical analysis indicator used to calculate and visualize the WillyCycle oscillator and double moving average indicators on the price of a financial asset. The functionality can be summarized as follows:
*Calculate the WillyCycle oscillator: The WillyCycle is an oscillator calculated based on the highest and lowest values of an asset. This oscillator is used to measure overbought or oversold conditions of the asset.
*Calculate the double moving average: The double moving average helps determine trends by calculating the short-term and long-term moving averages of asset prices.
*Use the WillyCycle oscillator and double moving average indicators together: The WillyCycle oscillator is combined with the double moving averages to provide a clearer indication of overbought and oversold conditions.
*Visualize the indicator with color coding: The indicator is color-coded to show overbought and oversold conditions. Additionally, line and background colors are changed to make the indicator more readable.
Many parameters can be adjusted on the indicator: The indicator can be customized and modified by the user. For example, the period of the WillyCycle oscillator and the lengths of the double moving averages can be adjusted."
The strategy is based on two indicators - the WillyCycle oscillator and the double moving average. The WillyCycle oscillator measures overbought and oversold conditions of the asset based on its highest and lowest values. The double moving average calculates short-term and long-term moving averages of the asset's price, which can help identify trends.
The WillyCycle oscillator and the double moving average are combined in this strategy to provide a clearer indication of overbought and oversold conditions. When the WillyCycle oscillator indicates that the asset is oversold and the short-term moving average crosses above the long-term moving average, it may signal a buy opportunity. Conversely, when the WillyCycle oscillator indicates that the asset is overbought and the short-term moving average crosses below the long-term moving average, it may signal a sell opportunity.
To make it easier for traders to read and interpret the indicator, color-coding is used to indicate overbought and oversold conditions. The user can also customize the indicator by adjusting parameters such as the period of the WillyCycle oscillator and the lengths of the double moving averages.
*ıt provides successful buy and sell signals for price reversals.
*You can open counter trades in overbought and oversold areas by following the averages.

Rainbow Collection - BlueSlopes are an increasingly key concept in Technical Analysis. The most basic type is to calculate them on the prices, but also on technical indicators such as moving averages and the RSI.
In technical analysis, you generally use the RSI to detect imminent reversal moves within a range. In the case of the Blue indicator, we are calculating the slope of the market price and then calculating the RSI of that slope in order to detect instances of reversal.
The Blue indicator is therefore used as follows:
* A bullish signal is generated whenever the 21-period RSI of the 21-period market slope surpasses 30 after having been below it but remains below 35.
*A bearish signal is generated whenever the 21-period RSI of the 21-period market slope breaks 70 after having been above it but remains above 65.
The aim of the Blue indicator is to capture reversals as early as possible through a combination of slopes and entry techniques.

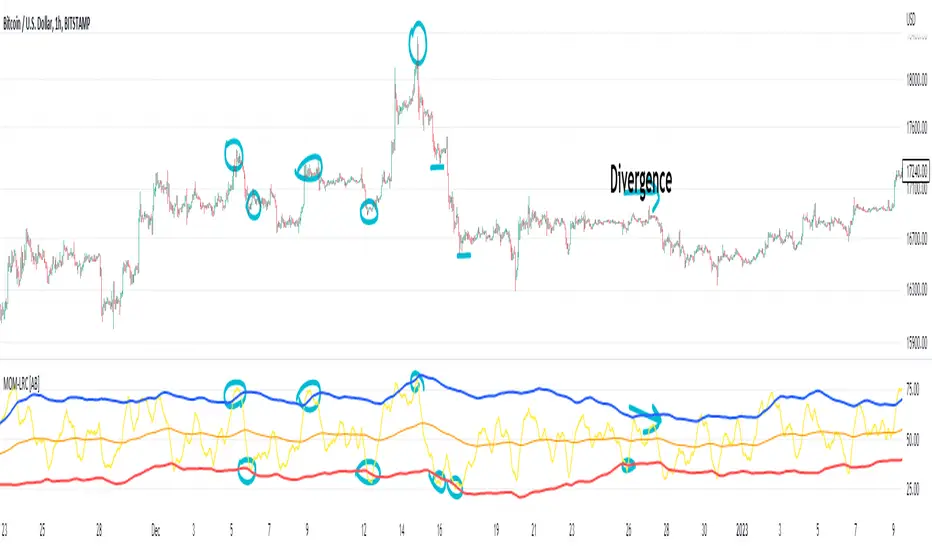
(Very promising) [Abdullah Ahmed] Momentum indicator V.1Description: MOM-LRC is a powerful technical analysis indicator designed to provide traders with signals based on the momentum of an asset's price and its deviation from its mean value. The indicator calculates the exponential RSI and uses a custom function to determine the percentage change from the mean. The upper and lower bands of the momentum channel are then calculated using linear regression of the rate of change from the mean. The channel multiplier can be adjusted to increase or decrease the sensitivity of the indicator.
How to use :
1 - Using MOM-LRC , look for buy signals when the price of the asset is below the lower border of the channel and retracing up. The opposite is true in the case of sell signals.
2 - It is also used in the case of negative and positive divergences, just as you use RSI
The indicator can be used on any time frame and any asset, making it a versatile tool for traders of all levels.
features:
Calculates exponential RSI and percentage change from the mean
Uses linear regression to calculate upper and lower bands of momentum channel
Adjustable channel multiplier for increased sensitivity
Suitable for any time frame and any asset
Happy trading!
Faytterro Oscillatorwhat is Faytterro oscillator?
An oscillator that perfectly identifies overbought and oversold zones.
what it does?
this places the price between 0 and 100 perfectly but with a little delay. To eliminate this delay, it predicts the price to come, and the indicator becomes clearer as the probability of its prediction increases.
how it does it?
This indicator is obtained with "faytterro bands", another indicator I designed. For more information about faytterro bands:
A kind of stochastic function is applied to the faytterro bands indicator, and then another transformation formula that I have designed and explained in detail in the link above is applied. These formulas are also applied again to calculate the prediction parts.
how to use it?
Use this indicator to see past overbought and oversold zones and to see future ones.
The input named source is used to change the source of the indicator.
The length serves to change the signal frequency of the indicator.

Rekt Edge Reversion BandRekt Edge Reversion band is a technical indicator that utilizes a combination of moving averages and standard deviations to determine optimal entry and exit points in the market. By comparing the current price to its moving average, the indicator identifies potential trends and determines how you can position around them by plotting buy/sell signals and two channels based on user input parameters. The user can choose between Simple Moving Average ( SMA ) or Exponential Moving Average ( EMA ) and select the moving average period, the unit of separation, the multiples of the unit, and other important parameters. The indicator's inputs can be adjusted to suit different trading styles, and it can be used on any time frame. The indicator can be used to identify potential trend reversals or breakouts (or breakdowns) when the price moves outside of the channels. The indicators potential use cases include identifying overbought or oversold conditions. With its ability to provide a clear signal on when to enter and exit a trade, this indicator is a popular tool among traders looking to make more informed and profitable trading decisions. This indicator can also be used in conjunction with other technical analysis tools to confirm or invalidate trading signals.

Faytterro Bandswhat is Faytterro Bands?
it is a channel indicator like "Bollinger Bands".
what it does?
creates a channel using standard deviations and means. thus giving users an idea about the expensive and cheap zones. It uses a special weighted moving average different from standard bollinger bands, it also averages not only price but also deviations.
how it does it?
it uses this formulas:
how to use it?
its usage is the same as "bollinger band".
length represents the number of candles to be taken into account, source represents the source of those candles and stdev represents the coefficient of the standard deviation.
you can use it with other indicators:

Stochastic Oversold / Overbought Multi Time Frame on CandleAt the suggestion of a friend, I prepared this educational indicator to show how to use a Multi time frames on the chart based on the color of The Candle.
This Script calculates the stochastic oscillator for multiple timeframes and displays the overbought/oversold signals on the chart with color coding.
The stochastic oscillator is a momentum indicator that compares a security's closing price to its high-low range over a set number of periods. The indicator oscillates between 0 and 100, with readings above 80 considered overbought and readings below 20 considered oversold.
The indicator has the following input parameters:
%K Length: the number of periods used to calculate the stochastic oscillator (default is 14).
%K Smoothing: the number of periods used to smooth the stochastic oscillator (default is 1).
Three timeframes: The timeframes for which the stochastic oscillator is calculated can be set as 15-minute, 1-hour, or 4-hour intervals. For each timeframe, the user can choose to display the indicator (or not) and set the color of the candle. The user can also set the overbought and oversold levels (default is 80 and 20, respectively).
The indicator calculates the stochastic oscillator using the ta.stoch function from the built-in ta library in PineScript. It then uses the ta.sma function to smooth the stochastic oscillator if specified. Finally, the indicator uses the TimeframFuction to calculate the stochastic oscillator for different timeframes, which is then displayed on the chart using the barcolor function. The color of the candle is set based on whether the stochastic oscillator is overbought or oversold, as determined by the overbought/oversold levels specified by the user.
Note: This code is example for you to use multi timeframe in your indicator or Strategy , also prevent Repainting Calculation
