Relative Strength Index 2x maThe relative strength index, represented as two moving averages with periods, one of which will be a multiple of the longer moving average by the amount you set.
The indicator can work both in automatic and manual mode. In automatic mode, the optimal periods are selected, in my opinion, depending on which timeframe is being analyzed at the current moment. In manual mode, you can set the required period yourself.
You can also set the method of smoothing the moving averages yourself and apply them to the opening or closing, the minimum of the bar, etc.
An important point: it is possible to enable/disable graphical functions that may not be required - just check the box next to the function that you want to see on your indicator.
Show ConDiv? - enabling / disabling the convergence/divergence function of the moving averages of the RSI indicator (not to be confused with the MACD for the asset price chart)
Show ma? - enabling/disabling the graphical display of the moving averages of the RSI indicator
Show RSI? - enabling / disabling the standard RSI indicator (if you want to see only it, check the box opposite; in this case, you need to remove the other two checkboxes)
I wish you good luck in building your trading plans, and remember: such indicators do not predict the future price movement on the chart, they only determine the characteristics of the price movement at the current time, taking into account historical data.
Overbought-oversold

RSI+ChannelbandsThis Indicator displays a normal RSI with overbought/-sold lines which is calculated with donchian channels, pivot channel, bollinger bands and three horizontal lines.
You can averaged the channels, bands and h-lines in any combination or you can use just one of them for calculating the overbought/-sold lines.
The midline is colored in default settings in yellow for upptrending and blue for downtrending.

Folded Relative Strength Index [CC]The Folded Relative Strength Index was created by Richard Poster (Stocks and Commodities July 2021 pg 21) and this indicator provides both trend strength but also momentum and of course reversal points using the overbought and oversold markers. If the indicator line is above the mid line then this shows upward momentum and when it falls below the midline then this means it is losing momentum. When the indicator rises above the signal line then this shows upward trend strength and vice versa. Buy when the indicator line turns green and sell when it turns red.
Let me know if there are any other indicators you would like to see me publish!

SuperTrend Oscillator [LuxAlgo]This oscillator is made of three components, all derived from the SuperTrend indicator. This approach allows the user to easily determine overbought/sold zones, identify whether a retracement is present or if the price is ranging or trending. It also allows for the anticipation of the potential price cross with the SuperTrend.
We provide additional information including whether a signal returned by the SuperTrend was false, as well as the percentage of false signals.
Settings
Length: Period of the "average true range" used in the calculation of the SuperTrend
Mult: Multiplicative factor for the "average true range"
Smooth: Determines the degree of smoothing of the histogram
Misc:
Fixed Transparency: Use a fixed transparency for the main oscillator
Show Lines: Show the lines displayed by the indicator
Show Labels: Show the labels displayed by the indicator
Usage
The indicator is in a range of (-100,100) with values closer to 100/-100 indicating a stronger trend. The main oscillator value above 0 indicates that the price is above the SuperTrend.
It is possible to identify when a retracement is present in a trend. This is often indicated by an oscillator value moving within 50/-50.
Each overbought/oversold level can be used to determine potential exit points.
The indicator also includes two additional oscillators derived from the main oscillator. A smoothed version of the main oscillator (Signal), and a smoothed version of the difference between the Main and Signal oscillators (Histogram), thus making the oscillator part of the indicator more similar to MACD.
One can use the histogram to anticipate when the price might cross the SuperTrend by comparing the sign between the main and histogram. Potential false signals can also be filtered with this method.
Certain crosses between the price and SuperTrend can be filtered out when the histogram and main oscillator have a different sign (here main = 1, histogram = -1).
We include various indications in order to analyze the signals returned by the SuperTrend. The indicator displays symbols indicating whether a signal was false or not.
A cross symbol will be displayed at the top of the displayed lines when the previous Buy signal was false, else a checkmark is displayed. Symbols displayed at the bottom of the lines are referring to sell signals. We also provide a percentage of false signals, calculated over the entire chart history.
Details
The scaling method used is similar to max-min normalization. We first compute the difference between the price and SuperTrend and divide the result by the difference between the upper and lower extremity used to compute the SuperTrend. Values higher than (1,-1) can occur when price crosses the SuperTrend and as such we use the max and min functions to attenuate these.
The filter used to compute the signal line is based on exponential averaging and is fully adaptive. The smoothing factor used for its computation is the squared value of the main oscillator, divided by length . Since higher values of the oscillator are associated with trending markets, the filter will be closer to the main oscillator when the market is ranging.

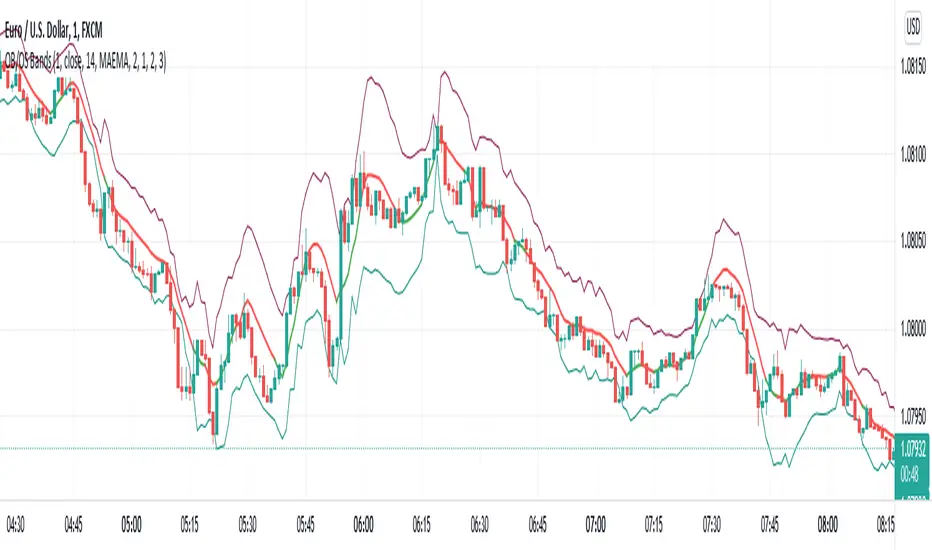
Overbought/Oversold BandsThe basis of this script is my "Hybrid Overbought/Oversold Detector" which uses many different oscillators to confirm overbought/oversold conditions. The main idea is to generate higher and lower bands around the desired moving average using an average of the volatility (ATR) and the standard deviation (StDev), of course by interfering detected overbought/oversold condition.
Simply put, the more the asset become overvalued/undervalued, the tighter the channel would be and every breakout of the bands announces a return back into the channel in near future.
By default, the multiplier of the standard deviation in the indicator settings is set to 2 which means only less than 5% of price actions would appear outside the bands. Also the default multiplier of the ATR is set to 3 which leads to some similar result, but to achieve more strict results setting StDev multiplier to 3 and ATR multiplier to 4 would be useful.
The type of the central moving average could be picked up from 6 different types which are:
- SMA (Simple Moving Average)
- EMA (Exponential Moving Average)
- HMA (Hull Moving Average)
- LSMA (Least Squares Moving Average)
- TMA (Triangular Moving Average)
- MAEMA (My Personalized Momentum Adjusted EMA)
The latter one leads to a useful combination of the channel with the momentum.
Also the script has multi-timeframe features and the user could apply calculations from other time frames to the current chart.
Hope the idea would be helpful!
Dziwne MFI Overlay (with highlight)It is simply your traditional MFI , except that your 50 line became the actual price.
Why and how could it be useful? This indicator helps to spot more easily and efficiently divergences .
You could also use it for trend reversals as you usually do with your 50 line, but I would suggest to set a higher length for the MFI, like 155 or something like that.

CCI Overbought & OversoldThe Commodity Channel Index (CCI) is a momentum-based oscillator used to help determine when an investment vehicle is reaching a condition of being overbought or oversold
Developed by Donald Lambert, this technical indicator assesses price trend direction and strength, allowing traders to determine if they want to enter or exit a trade, refrain from taking a trade, or add to an existing position. In this way, the indicator can be used to provide trade signals when it acts in a certain way.
KEY TAKEAWAYS
The Commodity Channel Index (CCI) is a technical indicator that measures the difference between the current price and the historical average price.
When the CCI is above zero, it indicates the price is above the historic average. Conversely, when the CCI is below zero, the price is below the historic average.
The CCI is an unbounded oscillator, meaning it can go higher or lower indefinitely. For this reason, overbought and oversold levels are typically determined for each individual asset by looking at historical extreme CCI levels where the price reversed from
This script calculates Commodity Channel Index (CCI) value and fills background of price action chart with colors:
Green zone indicates oversold zone where you can enter position
Red zone indicates overbought zone where a positions should be closed

Combo Backtest 123 Overbought/Oversold This is combo strategies for get a cumulative signal.
First strategy
This System was created from the Book "How I Tripled My Money In The
Futures Market" by Ulf Jensen, Page 183. This is reverse type of strategies.
The strategy buys at market, if close price is higher than the previous close
during 2 days and the meaning of 9-days Stochastic Slow Oscillator is lower than 50.
The strategy sells at market, if close price is lower than the previous close price
during 2 days and the meaning of 9-days Stochastic Fast Oscillator is higher than 50.
Second strategy
Simple Overbought/Oversold indicator
WARNING:
- For purpose educate only
- This script to change bars colors.

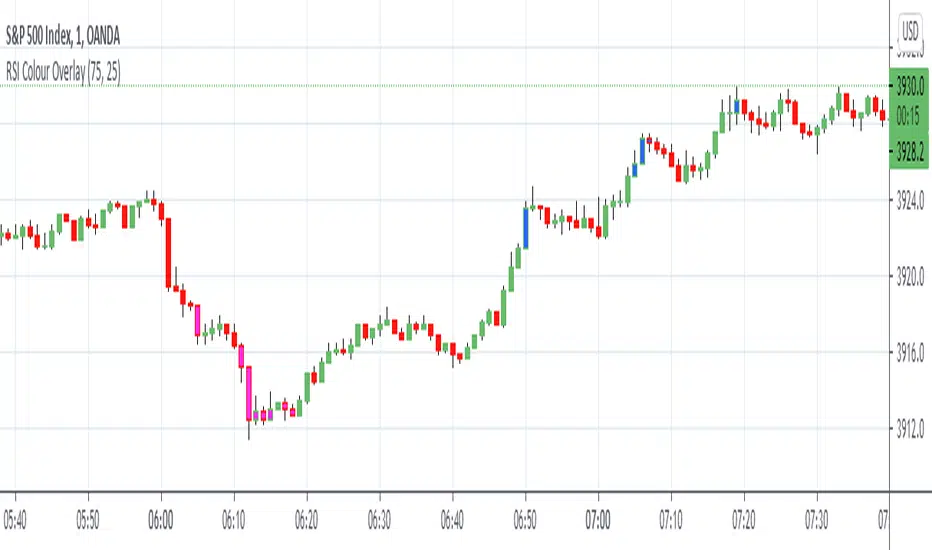
RSI Colour OverlayApplies Blue or Pink colour overlay to candles when RSI is at or over the predefined parameters. These parameters are adjustable in the settings area of the indicator. Please note RSI does not guaranteed a pivot point in price action and the colour overlay should only be used as an indication or condition not a call to buy or sell alone. The colour overlay is a useful prompt to review price action. I hope this helps and good luck with your analysis and trading.
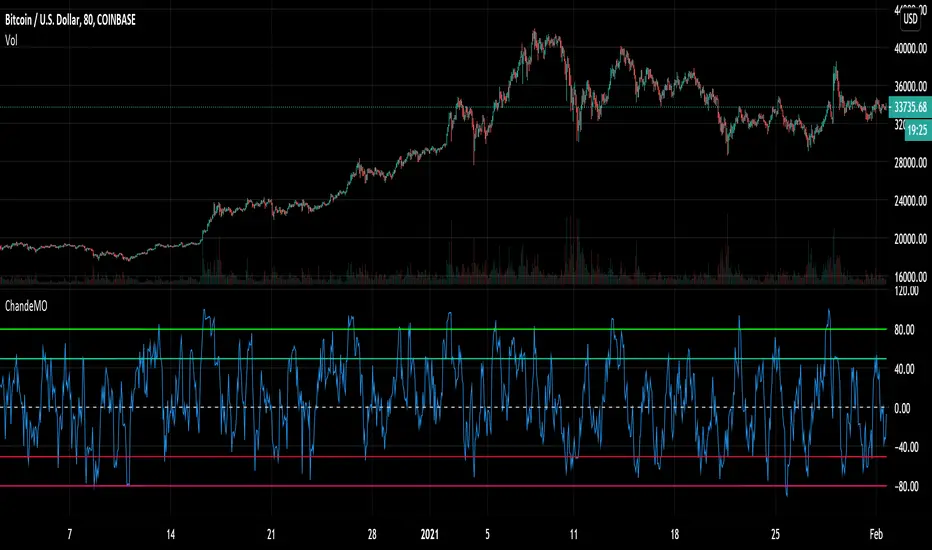
Chande Momentum Oscillator - Alerts and RegionsIt seemed weird to me that the default Chande didn't have overbought and oversold regions, despite them being described for Chande Momentum and working very well. So I added the lines and alert conditions. I've used this to very good results in my day trading.
My strategy involved 4 timeframes of candlestick, each with 4 timeframes of Chande overlaid. Candlesticks are 5 min, 20 min, 80 min, 320 min and Chandes are x1, x2, x4 and x8 of the relevant time zone. Give it a shot. Use the 5 min Chande as Buy and Sell signal with the other timeframes for trend confirmation. You may get a lot of extra alerts with this setup, but it's almost impossible to really miss an opportunity if you use it right. It will take up all your free time though, as a warning. Using this strat made me go crazy.
Use the chande crossing over the lines as the signal, not just being in the region, as that will make you buy early.
Multi-Timeframe Stoch RSIGood evening folks!
Today I want to share with you a simple variant of the Stochastic-RSI built-in indicator.
Nothing too complex: by enabling the relative checkbox and setting the desired (k, d or the RSI ) source and timeframes, you can see higher timeframes data plotted on your screen.
Everything you need to do is enabling the indicator on the lowest timeframe (in this case 15 minutes), then you will see in YELLOW the information retrieved from the next higher timeframe (in this case 30 minutes) and in RED the information retrieved from the highest timeframe (in this case 45 minutes).
IT'S IMPORTANT THAT YOU DISPLAY THE INDICATOR ON THE LOWEST TIMEFRAME!
You can play with the overbought and oversold heights in order to have the best configuration you want (in oversold conditions is suggested to buy while in overbought conditions is suggested to sell)
The higher timeframes data are retrieved avoiding repainting since the method used for taking them is the 10th method described in this PineCoders Article , so, if you want to enable alerts, you SHOULD ignore the disclaimer message related to it without any problem.
Good Trading!

[JRL] Pivot Regression OscillatorIntroducing the Pivot Regression Oscillator. This oscillator uses a similar formula to the Stochastic Oscillator. However, instead of comparing the closing price to the lowest price of a period, it compares the distance between current price and the current pivot point. By basing our oscillator on pivot levels, we incorporate a much more relevant and consequential price point around which to base our comparisons.
The indicator can give reliable overbought and oversold signals, and it plots two exponential moving averages as output, which provides crossover signals that can be used to help time trades.
The Pivot Regression Oscillator can be effective for timing re-entries into a trend and seems to be able to avoid some of the false signals of other indicators.
Let me know if you find this useful. Cheers!

Non-Rescaled RSI█ OVERVIEW
Relative Strength Index is a momentum oscillator developed by J. Wilder. The original version of RSI rescaled the relative strength measurement to range. While the rescaling is useful for readability, This non-rescaled version tells the exact average relative strength of the movement for the past period, and give another way to put the relative strength reading into context of current market condition.
█ Description & How To Use
1. The (+/-) in relative strength value indicates the direction
Example 1: Relative Strength of 2.33 means average gain is 2.33 bigger than average loss for the past period (Equivalent to RSI 70)
Example 2: Relative Strength of -2.33 means average loss is 2.33 bigger than average gain for the past period (Equivalent to RSI 30)
Example 3: Relative Strength of 0 means average gain is equal to average loss for the past period (Equivalent to RSI 50)
Look at comparison below:
2. You can use it exactly how you would use RSI: Overbought/Oversold state, Divergence, Trend identification, Failure Swings etc..
█ Features
- Overbought/Oversold line still maintainable as standard RSI level (70,30) in user input screen. The script will recalculate and plot the ob/os level accordingly
- Value Label to indicate the RSI and RS value
- Custom Gradient Color Scheme
█ Limitation
The Relative Strength absolute value is capped at 20 to avoid ratio value too big(or too small). This is enough to get accurate equivalent of RSI reading between 5-95
█ Disclaimer
Past performance is not an indicator of future results.
My opinions and research are my own and do not constitute financial advice in any way whatsoever.
Nothing published by me constitutes an investment/trading recommendation, nor should any data or Content published by me be relied upon for any investment/trading activities.
I strongly recommends that you perform your own independent research and/or speak with a qualified investment professional before making any financial decisions.

Screener - Mean Reversion Channel█ OVERVIEW
This is Screener script for Mean Reversion Channel Indicator
█ Description & How To Use
The screener works by scanning through up to 40 symbols and list down symbols that are currently within Overbought/Oversold Zone as defined by Mean Reversion Channel indicator.
The Overbought/Oversold Zone are further categorized and sorted by:
Strong : Indicated by "(Strong)" next to the symbol name
Normal : Indicated by the absence of "(Strong)" or "(Weak)" next to the symbol name
Weak : Indicated by "(Weak)" next to the symbol name
Notes: Refer to chart above to see how the Zone are categorized.
Notes: If the screener displays "Nothing Interesting". It simply means none of the screened assets are within the Overbought/Oversold Zone.
█ Features
- Scan up to 40 symbols at a time (By default, no asset is define. Once configured all the symbols you required, remember to save as default to save you from pain of configuring it again in the future)
- Options to scan by zones
- Custom Timeframe
█ Limitation
Due to multiple use of security() function required to call other symbols, expect the screener to be slow at certain times
█ Disclaimer
Past performance is not an indicator of future results.
My opinions and research are my own and do not constitute financial advice in any way whatsoever.
Nothing published by me constitutes an investment recommendation, nor should any data or Content published by me be relied upon for any investment/trading activities.
I strongly recommends that you perform your own independent research and/or speak with a qualified investment professional before making any financial decisions.
Any ideas to further improve this indicator are welcome :)
Credit: QuantNomad for his script idea on custom screener

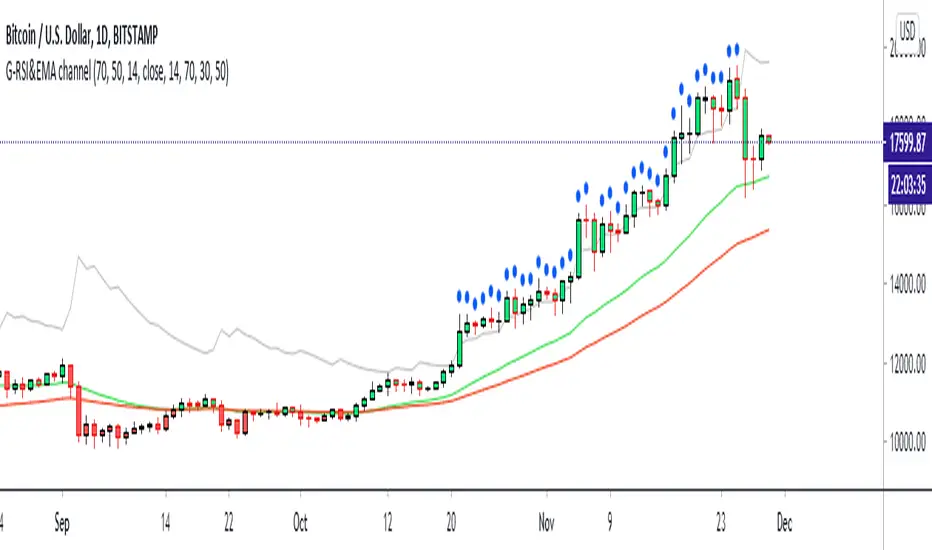
G-RSI&EMA channel v.1This my 2nd indicator : It's just a Strenghtening of trend channal
If price can come up on the green line it's mean price is side way or maybe bullish
and if price can come up on RSI (14)50 and EMA50 it have problaby to bullish trend
If the price have blue ball it's mean crazy strong bullish trend
If the price have red ball it's mean crazy strong bearish trend
you can use my 1st script together : 1st is " G-Bollingerbands Volatility breakout "
My 1st script detect the price begin to have volatility
My 2nd scrit detect the trend
Goodluck :D
PS: My 2nd script develop from someone in tradingview RSI script i'm sorry I can't remember but thank you very much.
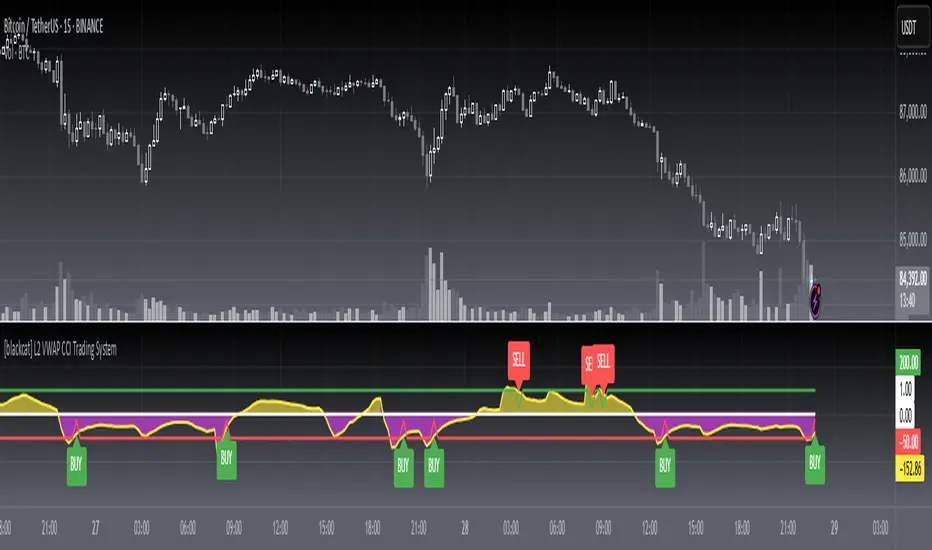
[blackcat] L2 VWAP CCI Trading SystemLevel: 2
Background
Volume-Weighted Average Price (VWAP) is a trading benchmark used by traders that indicates the average price that a security has traded for throughout the day based on volume and price. This is important as it gives traders insight into the trend and value of a security.
The Commodity Channel Index (CCI) indicator was created to identify bullish and bearish market cycles, as well as to define market turning points and the strongest and weakest market periods. CCI was developed for commodities and quickly found application in other markets, including forex.
Function
blackcat L2 VWAP CCI Trading System is an innovative indicator that combines vwap and cci indicator together. Not only long and short entries can be disclosed, but also the overbought and oversold zones are clearly observed.
Key Signal
cci ---> vwap cci indicator output
long --> long entry condition
short --> short entry condition
backtest --> indicator backtest scheme "NLX-L3 Backtest" required input source for strategy backtest
longentry --> visual long entry
shortentry --> visual short entry
Pros and Cons
Pros:
1. exact long and short entries are produced by overbought and oversold conditions
2. support "NLX-L3 Backtest" framework
Cons:
1. noise may be produced under extreme market condition
2. due to this is un-optimized version, time frame and trading pairs need to be selected
Remarks
Courtesy of @nilux "NLX-L3 Backtest" easy backtest framework for dummies.
Step by step backtest guide with "NLX-L3 Backtest" framework:
STEP1: Add this indicator into your chart
STEP2: Add "NLX-L3 Backtest" into your chart
STEP3: Click "Settings" gear icon of "NLX-L3 Backtest" to select "Select L2 Indicator" in the 1st line as "blackcat L2 VWAP CCI Trading System: backtest"
STEP4: Configure your backtest other settings under "NLX-L3 Backtest" framework
STEP5: Click "OK" and view the results in "Strategy Tester" tab
Readme
In real life, I am a prolific inventor. I have successfully applied for more than 60 international and regional patents in the past 12 years. But in the past two years or so, I have tried to transfer my creativity to the development of trading strategies. Tradingview is the ideal platform for me. I am selecting and contributing some of the hundreds of scripts to publish in Tradingview community. Welcome everyone to interact with me to discuss these interesting pine scripts.
The scripts posted are categorized into 5 levels according to my efforts or manhours put into these works.
Level 1 : interesting script snippets or distinctive improvement from classic indicators or strategy. Level 1 scripts can usually appear in more complex indicators as a function module or element.
Level 2 : composite indicator/strategy. By selecting or combining several independent or dependent functions or sub indicators in proper way, the composite script exhibits a resonance phenomenon which can filter out noise or fake trading signal to enhance trading confidence level.
Level 3 : comprehensive indicator/strategy. They are simple trading systems based on my strategies. They are commonly containing several or all of entry signal, close signal, stop loss, take profit, re-entry, risk management, and position sizing techniques. Even some interesting fundamental and mass psychological aspects are incorporated.
Level 4 : script snippets or functions that do not disclose source code. Interesting element that can reveal market laws and work as raw material for indicators and strategies. If you find Level 1~2 scripts are helpful, Level 4 is a private version that took me far more efforts to develop.
Level 5 : indicator/strategy that do not disclose source code. private version of Level 3 script with my accumulated script processing skills or a large number of custom functions. I had a private function library built in past two years. Level 5 scripts use many of them to achieve private trading strategy.
Ehlers Adaptive Commodity Channel Index V1 [CC]The Adaptive Commodity Channel Index V1 was created by John Ehlers (Rocket Science For Traders pgs 236-237) and this is the typical Commodity Channel formula with the introduction of adaptive lengths based on his earlier work with indicators such as the Mother of Adaptive Moving Averages. For longer term signals you would get a bullish signal when CCI is above 0 and a bearish signal when CCI falls below 0. For shorter term signals you would get a bullish signal when crosses over it's overbought level or when it crosses above it's oversold level or vice versa. I have included both signals to make it easier.
Let me know if you want a custom script written or if you have a special request for me

dirt cheap yet elegant RSI StrategyFor Educational Purposes. Results can differ on different markets and can fail at any time. Profit is not guaranteed.
This only works in a few markets and in certain situations. Changing the settings can give better or worse results for other markets. This is a good way to show off a good looking strategy, atleast in paper, with minimal effort involved in the making and usage. It can be made with the most minimal lines of code if needed to bring shame unto others. It only works in a few markets and who knows if it will actually rebound from the overbought or oversold levels but in case it doesn't I put in a time-based stop to exit in case of that worst case scenario. There's not much to it, good for trolling others, or serious business, you decide.
RSI TrendsRSI is a momentum indicator, however most people seem to be using it to go against the momentum by trying to identify tops/bottoms using it. Its in my opinion the wrong way to be using it. It can be easily used for trend following which seems like a better use for it.
Uptrend - RSI > 60
Downtrend - RSI < 40
Sideways - RSI between 40 and 60
If however not interested in filtering for sideways trends and convert it to a long-short only strategy that stays in market all the time then it can be simply modified by setting both overbought/oversold thresholds to 50. In such a case uptrend will be above 50 and downtrend will be less than 50.
Note: wait for close for current bar to be confirmed as RSI is calculated at close

MTF Stoch RSI ScreenerDisplays when multiple timeframes of Stochastic RSI are overbought/oversold. Multiple consecutive timeframes being overbought/oversold can signify a short term top or bottom.
Thanks to Micse in Pinescripters telegram who helped remove a few errors from this.

Percentage Price Over SMAReturn the percentage of closing prices greater than SMA's with periods within a user-selected range. An exponential moving average applied to these results is also displayed (in orange).
Settings
Min : Minimum period of the SMA in the range
Max : Maximum period of the SMA in the range
Smooth : Period of the EMA
Src : Input series of the indicator
Usage
The indicator is a normalized oscillator. A value of 100 indicates that 100% of the current closing price is over SMA's with periods ranging from min to max , this indicates a bullish market, while a value of 0 would indicate a bearish market.
In this image the indicator use min = 50 and max = 200, here AMD has been strongly bullish at the start, and ended being strongly bearish at the end, during this bullish period the indicator is over its overbought level, while it is under its oversold level during the bearish period.
In case the market is ranging we can expect the indicator to be around 50%, using the smoothed result might be more useful to detect ranging markets with this indicator.
If the smoothed result is within the overbought/oversold levels, then we can say that the market is either ranging or transitioning from a bullish/bearish market to an opposite one.

Hybrid Overbought/Oversold Detector + Put/Call SignalsThere are many indicators of overbought/oversold conditions out there. Some of more common ones are:
- Bollinger Bands %B
- Money Flow Index (MFI)
- Relative Strength Index (RSI)
- Stochastic
This script uses a combination of these 4 oscillators to confirm overbought/oversold and filter the signals of market reverse which could be used for trading binary options.
You may select which oscillators you want to apply and of course change the source, the length of the calculations and the overbought/oversold levels.
Also the script will draw a combined graph which is the average of the selected oscillators in the options.
Send me your ideas!

RSI Call-outs [BigBitsIO]This is a simple RSI indicator that overlays the current chart to show labels for specified oversold and overbought areas defined with inputs.
It will delete any labels of the same kind within the last 3 candles so you don't see as many labels as you would otherwise.
Red labels with white text represent overbought RSI levels as defined by the user.
Green labels with black test represent oversold RSI levels as defined by the user.
This RSI overlay help easily call-out overbought and oversold candles on a chart without sacrificing screen space for a traditional RSI indicator that is not overlayed on the chart.
