WillyCycle Oscillator&DoubleMa/ErkOzi/"This code creates a technical analysis indicator used to calculate and visualize the WillyCycle oscillator and double moving average indicators on the price of a financial asset. The functionality can be summarized as follows:
*Calculate the WillyCycle oscillator: The WillyCycle is an oscillator calculated based on the highest and lowest values of an asset. This oscillator is used to measure overbought or oversold conditions of the asset.
*Calculate the double moving average: The double moving average helps determine trends by calculating the short-term and long-term moving averages of asset prices.
*Use the WillyCycle oscillator and double moving average indicators together: The WillyCycle oscillator is combined with the double moving averages to provide a clearer indication of overbought and oversold conditions.
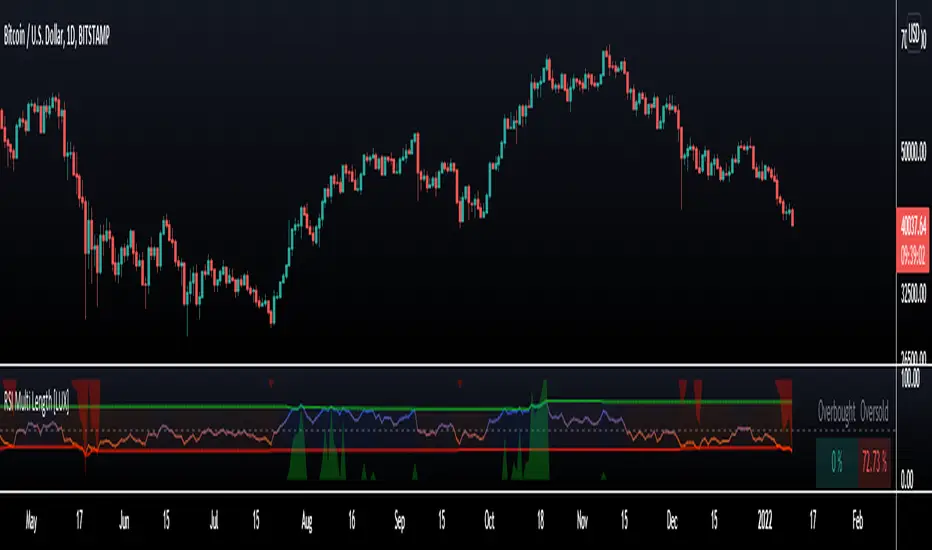
*Visualize the indicator with color coding: The indicator is color-coded to show overbought and oversold conditions. Additionally, line and background colors are changed to make the indicator more readable.
Many parameters can be adjusted on the indicator: The indicator can be customized and modified by the user. For example, the period of the WillyCycle oscillator and the lengths of the double moving averages can be adjusted."
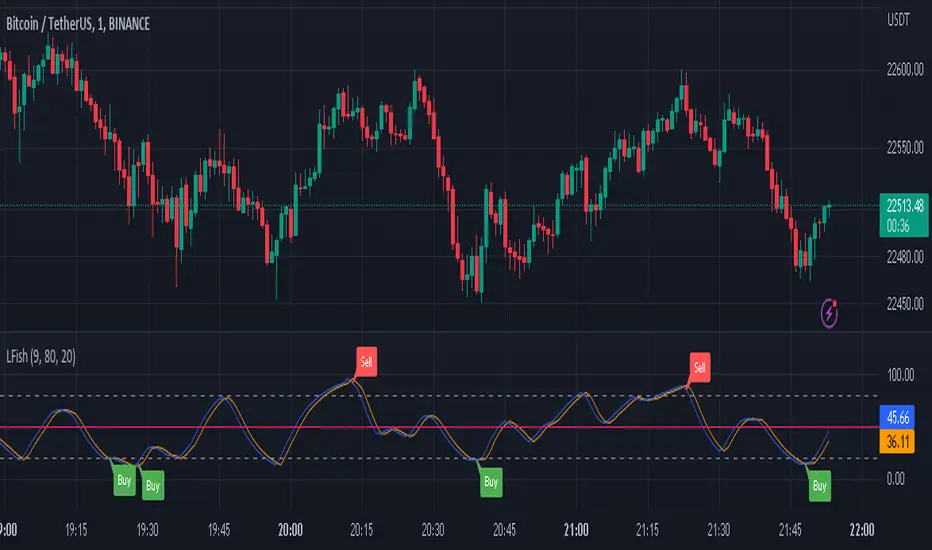
The strategy is based on two indicators - the WillyCycle oscillator and the double moving average. The WillyCycle oscillator measures overbought and oversold conditions of the asset based on its highest and lowest values. The double moving average calculates short-term and long-term moving averages of the asset's price, which can help identify trends.
The WillyCycle oscillator and the double moving average are combined in this strategy to provide a clearer indication of overbought and oversold conditions. When the WillyCycle oscillator indicates that the asset is oversold and the short-term moving average crosses above the long-term moving average, it may signal a buy opportunity. Conversely, when the WillyCycle oscillator indicates that the asset is overbought and the short-term moving average crosses below the long-term moving average, it may signal a sell opportunity.
To make it easier for traders to read and interpret the indicator, color-coding is used to indicate overbought and oversold conditions. The user can also customize the indicator by adjusting parameters such as the period of the WillyCycle oscillator and the lengths of the double moving averages.
*ıt provides successful buy and sell signals for price reversals.
*You can open counter trades in overbought and oversold areas by following the averages.
Wskaźnik Pine Script®