Apex Wallet - Opening Range Breakout (ORB) & Session LevelsOverview The Apex Wallet Opening Range Breakout (ORB) is a professional intraday tool designed to capture the volatility of the first minutes of the trading session. By defining a clear range at the market open, this indicator provides traders with high-probability breakout levels and psychological targets based on mathematical extensions of the initial move.
Core Mechanics
Customizable Session: Easily define your preferred opening range duration (e.g., first 5, 15, or 30 minutes) and session start time.
Dynamic Timezone Adjustment: Includes a built-in UTC offset feature to ensure session times align perfectly with your local market, regardless of where you are trading from.
Automated Level Tracking: The script automatically identifies and locks the high and low of the specified opening period.
Key Features:
Psychological Mid-Lines: Calculates the 50% median of the range (ORB Mid) as a pivot point for trend strength.
Advanced Volatility Extensions: Plots internal and external targets (High+Mid, Low+Mid) to identify potential exhaustion zones or secondary breakout levels.
Intraday Optimization: Designed specifically for low-timeframe traders (1m to 15m) looking for clear execution zones at the bell.
How to use: Wait for the opening range to be established. A breakout above the ORB High often indicates bullish dominance, while a break below the ORB Low suggests bearish momentum. Use the internal extension lines as take-profit targets or areas to move your stop-loss to breakeven.
Orb

ORB + Key Session Levels (QC)Overview
A comprehensive session-based levels indicator that plots Opening Range Breakout (ORB) levels alongside key session highs and lows from Asian, London, and New York trading sessions.
Features
• Opening Range Breakout (ORB) with configurable duration (5m/15m/30m/1hr/custom)
• Previous Day High/Low with two modes: RTH Only (9:30-4:00 ET) or Full Session (6pm-5pm ET for futures)
• Asian, London, NY AM, and NY PM session levels
• Kill Zones mode (non-overlapping) vs Full Sessions mode
• Fair Value Gap detection with optional mitigation removal
• HTF Bias dashboard showing market structure
• Lines extend from the exact candle where highs/lows occurred
• Alerts for all level breaks
Kill Zone Defaults (ET)
• Asian: 8:00 PM - 12:00 AM
• London: 2:00 AM - 5:00 AM
• NY AM: 8:30 AM - 11:00 AM
• NY PM: 1:30 PM - 4:00 PM
How To Use
1. Select Session Mode (Kill Zones or Full Sessions)
2. Choose PDH/PDL Source (RTH for equities, Full Session for futures)
3. Customize session times as needed
4. Set up alerts for level breaks
All times are in Eastern Time (ET) and fully customizable.
This indicator is for educational purposes only. Not financial advice.

ORB (x2) by jaXn# ORB (x2) Professional Suite
## 🚀 Unleash the Power of Precision Range Trading
**ORB (x2)** isn't just another breakout indicator—it is a complete **Opening Range Breakout workspace** designed for professional traders who demand flexibility, precision, and chart cleanliness.
Whether you are trading Indices, Forex, or Commodities, the Opening Range is often the most critical level of the day. This suite allows you to master these levels by tracking **two independent ranges** simultaneously, giving you a distinctive edge.
## 🔥 Why choose ORB (x2)?
Most indicators force you to choose one specific time. **ORB (x2)** breaks these limits.
### 🌎 1. Multi-Session Mastery (London & New York)
Trade the world's biggest liquidity pools. Set **ORB 1** for the **London Open** (e.g., 03:00–03:05 EST) and **ORB 2** for the **New York Open** (09:30–09:35 EST). Watch how price reacts to London levels later in the New York session.
### ⏱️ 2. Multi-Strategy Stacking (The "Fractal" Approach)
This is a game-changer for intraday setups. Instead of two different times, track **two different durations** for the *same* open.
* **Setup:** Configure **ORB 1** as the classic **5-minute range** (09:30–09:35).
* **Setup:** Configure **ORB 2** as the statistically significant **15-minute or 30-minute range** (09:30–10:00).
* **Result:** You now see immediate scalping levels *and* major trend reversals levels on the same chart, automatically.
### 🎯 3. "Plot Until" Tech: Keep Your Chart Clean
Sick of lines extending infinitely into the void?
Our exclusive **"Plot Until"** feature separates the signal from the noise. You define exactly when the trade idea invalidates.
* *Example:* Plot the 09:30 levels only until 12:00 (Lunch).
* The script intelligently cuts the lines off at your exact minute, ensuring your chart is ready for the afternoon session without morning clutter.
### ⚡ Precision Engine
We use a dedicated "Precision Timeframe" input. Even if you are viewing a 1-hour or 4-hour chart to see the big picture, ORB (x2) can fetch data from the **1-minute** timeframe to calculate the *exact* high and low of the opening range. No more "repainting" or guessing where the wick was.
## 🛠 Feature Breakdown
* **Dual Independent Engines:** Fully separate Color, Style, Time, and Cutoff settings for both ORB 1 and ORB 2.
* **Absolute Time Cutoff:** Lines obey day boundaries perfectly. A cutoff at 16:00 means 16:00, not "whenever the next bar closes".
* **Style Control:** Visually distinguish between your "Scalp" ORB (e.g., Dotted Lines) and your "Trend" ORB (e.g., Solid Thick Lines).
* **Performance Mode:** Adjustable "Lookback Days" limits history to keep your chart lightning fast.
## 💡 Configuration Examples
**The "Double Barrel" (Standard Stock + Futures)**
* *ORB 1:* `0930-0935` (5 min) - The immediate reaction.
* *ORB 2:* `0930-1000` (30 min) - The institutional trend setter.
**The "Transatlantic" (Forex/Indices)**
* *ORB 1:* `0800-0805` (London Open) - European liquidity.
* *ORB 2:* `1330-1335` (NY Open) - US liquidity injection.
## ⚠️ Disclaimer
Trading involves substantial risk. This tool helps visualize critical price levels but does not guarantee profits. Always combine with proper risk management and your own analysis.

Opening Range {basic}Introduction
Opening range {basic} is a clean and reliable indicator designed to help traders visualize the opening range of a trading session with minimal setup and visual clutter.
This version focuses on the core components of opening range analysis, making it ideal for traders who want a simple, effective framework for identifying early-session structure across futures, forex and crypto markets.
Description
The indicator automatically calculates the opening range high, low and midpoint over a user-defined opening window (5m, 15m, 30m or 60m) within a selected trading session (default: NY session).
During the opening range window, the indicator dynamically tracks price to form the range. Once the opening range is complete, the high, low and midpoint are extended forward for the remainder of the session, providing clear reference levels that can be used for bias, mean reversion or breakout-based decision making.
A shaded fill highlights the opening range area, with an optional size display showing the total range in price units. Styling and logic are intentionally simplified to keep the chart clean and easy to interpret.
Features
Configurable opening range length
Choose between 5m, 15m, 30m or 60m opening ranges.
Session-based calculation
Opening range is calculated only within the selected trading session.
Opening range levels
Opening range high, low and midpoint.
Range fill & size display
Shaded fill between the opening range high and low.
Text showing total opening range size.
Clean, minimal design
Fixed line styles and thickness for clarity.
Dark and light theme support.
Minimal settings for fast, intuitive use.
Optimized performance
Designed for intraday timeframes compatible with the selected opening range length.
Terms & Conditions
This indicator is provided for educational and informational purposes only and does not constitute financial advice.
Trading involves risk and past performance is not indicative of future results.
The user assumes full responsibility for any trading decisions made using this indicator.

NeuraEdge ORB - Opening Range Breakout IndicatorOVERVIEW
NeuraEdge ORB is an open-source Opening Range Breakout indicator that automates the classic 15-minute ORB strategy. The indicator tracks the first 15 minutes of market action (9:30-9:45 AM ET), identifies breakouts above or below this range, and generates trading signals with automated stop loss and take profit calculations.
The Opening Range Breakout concept is based on the observation that the initial price action after market open often establishes directional bias for the trading session, as institutional order flow and overnight gap reactions manifest during this window.
CORE METHODOLOGY
Opening Range Construction:
The indicator uses session-based time detection to identify the 9:30-9:45 AM Eastern Time window. During this period, it tracks the highest high and lowest low to establish the opening range boundaries. The range is marked complete when the 15-minute window closes.
Calculation process:
OR High = Maximum high value during the 15-minute window
OR Low = Minimum low value during the 15-minute window
OR Midpoint = (OR High + OR Low) / 2
Range Size = OR High - OR Low (compared to 14-period ATR for context)
Breakout Detection:
The indicator identifies breakouts using close-price confirmation to reduce false signals from wicks:
Bullish breakout: Close above OR High (with previous close at or below OR High)
Bearish breakout: Close below OR Low (with previous close at or above OR Low)
The indicator tracks whether each direction has already broken to prevent duplicate signals on the same range.
Entry Type Logic:
Two entry methodologies are supported:
Breakout Mode - Signals immediately upon range break. Enters on the breakout bar when close confirms direction.
Retest Mode - Waits for price to break the range, then pullback to touch the range level before entering. Cancels if price moves too far beyond midpoint. This provides better entry prices with tighter stop losses.
Volume Confirmation:
Optional volume filter compares current bar volume to 20-period simple moving average. Requires volume > 1.2x average to validate breakout strength and filter low-conviction moves.
Fair Value Gap (FVG) Integration:
Optional confluence filter that checks for unfilled FVG in the breakout direction:
Bullish FVG detected when: current bar's low > two bars ago high (creating gap)
Bearish FVG detected when: current bar's high < two bars ago low (creating gap)
Minimum FVG size: 0.3x ATR to filter noise
FVG considered filled when price retraces to gap midpoint
Signals only generate when an unfilled FVG exists in the breakout direction, adding institutional order flow confluence.
Risk Management Calculations:
Three stop loss placement methods:
Opposite Side - SL at opposite end of opening range (classic ORB approach)
Midpoint - SL at range midpoint (tighter risk, lower reward potential)
ATR Based - SL at 1.5x ATR from entry (adaptive to volatility)
Take profit calculated as: Entry ± (Entry - Stop Loss) × Risk:Reward Ratio
Default 1.5:1 R:R ratio, adjustable from 1.0 to 5.0.
Performance Tracking:
The indicator maintains a trade history using Pine Script's type system:
Records entry price, stop loss, take profit, and direction for each signal
Tracks outcome when price hits stop loss or take profit levels
Auto-closes after 80 bars if neither level hit
Calculates rolling win rate from last 50 trades maximum
Displays W/L record in real-time dashboard
VISUAL COMPONENTS
Opening Range Box:
Semi-transparent blue box drawn from range start bar to current bar + 20, showing the established range boundaries visually.
Range Levels:
Green line at OR High (potential long entry level)
Red line at OR Low (potential short entry level)
Gray dotted line at OR Midpoint (reference level)
All lines extend 50 bars forward for anticipation.
Trade Signals:
Green up arrow with "LONG ORB Break" label below price
Red down arrow with "SHORT ORB Break" label above price
Dashed lines showing SL and TP levels extending 30 bars
Small labels marking SL and TP endpoints
Real-Time Dashboard:
Top-right panel displaying:
OR formation status (Forming / Complete / Waiting)
Current OR High, Low, and Range size (with ATR multiple)
Breakout status (Long / Short / None)
Volume status (High / Normal)
FVG presence (Bull / Bear / None)
Entry settings (Breakout/Retest, R:R, SL type)
Win rate percentage and W/L record
PRACTICAL APPLICATION
Ideal Market Conditions:
Liquid instruments: SPY, QQQ, IWM, high-volume stocks
Recommended timeframes: 1-minute or 5-minute charts for precise entries
Most effective during trending days with clear directional bias
Range size between 0.5-1.5x ATR typically provides best risk:reward
Usage Workflow:
Apply indicator at market open (9:30 AM ET)
Observe range formation during first 15 minutes
Wait for "Complete" status in dashboard
Monitor for breakout signals with volume/FVG confirmation
Enter on signal, place stop loss and take profit as marked
Avoid taking opposing signals on same day (trend following approach)
Retest vs Breakout Selection:
Use Breakout mode on high-momentum days with strong overnight gaps
Use Retest mode on slower days or when seeking better entry prices
Retest mode reduces signal frequency but improves entry quality
Time-of-Day Considerations:
The indicator includes a trading cutoff setting (default 3:00 PM ET) to avoid late-day chop and reduced liquidity. First-hour breakouts (10:00-11:00 AM) historically show strongest follow-through.
SETTINGS & CUSTOMIZATION
Display Options:
Toggle signals, opening range box, and dashboard independently
Clean visual design to reduce chart clutter
Opening Range Settings:
Opening range duration (5-60 minutes in 5-minute increments)
Default 15 minutes aligns with classic ORB methodology
Trading cutoff hour (10-16, representing 10:00 AM - 4:00 PM ET)
Entry Configuration:
Entry type (Breakout / Retest)
Volume confirmation toggle (requires 1.2x average volume)
FVG confluence toggle (requires unfilled gap in breakout direction)
Risk Management:
Stop loss placement (Opposite Side / Midpoint / ATR Based)
Risk:reward ratio (1.0 - 5.0, default 1.5)
Future: Trail stop after partial TP (currently placeholder)
Alert System:
Five alert conditions available:
Opening Range Complete
ORB Long Signal
ORB Short Signal
Breakout Up (range broken, regardless of signal)
Breakout Down (range broken, regardless of signal)
BEST PRACTICES
Recommended Usage:
Focus on highly liquid instruments with tight spreads
Use 1-5 minute charts for entry precision
Respect calculated stop losses (range defines maximum risk)
Typically 1-2 quality setups per day maximum
Consider overall market trend (SPY/QQQ direction)
Risk Considerations:
Very small ranges (< 0.3x ATR) prone to false breakouts
Very large ranges (> 2x ATR) may indicate gap day requiring adjusted expectations
Low volume breakouts fail more frequently
Avoid trading both directions on same day (pick strongest setup)
IMPORTANT DISCLOSURES
This indicator is provided free and open-source for educational purposes. The Opening Range Breakout strategy is a well-documented public domain trading concept. This implementation adds automation, visual clarity, and optional confluence filters.
No indicator guarantees profitable trades. Past performance does not predict future results. Traders are responsible for their own trading decisions and risk management. Always use appropriate position sizing and never risk more than you can afford to lose.

ORB | Feng FuturesThe ORB | Feng Futures indicator automatically detects the Opening Range Breakout (ORB) for each trading session, plotting the High, Low, and Midline in real time. This tool is built for futures traders who rely on ORB structure to confirm trends, identify breakout zones, and recognize reversal areas early in the session.
Features:
• Auto-calculated ORB High, Low, and Midline
• Multi-timezone session support (NY, Chicago, London, Tokyo, etc.)
• Customize ORB time range and time window for display
• Real-time updating lines that freeze at session close
• Optional labels with customizable size, color, and offset
• Save and view multiple previous ORB sessions
• Full color customization for all levels
• Automatically hides on higher timeframes (Daily+) to reduce clutter
• Works on ES, NQ, and all intraday futures charts
• Works on stocks, crypto, forex, and other tradeable assets where ORB is applicable
Disclaimer: This indicator is for educational purposes only and does not constitute financial advice. Trading futures involves significant risk and may not be suitable for all investors. Always do your own research and use proper risk management.

ORB Session BreakoutORB Session Breakout
Overview
The ORB Session Breakout indicator automatically identifies Opening Range Breakouts across multiple trading sessions (Asia, London, and New York) and provides visual trade setups with entry, stop loss, and take profit levels.
Opening Range Breakout (ORB) is a classic trading strategy that captures momentum when price breaks out of an initial trading range established at the start of a session. This indicator automates the entire process - from detecting the opening range to plotting trade setups when breakouts occur.
🎯 Key Features
Multi-Session Support
Asia Session - Captures the Asian market open (default: 19:00-19:15 NY time)
London Session - Captures the London market open (default: 03:00-03:15 NY time)
New York Session - Captures the NY market open (default: 09:30-09:45 NY time)
Each session is fully customizable with independent time windows and colors
Enable/disable individual sessions based on your trading preferences
Automatic Trade Visualization
Entry Level - Marked at the breakout candle close
Stop Loss Zone - Configurable as ORB High/Low or Breakout Candle High/Low
Take Profit Zone - Calculated automatically based on your Risk:Reward ratio
Visual zones make it easy to see risk/reward at a glance
Smart Breakout Detection
Detects breakouts on the exact candle that closes beyond the ORB range
Supports direction changes - if price breaks one way then reverses, a new trade is signaled
Configurable max breakouts per session (1-4) to control trade frequency
Tracking hours setting limits how long after the ORB to look for entries
Futures Compatible
Special detection logic for futures markets where session times may fall during market close
Works reliably on instruments with non-standard trading hours
📊 How It Works
Opening Range Formation
At the start of each enabled session, the indicator tracks the high and low of the first candle(s)
This range becomes your ORB box (displayed in the session color)
Breakout Detection
When a candle closes above the ORB High → LONG signal
When a candle closes below the ORB Low → SHORT signal
The breakout candle is highlighted in yellow (customizable)
Trade Setup Visualization
Entry line drawn at the breakout candle's close price
Stop Loss placed at ORB Low (longs) or ORB High (shorts) - or breakout candle extreme
Take Profit calculated as: Entry + (Risk × R:R Ratio) for longs
Direction Changes
If you're in a LONG and price closes below the ORB Low, the indicator signals a SHORT
This counts as your 2nd breakout (configurable up to 4 per session)
💡 Trading Tips
Best Practices
Wait for candle close - The indicator only signals on confirmed closes beyond the ORB, reducing false breakouts
Use with trend - ORB breakouts work best when aligned with the higher timeframe trend
Respect the levels - The ORB High/Low often act as support/resistance throughout the session
Monitor multiple sessions - Sometimes the best setups come from Asia or London, not just NY
Recommended Settings by Style
Conservative: Max Breakouts = 1, R:R = 2.0+, SL Mode = ORB Level
Aggressive: Max Breakouts = 3-4, R:R = 1.5, SL Mode = Breakout Candle
Scalping: Shorter tracking hours (1-2), tighter R:R (1.0-1.5)
What to Avoid
Trading ORB breakouts during major news events (high volatility can cause whipsaws)
Taking every signal without considering market context
Using on timeframes higher than 1 hour (the ORB concept works best intraday)
🔔 Alerts
The indicator includes built-in alerts for:
Entry Signal - When a breakout is detected (LONG or SHORT)
Take Profit Hit - When price reaches the TP level
Stop Loss Hit - When price reaches the SL level
To set up alerts: Right-click on the chart → Add Alert → Select "ORB Session Breakout"
📝 Notes
This indicator is designed for intraday trading on timeframes up to 1 hour
Session times are based on the selected timezone (default: America/New_York)
The indicator works on all markets including Forex, Futures, Stocks, and Crypto
For futures with non-standard hours, the indicator includes special detection logic

ORB W/ Custom time FramesRelease Notes: Simplified ORB (Opening Range Breakout)
This indicator is a streamlined, high-performance tool designed to identify the Opening Range—one of the most widely used concepts by professional floor traders and institutional scalpers. It marks the high, low, and midpoint of the initial balance of the market, providing you with a "map" for the rest of the trading session.
Key Features
Customizable Timeframes: Define your opening range window (e.g., the first 5, 15, or 30 minutes) regardless of what timeframe you are currently viewing.
Custom Session Support: Choose between standard market hours (09:30–16:00) or define your own custom window (e.g., the London Open or the first hour of "Power Hour").
Real-Time Midpoint Calculation: Automatically plots the 50% Equilibrium level between the high and low, serving as a pivot point for intraday bias.
Dynamic Updating: During the ORB window, the lines adjust in real-time as new highs or lows are set. Once the window expires, the levels lock in place to act as support and resistance.
Clean Visuals: Utilizes a lightweight line drawing system that is easy on your GPU and keeps the chart clutter-free.
Why This is Essential for Scalping
Scalpers rely on volatility and clear "lines in the sand." The Opening Range Breakout (ORB) provides exactly that:
The "Opening Drive": If price breaks the ORB High with high volume, scalpers look for quick "long" momentum plays. Conversely, a break below the ORB Low signals a bearish trend.
The Midpoint Pivot: The 50% level (Mid) is often treated as the "Fair Value" of the morning. If price is above the mid, the bias is bullish; if below, the bias is bearish.
Stop Loss / Take Profit Anchor: The ORB High and Low act as natural areas for placing stops or targets. A failed breakout that returns inside the range often targets the opposite side of the box.

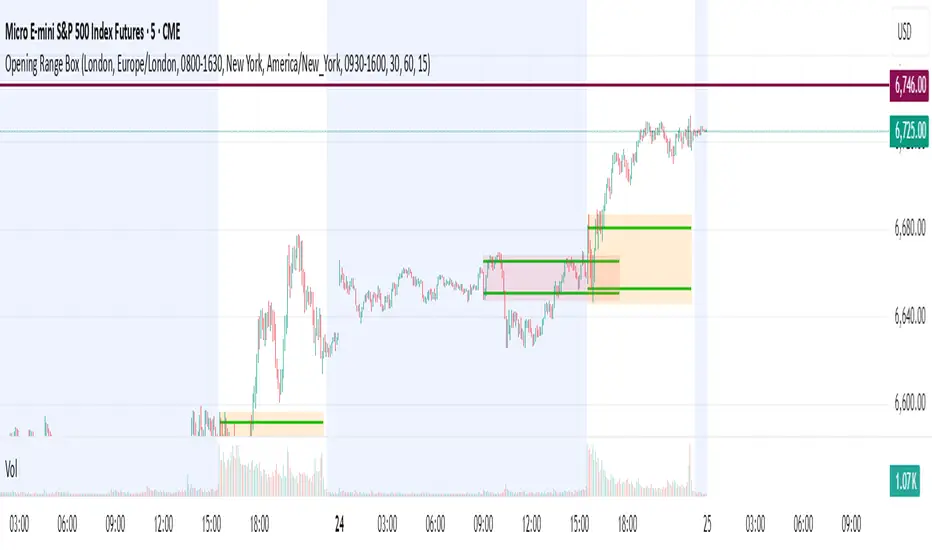
Opening Range BoxOPENING RANGE BOX + LEVELS (RTH)
OVERVIEW
This indicator draws the Opening Range for the U.S. Regular Trading Hours session starting at 9:30 AM New York time. It plots the Opening Range High, Low, and Midpoint, and can extend those levels for the rest of the session. It also displays the Opening Range size in points and ticks.
WHAT IT DRAWS
• Opening Range box for the first N minutes of RTH (ex: 5, 10, 15)
• OR High (ORH)
• OR Low (ORL)
• OR Midline (midpoint of ORH/ORL)
• Opening Range value label (range in points + ticks)
KEY FEATURES
• Time-anchored drawings (bar_time) so levels stay accurate on any intraday timeframe
• Configurable Opening Range length in minutes
• Configurable box fill/border colors
• Independent styling for OR High / OR Low / Midline (color, width, line style)
• Line extension modes:
Line extension modes
- To RTH Close
- Right Forever
- For N Minutes
- None
Optional label placement to the LEFT of the Opening Range so it doesn’t block new candles
Option to keep previous sessions’ Opening Ranges visible for context
BEST FOR
• Futures: ES / NQ / MNQ (and other RTH-based products)
• Intraday stocks and ETFs
• OR breakout, rejection/fade, and mean reversion workflows
NOTES
• Intended for intraday charts
• Opening Range is calculated strictly inside the selected time window (no extra bars)
• Session is America/New_York, 09:30–16:00

Opening Range candle percent of ATRIt takes the opening range of the first candle - 5, 10, 15 or whatever minute - and finds what percent of the ATR that is. So if the opening candle high is 15 and low is 14, its range is 1. If the ATR (daily or whatever you want) is 2, then the opening candle's range is 50% of the ATR.
The percentage is displayed on right in a blue box.
The indicator is used in reversal strategies, since opening candles that eat up a large amount of the daily ATR have a higher probability of reversing.
Indicator made with ChatGPT.

SNIPER ORB V4SNIPER ORB V4
### What It Does
Draws 5/15/30 minute Opening Range Breakout levels with confirmation patterns.
### Session Times
| Session | Hours (ET) |
|---------|------------|
| London | 3:00 - 9:30 |
| New York | 9:30 - 17:00 |
### Levels Drawn
| Level | Color Default | Purpose |
|-------|---------------|---------|
| 5m ORB H/L | Blue | Scalp levels |
| 15m ORB H/L | Cyan | Swing levels |
| 30m ORB H/L | Purple | **Primary levels** |
| Targets 1x-3x | Green/Red | Profit targets |
### Signals
| Signal | Meaning | Priority |
|--------|---------|----------|
| `ORB↑` | Confirmed breakout up | ⭐⭐ |
| `ORB↓` | Confirmed breakout down | ⭐⭐ |
| `RT↑` | Retest long entry | ⭐⭐⭐ **BEST** |
| `RT↓` | Retest short entry | ⭐⭐⭐ **BEST** |
| `FVG↑` | FVG zone long | ⭐⭐⭐ |
| `FVG↓` | FVG zone short | ⭐⭐⭐ |
| `ABS` | Absorption (caution) | ⚠️ Warning |
| `FK!` | Fakeout detected | ❌ Avoid |
### FVG Zones (Blue Boxes)
- **Bullish FVG** = Gap below price → Support zone
- **Bearish FVG** = Gap above price → Resistance zone
- **Best Entry** = Price touches FVG + Engulfing candle
### Bar Colors
| Color | Meaning |
|-------|---------|
| Bright Green | Bullish breakout confirmed |
| Bright Red | Bearish breakout confirmed |
| Light Green | Bullish retest entry |
| Light Red | Bearish retest entry |
### Info Table Key
| Field | Green = Good | Yellow/Orange = Caution |
|-------|--------------|-------------------------|
| Volume | HIGH VOL | Normal |
| Body | STRONG (70%+) | Normal/Weak |
| Status | BROKE HIGH/LOW | IN RANGE |
### Quick Trade Plan
```
LONG:
1. Wait for 30m ORB to complete
2. Watch for ORB↑ breakout
3. WAIT for pullback to ORB High
4. Enter on RT↑ or FVG↑ signal
5. SL = Below 30m ORB Low
6. TP = Target 1x or 2x
SHORT:
1. Wait for 30m ORB to complete
2. Watch for ORB↓ breakout
3. WAIT for pullback to ORB Low
4. Enter on RT↓ or FVG↓ signal
5. SL = Above 30m ORB High
6. TP = Target 1x or 2x
```
---

ORB Breakout & RetestORB Breakout & Breakdown Indicator - Complete Opening Range Strategy
Description :
The ORB (Opening Range Breakout) Breakout & Retest Indicator is a simple tool designed to identify opening range breakouts and breakdowns with retest confirmation. This indicator works on ANY timeframe while automatically analyzing 1-minute price action to detect precise entry signals.
What makes this indicator unique:
- ✅ Multi-Timeframe ORB Analysis - Simultaneously tracks 5-min, 15-min, and 30-min opening ranges
- ✅ Smart Retest Logic - Filters false breakouts by requiring price to retest and confirm the level
- ✅ Works on Any Chart Timeframe - View on 5-min, 15-min, 1-hour, or daily charts while getting 1-minute precision
- ✅ Both Long & Short Signals - Detects bullish breakouts AND bearish breakdowns
- ✅ Customizable Alerts - Get notified when confirmed setups occur
- ✅ Clean Visual Display - Compact table showing all ORB levels and signal status
How it Works:
Opening Range Detection :
- 5-Min ORB: Captures high/low from 9:30-9:35 AM
- 15-Min ORB: Captures high/low from 9:30-9:45 AM
- 30-Min ORB: Captures high/low from 9:30-10:00 AM
Breakout Confirmation (3-Step Process) :
1. Initial Break - Price closes above ORB High (or below ORB Low for shorts)
2. Retest - Price pulls back to retest the broken level
3. Confirmation - Price breaks through again, confirming the trend
This retest requirement dramatically reduces false signals and helps you enter trades with better risk/reward.
Perfect For :
- Day traders looking for opening range strategies
- Scalpers who need precise entry signals
- Swing traders identifying strong intraday momentum
- Anyone trading stocks, futures, forex, or crypto during market hours
---
⚙️ Settings & Customization :
Display Options :
- ☑️ Show ORB High (Default: OFF) - Display the high of each opening range in the table
- ☑️ Show ORB Low (Default: OFF) - Display the low of each opening range in the table
- ☑️ Show Breakout+Retest (Default: ON) - Show bullish breakout confirmation status
- ☑️ Show Breakdown+Retest (Default: ON) - Show bearish breakdown confirmation status
Alert Options :
- ☑️ Enable 5-Min Alerts (Default: OFF) - Get alerts for 5-minute ORB confirmations
- ☑️ Enable 15-Min Alerts (Default: OFF) - Get alerts for 15-minute ORB confirmations
- ☑️ Enable 30-Min Alerts (Default: OFF) - Get alerts for 30-minute ORB confirmations
Visual Indicators :
- Green triangles (▲) below bars = Breakout confirmed (bullish)
- Red triangles (▼) above bars = Breakdown confirmed (bearish)
- Triangle sizes: Tiny (5-min), Small (15-min), Normal (30-min)
---
Table Legend:
Timeframe Row: Shows the three ORB periods being tracked
ORB High Row: (Optional) The highest price during each opening range period
ORB Low Row: (Optional) The lowest price during each opening range period
Breakout+Retest Row:
- 🟢 YES = Bullish setup confirmed (price broke high, retested, and confirmed)
- 🔴 NO = No confirmed bullish setup yet
- ⚪ N/A = Opening range not yet established
Breakdown+Retest Row:
- 🟢 YES = Bearish setup confirmed (price broke low, retested, and confirmed)
- 🔴 NO = No confirmed bearish setup yet
- ⚪ N/A = Opening range not yet established
How to Use :
1. Add to Chart - Works best on stocks, futures, and indices with regular market hours (9:30 AM EST open)
2. Choose Your Timeframe - View on any timeframe; indicator automatically analyzes 1-minute data
3. Monitor the Table - Watch for "YES" signals in Breakout or Breakdown rows
4. Set Alerts - Enable alerts for your preferred ORB timeframes
5. Plan Your Trade - Use ORB levels as entry points and initial stop-loss levels
Tips :
- Combine multiple timeframe confirmations for higher probability setups
- Use ORB High/Low levels as natural support/resistance zones
- The 5-min ORB gives faster signals; 30-min ORB gives stronger trends
- Best results typically occur in the first 1-2 hours after market open
- Works on all markets but optimized for regular trading hours (9:30 AM EST)
Key Features Summary :
✓ Multi-timeframe opening range tracking (5, 15, 30-minute)
✓ Retest confirmation logic to filter false breakouts
✓ Works on any chart timeframe with 1-minute precision
✓ Bullish and bearish signal detection
✓ Customizable visual display with toggle options
✓ Individual alerts for each timeframe and direction
✓ Clean, professional table interface
✓ No repainting - signals are final once confirmed
✓ Suitable for all experience levels

Custom Session ORB - Extending Past Current CandleCustom Session ORB - Extending Past Current Candle
This indicator plots Opening Range Breakout (ORB) levels for one or two customizable trading sessions directly on your chart. It dynamically tracks the high, low, and midpoint of the defined session(s) and extends these levels beyond the session using a configurable offset.
Features:
Supports two custom sessions.
New York and Asia pre-saved.
Automatically tracks session High, Low, and Mid.
Option to extend ORB levels past the live candle.
Option to display only the most recent ORB for a clean chart.
Configurable line thickness, style, and label size.
Works in Eastern Standard Time (EST) without manual adjustment.
Settings:
Show Labels: Toggle to display ORB values on chart.
Label Font Size: Small, Normal, Large.
Mid Line Style: Solid, Dashed, or Dotted.
ORB Line Thickness: Set line thickness of ORB levels.
Extend Past Current Candle by N Bars: Controls how far the ORB extends visually.
Show Only Current ORB: Cleans chart by removing previous session ORB levels.
Enable Session 1 / 2: Toggle individual sessions on/off.
Session Time: Set the start and end times for each session (automatically in EST).
How It Works:
The indicator monitors the defined session time, records the high, low, and midpoint, and draws lines at those levels. When the session ends, the lines are extended by the specified offset for easy breakout visualization. Labels can optionally show the exact price levels.

Hybrid Strategy: Trend/ORB/MTFHybrid Strategy: Trend + ORB + Multi-Timeframe Matrix
This script is a comprehensive "Trading Manager" designed to filter out noise and identify high-probability breakout setups. It combines three powerful concepts into a single, clean chart interface: Trend Alignment, Opening Range Breakout (ORB), and Multi-Timeframe (MTF) Analysis.
It is designed to prevent "analysis paralysis" by providing a unified Dashboard that confirms if the trend is aligned across 5 different timeframes before you take a trade.
How it Works
The strategy relies on the "Golden Trio" of confluence:
1. Trend Definition (The Setup) Before looking for entries, the script analyzes the immediate trend. A bullish trend is defined as:
Price is above the Session VWAP.
The fast EMA (9) is above the slow EMA (21). (The inverse applies for bearish trends).
2. The Signal (The Trigger) The script draws the Opening Range (default: first 15 minutes of the session).
Buy Signal: Price breaks above the Opening Range High while the Trend is Bullish.
Sell Signal: Price breaks below the Opening Range Low while the Trend is Bearish.
3. The Confirmation (The Filter) A signal is only valid if the Higher Timeframe (default: 60m) agrees with the direction. If the 1m chart says "Buy" but the 60m chart is bearish, the signal is filtered out to prevent false breakouts.
Key Features
The Matrix Dashboard A zero-lag, real-time table in the corner of your screen that monitors 5 user-defined timeframes (e.g., 5m, 15m, 30m, 60m, 4H).
Trend: Checks if Price > EMA 21.
VWAP: Checks if Price > VWAP.
ORB: Checks if Price is currently above/below the Opening Range of that session.
D H/L: Warns if price is near the Daily High or Low.
PD H/L: Warns if price is near the Previous Daily High or Low.
Visual Order Blocks The script automatically identifies valid Order Blocks (sequences of consecutive candles followed by a strong explosive move).
Chart: Draws Green/Red zones extending to the right, showing where price may react.
Dashboard: Displays the exact High, Low, and Average price of the most recent Order Blocks for precision planning.
Risk Management (Trailing Stop) Once a trade is active, the script plots Chandelier Exit dots (ATR-based trailing stop) to help you manage the trade and lock in profits during trend runs.
Visual Guide (Chart Legend)
⬜ Gray Box: Represents the Opening Range (first 15 minutes). This is your "No Trade Zone." Wait for price to break out of this box.
🟢 Green Line: The Opening Range High. A break above this line signals potential Bullish momentum.
🔴 Red Line: The Opening Range Low. A break below this line signals potential Bearish momentum.
🟢 Green / 🔴 Red Zones (Boxes): These are Order Blocks.
🟢 Green Zone: A Bullish Order Block (Demand). Expect price to potentially bounce up from here.
🔴 Red Zone: A Bearish Order Block (Supply). Expect price to potentially reject down from here.
⚪ Dots (Trailing Stop):
🟢 Green Dots: These appear below price during a Bullish trend. They represent your suggested Stop Loss.
🔴 Red Dots: These appear above price during a Bearish trend.
🏷️ Buy / Sell Labels:
BUY: Triggers when Price breaks the Green Line + Trend is Bullish + HTF is Bullish.
SELL: Triggers when Price breaks the Red Line + Trend is Bearish + HTF is Bearish.
Settings
Session: Customizable RTH (Regular Trading Hours) to filter out pre-market noise.
Matrix Timeframes: 5 fixed slots to choose which timeframes you want to monitor.
Order Blocks: Adjust the sensitivity and lookback period for Order Block detection.
Risk: Customize the ATR multiplier for the trailing stop.
Disclaimer
This tool is for educational purposes only. Past performance does not guarantee future results. Always manage your risk properly.

ORB + Killzones - Universal AutoORB + Killzones • Universal Auto
A clean overlay indicator that automatically plots 15-minute Opening Range Breakout (ORB) levels for major global sessions with full DST handling and optional Killzone shading.
Key Features
Universal auto-detection: adapts session times and timezones perfectly for crypto (24/7) and traditional markets (cash hours only)
15-minute ORB high/low lines for Tokyo, Hong Kong, China, London, and New York sessions
Precise DST-aware London (Europe/London) and New York (America/New_York) sessions
Optional translucent Killzone background shading: London Open (0800–1100), NY Open (0930–1100), London Close (1530–1630) — with custom colors and transparency
Individual toggle switches for each session ORB and Killzone display
Clean neon color scheme matching popular retrowave setups (Tokyo teal, HK magenta, China red, London blue, NY gold)
Efficient drawing with persistent lines that extend until session end
No repainting, low resource usage (max 250 lines, 60 labels)
Ideal for ICT/SMC traders who want accurate multi-session ORBs and high-probability Killzone windows on any instrument or timeframe. Works on forex, indices, stocks, and crypto.
Recommend to uncheck timeframes over 1 hour in the Visibility tab of the Settings.

Open Range BreakoutOpen Range Breakout (ORB)
The Open Range Breakout (ORB) is a classic intraday strategy used across stocks, indices, FX and futures. It focuses on how price behaves during the first minutes of a major session, when liquidity and volatility are highest.
This indicator fully automates the ORB process with session detection, box drawing, breakout & retest logic, and final Buy/Sell signals.
Multi-Session Support
Choose between the three most important global opens:
Asia (Tokyo) – JPY pairs, Asian indices, gold, crypto
London – FX majors, European indices, strong volatility
New York – US indices, USD pairs, gold, oil, highest volume
The Opening Range is calculated only during the selected session.
ORB Range (5 / 15 / 30 min)
The indicator builds the ORB High/Low from the first X minutes of the session, draws the box, and waits for price action once the range is complete.
How It Works
ORB Window → High/Low of the opening minutes are recorded.
Breakout → Price closes above/below the ORB → “BREAKOUT” label.
Retest → Price returns to the ORB box → “RETEST” label.
Confirmation Levels Freeze → Upper/lower structure set.
Final Signal
Close above frozen upper level → BUY
Close below frozen lower level → SELL
This filters out false breakouts and provides structured continuation signals.
Alerts
Includes built-in alert conditions for:
ORB BUY Signal
ORB SELL Signal
Alerts trigger exactly when the Buy or Sell label appears.
Works On
Stocks & indices
Forex
Futures

Vib ORB Range (Free)Vib ORB Range (Free) plots the Opening Range High and Low for the session based on a user-defined start time and duration.
This tool is designed for traders who want a clean, no-noise display of the ORB zone without extra indicators or automation.
Features:
Customizable Opening Range start time
Customizable Opening Range duration
Automatically resets daily
Plots ORB High, ORB Low, and optional ORB Midline
Shaded range zone for improved clarity
Works on all timeframes and markets
How to Use:
Set the ORB start time (default 9:30 New York)
Set the ORB duration (default 15 minutes)
The indicator will draw the ORB zone once the range completes
Use the outlines or shaded zone to visually identify potential breakout areas
This free tool is intended as a simple, reliable ORB visualizer without alerts, filters, or strategy logic.

ORB_RDORB_RD - Opening Range Box (Ryan DeBraal)
This indicator automatically draws a high/low box for the first portion of
each trading day, automatically stepping the range window from 15, 30, 45,
up to 60 minutes after the session starts. The box updates live as the range
forms, then optionally extends across the rest of the session.
FEATURES
-----------------------------------------------------------------------------
• Opening Range Detection
- Automatically ladders the range window: 0–15, 0–30, 0–45, 0–60 minutes
- Automatic reset at each new trading day
- Live high/low updates while inside the 0–60 minute window
• Auto-Drawing Range Box
- Draws a dynamic rectangle as the range forms
- Top and bottom update with every new high/low
- Extends sideways in real time during formation
- Optional full-day extension after the 60-minute range finalizes
• Customizable Visuals
- Adjustable fill transparency
- Mild green tint by default for clarity
PURPOSE
-----------------------------------------------------------------------------
This tool highlights the evolving opening range, a widely used intraday
reference for breakout traders, mean-reversion setups, and session structure
analysis. Ideal for:
• Identifying early support and resistance
• Framing breakout and pullback decisions
• Tracking intraday trend bias after the morning range

Session Open Range, Breakout & Trap Framework - TrendPredator OBSession Open Range, Breakout & Trap Framework — TrendPredator Open Box
Stacey Burke’s trading approach combines concepts from George Douglas Taylor, Tony Crabel, Steve Mauro, and Robert Schabacker. His framework focuses on reading price behaviour across daily templates and identifying how markets move through recurring cycles of expansion, contraction, and reversal. While effective, much of this analysis requires real-time interpretation of session-based behaviour, which can be demanding for traders working on lower intraday timeframes.
The TrendPredator indicators formalize parts of this methodology by introducing mechanical rules for multi-timeframe bias tracking and session structure analysis. They aim to present the key elements of the system—bias, breakouts, fakeouts, and range behaviour—in a consistent and objective way that reduces discretionary interpretation.
The Open Box indicator focuses specifically on the opening behaviour of major trading sessions. It builds on principles found in classical Open Range Breakout (ORB) techniques described by Tony Crabel, where a defined time window around the session open forms a structural reference range. Price behaviour relative to this range—breaking out, failing back inside, or expanding—can highlight developing session bias, potential trap formation, and directional conviction.
This indicator applies these concepts throughout the major equity sessions. It automatically maps the session’s initial range (“Open Box”) and tracks how price interacts with it as liquidity and volatility increase. It also incorporates related structural references such as:
* the first-hour high and low of the futures session
* the exact session open level
* an anchored VWAP starting at the session open
* automated expansion levels projected from the Open Box
In combination, these components provide a unified view of early session activity, including breakout attempts, fakeouts, VWAP reactions, and liquidity targeting. The Open Box offers a structured lens for observing how price transitions through the major sessions (Asia → London → New York) and how these behaviours relate to higher-timeframe bias defined in the broader TrendPredator framework.
Core Features
Open Box (Session Structure)
The indicator defines an initial session range beginning at the selected session open. This “Open Box” represents a fixed time window—commonly the first 30 minutes, or any user-defined duration—that serves as a structural reference for analysing early session behaviour.
The range highlights whether price remains inside the box, breaks out, or rejects the boundaries, providing a consistent foundation for interpreting early directional tendencies and recognising breakout, continuation, or fakeout characteristics.
How it works:
* At the session open, the indicator calculates the high and low over the specified time window.
* This range is plotted as the initial structure of the session.
* Price behaviour at the boundaries can illustrate emerging bias or potential trap formation.
* An optional secondary range (e.g., 15-minute high/low) can be enabled to capture early volatility with additional precision.
Inputs / Options:
* Session specifications (Tokyo, London, New York)
* Open Box start and end times (e.g., equity open + first 30 minutes, or any custom length)
* Open Box colour and label settings
* Formatting options for Open Box high and low lines
* Optional secondary range per session (e.g., 15-minute high/low)
* Forward extension of Open Box high/low lines
* Number of historic Open Boxes to display
Session VWAPs
The indicator plots VWAPs for each major trading session—Asia, London, and New York—anchored to their respective session opens. These session-specific VWAPs assist in tracking how value develops through the day and how price interacts with session-based volume distributions.
How it works:
* At each session open, a VWAP is anchored to the open price.
* The VWAP updates throughout the session as new volume and price data arrive.
* Deviations above or below the VWAP may indicate balance, imbalance, or directional control.
* Viewed together, session VWAPs help identify transitions in value across sessions.
Inputs / Options:
* Enable or disable VWAP per session
* Adjustable anchor and end times (optionally to end of day)
* Line styling and label settings
* Number of historic VWAPs to draw
First Hour High/Low Extensions
The indicator marks the high and low formed during the first hour of each session. These reference points often function as early control levels and provide context for assessing whether the session is establishing bias, consolidating, or exhibiting reversal behaviour.
How it works:
* After the session starts, the indicator records the highest and lowest prices during the first hour.
* These levels are plotted and extended across the session.
* They provide a visual reference for observing reactions, targets, or rejection zones.
Inputs / Options:
* Enable or disable for each session
* Line style, colour, and label visibility
* Number of historic sessions displayed
EQO Levels (Equity Open)
The indicator plots the opening price of each configured session. These “Equity Open” levels represent short-term reference points that can attract price early in the session.
Once the level is revisited after the Open Box has formed, it is automatically cut to avoid clutter. If not revisited, the line remains as an untested reference, similar to a naked point of control.
How it works:
* At session open, the open price is recorded.
* The level is plotted as a local reference.
* If price interacts with the level after the Open Box completes, the line is cut.
* Untested EQOs extend forward until interacted with.
Inputs / Options:
* Enable/disable per session
* Line style and label settings
* Optional extension into the next day
* Option for cutting vs. hiding on revisit
* Number of historic sessions displayed
OB Range Expansions (Automatic)
Range expansions are calculated from the height of the Open Box. These levels provide structured reference zones for identifying potential continuation or exhaustion areas within a session.
How it works:
* After the Open Box is formed, multiples of the range (e.g., 1×, 2×, 3×) are projected.
* These expansion levels are plotted above and below the range.
* Price reactions near these areas can illustrate continuation, hesitation, or potential reversal.
Inputs / Options:
* Enable or disable per session
* Select number of multiples
* Line style, colour, and label settings
* Extension length into the session
Stacey Burke 12-Candle Window Marker
The indicator can highlight the 12-candle window often referenced in Stacey Burke’s session methodology. This window represents the key active period of each session where breakout attempts, volatility shifts, and reversal signatures often occur.
How it works:
* A configurable window (default 12 candles) is highlighted from each session open.
* This window acts as a guide for observing active session behaviour.
* It remains visible throughout the session for structural context.
Inputs / Options:
* Enable/disable per session
* Configurable window duration (default: 3 hours)
* Colour and transparency controls
Concept and Integration
The Open Box is built around the same multi-timeframe logic that underpins the broader TrendPredator framework.
While higher-timeframe tools track bias and setups across the H8–D–W–M levels, the Open Box focuses on the H1–M30 domain to define session structure and observe how early intraday behaviour aligns with higher-timeframe conditions.
The indicator integrates with the TrendPredator FO (Breakout, Fakeout & Trend Switch Detector), which highlights microstructure signals on lower timeframes (M15/M5). Together they form a layered workflow:
* Higher timeframes: context, bias, and developing setups
* TrendPredator OB: intraday and intra-session structure
* TrendPredator FO: microstructure confirmation (e.g., FOL/FOH, switches)
This alignment provides a structured way to observe how daily directional context interacts with intraday behaviour.
See the public open source indicator TP FO here (click on it for access):
Practical Application
Before Session Open
* Review previous session Open Box, Open level, and VWAPs
* Assess how higher-timeframe bias aligns with potential intraday continuation or reversal
* Note untested EQO levels or VWAPs that may function as liquidity attractors
During Session Open
* Observe behaviour around the first-hour high/low and higher-timeframe reference levels
* Monitor how the M15 and 30-minute ranges close
* Track reactions relative to the session open level and the session VWAP
After the Open Box completes
* Assess price interaction with Open Box boundaries and first-hour levels
* Use microstructure signals (e.g., FOH/FOL, switches) for potential confirmation
* Refer to expansion levels as reference zones for management or target setting
After Session
* Review how price behaved relative to the Open Box, EQO levels, VWAPs, and expansion zones
* Analyse breakout attempts, fakeouts, and whether intraday structure aligned with the broader daily move
Example Workflow and Trade
1. Higher-timeframe analysis signals a Daily Fakeout Low Continuation (bullish context).
2. The New York session forms an Open Box; price breaks above and holds above the first-hour high.
3. A Fakeout Low + Switch Bar appears on M5 (via FO), after retesting the session VWAP triggering the entry.
4. 1x expansion level serves as reference targets for take profit.
Relation to the TrendPredator Ecosystem
The Open Box is part of the TrendPredator Indicator Family, designed to apply multi-timeframe logic consistently across:
* higher-timeframe context and setups
* intraday and session structure (OB)
* microstructure confirmation (FO)
Together, these modules offer a unified structure for analysing how daily and intraday cycles interact.
Disclaimer
This indicator is for educational purposes only and does not guarantee profits.
It does not provide buy or sell signals but highlights structural and behavioural areas for analysis.
Users are solely responsible for their trading decisions and outcomes.

stormytrading orb botshows entries for 15m orb based on 5m break and retest made solely for mnq or nq, works good with smt
shows trades for ldn, nyc, nyc overlap and Asia session, pls follow stormy trading on insta for more

Opening Range Box, 2 SessionsOpening Range & Session Box Indicator
This indicator automatically draws Opening Range (OR) boxes and Session Boxes based on specific time zone settings, helping you visualize key trading periods across different global markets.
Key Features:
Custom Sessions: Define two independent trading sessions (e.g., New York and London).
Time Zone Selection: Choose the exact time zone for each session from a simple dropdown menu, ensuring accurate session mapping regardless of your chart's time zone.
Opening Range Definition: The initial portion of each session (defined by the Opening Range Minutes input) establishes the high and low of the box.
Offset Lines: Automatically draws two percentage offset lines inside the box, allowing you to easily track price movement relative to the Opening Range high and low (e.g., 10% retracement levels).
How to Use the Inputs:
Session A/B Timezone - Select the time zone for Session A (e.g., America/New_York).
Session A/B Time - Define the start and end time for Session A (e.g., 0930-1600).
Opening Range Minutes - Set how long the initial opening range period lasts (e.g., 30 minutes).
Percent from High/Low for Line - Set the percentage distance for the inner offset lines (e.g., 10.0 for 10% retracement).
Number of Boxes to Show - Controls the number of historical session boxes and lines that remain visible on the chart.
SuperMegaIndicator5000SuperMegaIndicator5000
key levels
ema
volume on price High Vol LowV and chop on price
London open close
vwap
orb
and maybe a couple other indicators

Hourly ORB Boxes v2 (5/15min/custom min)Draws ORB on 9.30am open and every hour from 11am to 3pm so you can enjoy multiple ORB entries throughout the day with a custom time
Choose 5 min or 10 min or 15 min for ORB.
All open source written from scratch with help of chatgpt lol
