Options Scalping Banknifty ContributionThis Indicator is Owned by Team Option Scalping.
This Indicator tell us about the contribution of constituents in BANKNIFTY
BANKNIFTY is an index in National Stock Exchange (NSE) which holds banking stocks.
More than 15 stocks contribute in Banknifty Index in different % ( Based on there valuation )
We took top 12 Stocks and there contribution points in table.
We can see Banknifty points at the Top and stocks contribution below that.
And if you sum it up all stocks contribution then it will be equal to Banknifty points.
This keeps on changing on real time. And rows automatically sorts based on Constituents points
Like if SBIN is contributing the most for BANKNIFTY then it will be at top
And If any other stock is contribution the least ( in negative ) then it will be at the bottom of the table.
Color coding is Algo give , if green then stocks has contributed on positive points
If red then stock has contributed on negative points
Indicator has input of placing the table on different position on screen
Other than that no input parameters are there.
List of stocks and there contribution are controlled by us only.
Optionsscalping

Options Scalping V2This Indicator is Owned by Team Option Scalping.
It has 4 Plots and 2 Tables.
This indicator to be used only in BankNifty Futures
VWAP ( Volume weighted average price )
• User can input the source and enable/disable the VWAP from input section.
• When price is more than the VWAP its Bullish Trend and vice versa.
VWMA ( Volume weighted moving average )
• Default value of 20 is used in VWMA . User can enable/disable it from input section.
• When price is more than the VWMA its Bullish Trend and vice versa.
Parabolic SAR
• User can input “start”, “increment” and “maximum” values from input section and can enable/disable SAR also.
• When price is more than the Parabolic SAR its Bullish Trend and vice versa.
SuperTrend
• User can input ATR Period and ATR Multiplier values from input section. By defaults it’s 10 and 2.
• User have option of enable/disable “Change ATR calculation Method”, if enabled then ATR is calculated differently for SuperTrend.
• Enable/disable “BUY/SELL signals” on SuperTrend.
• When price is more than the SuperTrend its Bullish Trend and vice versa.
Top Right Corner TABLE ( 6 , 10 )
When you are trading in Banknifty futures , we have to check major Banks which is contributing to Banknifty move. So we have given that in this tab.
This table consist data of 9 following stocks:
• BankNifty
• Nifty
• Dow
• INDIA
• VIX
• HDFC
• ICICI
• KOTAK
• AXIS
• SBI
And following data of each stock has been provided:
• LTP
• Daily Change
• Daily Percentage Change
• 15-minute Change Percentage
• 1-Hour Change Percentage
Bottom Right Corner TABLE (3, 6 )
This table consist of 4 indicators values and Up/Down indicator:
• VWMA (When price is more than the VWMA its Bullish and vice versa)
• SuperTrend (10.2, When price is more than the SuperTrend its Bullish and vice versa.)
• RSI (14)
• VWAP (When price is more than the VWAP its Bullish and vice versa.)

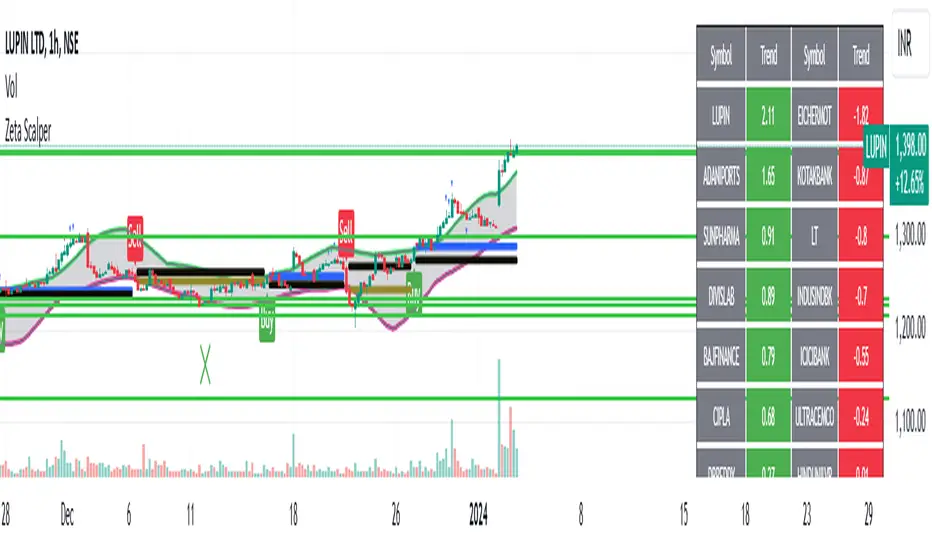
Zeta ScalperWhat is Scalping?
Scalping is a trading strategy aimed at profiting from quick momentum in a volatile index or stock.
Traders who use such strategies place anywhere from 10 to a few hundred trades in a single day.
The idea behind such type of trading is that small moves in an index or stock price are much easier to capture than the larger moves.
Traders who use such strategies are known as scalpers. When you take many small profits a number of times, say 10 points scalped 20 times per day, they can easily add up to large gains.
An Option Buyer's Biggest Enemy is Time Decay and when you scalp, you do not allow the time decay to eat your Option Premium as your Entry and Exit is often quick enough.
What is Zeta Scalper?
Zeta Scalper indicator is a momentum based indicator which tries to detect momentum based upon a number of Candle Stick Patterns.
When it thinks a move has the potential to turn into a big move, it generated its Buy/Sell Signals.
It is a well known fact that actual drivers of the market are Big Institutions, Mutual Funds & Big Guys with deep pockets.
They have large amounts of money to invest and they buy & sell in bulk.
When they buy, often their objective is to buy at lower levels (below average price of the day) & when they sell they sell at higher levels (above average price of the day).
Zeta Scalper seeks to detect this activity. When aggressive buying or selling starts where Buying & Selling Forces become unequal, the Price starts moving in one direction with candles making Higher Highs or Lower Lows.
Zeta Scalper detects these Higher Highs or Lower Lows and generates Buy or Sell signals when this happens.
In order to use this indicator, simply deploy this on your chart, and wait for Buy/Sell signals.
It works on all time frames including 1 min. 3min. 5min. & 10min. etc.
When a Buy Signal is followed by Sell signal (let it be after 3 - 4 candles or after many candles) or vice-versa, you have to switch your position to make most of the reverse move.
It is a general purpose indicator and may be used on stocks, commodities and currencies alike and is not meant for any specific market.
How to Take Buy/Sell Entry with Zeta Scalper?
Whenever you see a Buy Signal, mark its closing price with a horizontal line and as soon as a candle breaks this candle's High, it is time for you to take Entry.
Your STOP LOSS could be just 0.5% below your Entry Price, hence, no big loss even if things go wrong.
Keep moving your STOP LOSS up as the price moves in your favour and when market turns around and you see a SELL signal, it is time to book your BUY position profit and take Entry on SELL Side now and so on.
How to get this indicator?
This is invite-only indicator. Get in touch with us using information given below in Signature field to try this tool FREE.