STR StrengthSTR Strength – CE/PE VWAP Deviation + Straddle Volatility Meter
💡 Key Features
🔹 Strength Calculation
Computes Call Strength (CE) and Put Strength (PE) as the deviation of close from intraday VWAP.
Positive strength → trading above VWAP (bullish bias).
Negative strength → trading below VWAP (bearish bias).
🔹 Smoothing Option
Optionally smooths the strength values using a simple moving average for better clarity and trend visibility.
🔹 Volatility Detection
Monitors straddle percentage change per bar (CE + PE combined).
When volatility exceeds your defined threshold, chart background highlights in yellow.
🔹 Live Data Table
Displays real-time metrics at the bottom of the chart:
CE Strength
PE Strength
Total Straddle Value
📊 How to Interpret
Lime Line (CE Strength): Bullish bias in the call option.
Red Line (PE Strength): Bearish bias in the put option.
Yellow Background: Indicates high volatility movement in straddle value.
⚠️ Disclaimer
This indicator is provided for educational and analytical purposes only.
It does not provide trading advice or buy/sell signals.
Use responsibly and in conjunction with your market analysis.
Options

Meeting Point TrackerDescription
This script — Options – Meeting Point — visually combines Call (CE) and Put (PE) option candles of the same strike into a single layout, designed for intraday option traders who monitor both legs simultaneously.
💡 Key Features
🔹 Dual Candle Display
Plots CE candles in green/red and PE candles in blue/magenta.
Both legs appear on the same panel — perfect for straddle/strangle monitoring.
🔹 Automatic Symbol Builder
Auto-constructs CE/PE symbols from spot index, expiry, and strike.
Manual override supported for custom inputs.
🔹 Live BEP & Levels(Under testing)
Displays intraday CE/PE highs & lows with dotted lines.
Shows Live Break-Even Points (BEP) for the straddle — updated tick-by-tick.
Optional manual price line for quick visual references.
🔹 VWAP Support
Plots VWAP for both CE and PE options individually (toggleable).
Helps compare momentum and strength between both sides.
🔹 Point of Control (POC)
Calculates dynamic intraday POC using 1-minute price–volume density.
Updates automatically as new data streams in.
🔹 Trade Blocks (Per-Leg)
Define trade details for CALL and PUT independently:
Entry, SL, Target, Quantity, Side (Buy/Sell).
Calculates Live P&L and Status (“Target Hit”, “SL Hit”, or “Live”).(Under testing)
⚠️ Disclaimer
This indicator is for educational and analytical purposes only.
It does not constitute financial advice or trade recommendations.
Past performance is not indicative of future results.

Multiverse ORBJust a simple ORB method to help you to decide. Built for Malaysian & US market. Simple tips, when you see the orb, get ready to TEKAN

EMA 9/20 Crossover AlertThis EMA 9/20 Crossover Alert indicator is a technical tool used on price charts to detect and notify traders when the short-term 9-period Exponential Moving Average (EMA) crosses above or below the longer-term 20-period EMA. This crossover often signals potential shifts in market momentum, signaling possible buy or sell opportunities. The indicator visually plots both EMAs on the chart and creates alert conditions so traders can be promptly informed of these crossover events, aiding in timely decision-making without needing to constantly watch the chart. It is widely used in momentum and trend-following trading strategies to identify trend reversals or continuations

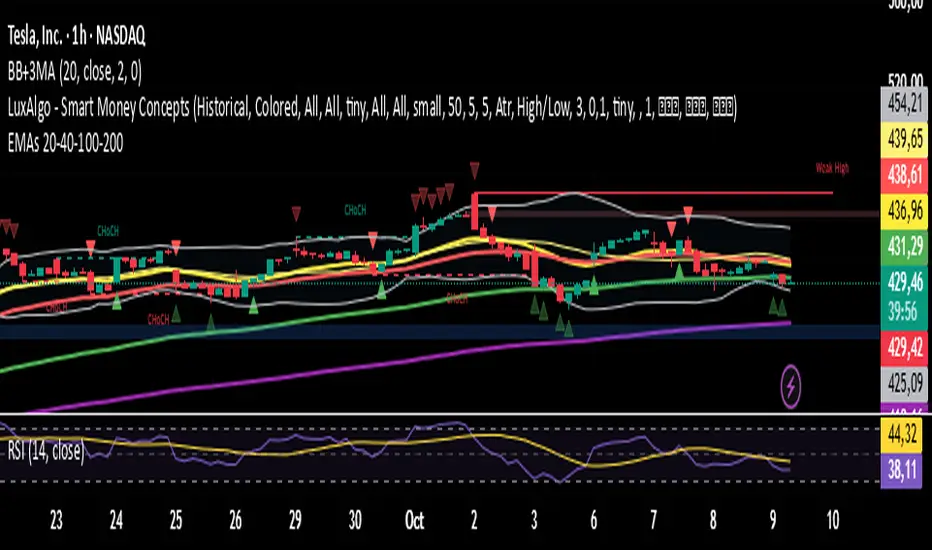
EMAs 20 - 40 - 100 - 200
This script contains the 20-40-100-200 EMAs.
EMA (Exponential)
Best for active or short-term trading because:
It adjusts more quickly to recent price changes.
It allows for earlier detection of trend reversals.
It is preferred by traders who trade calls and puts for a few days or weeks.
Example:
On 15-minute, 1-hour, or daily time frames, the 20-EMA or 40-EMA gives you early signals to open or close options.
It is good for momentum trades or quick breakouts.
Zay Gwet AlertEMA 9, VWAP and ORB 15 minutes alert in Burmese. When the market across the EMA 9 will give alert to buy or sell. And when the market across the VWAP and ORB 15 will alert as well. Especially for Burmese community as it is in Burmese language.

Options Momentum SignalCustomizable Intraday Options Scalping Alert.
Several important, complementary indicators combined into one simple signal that pops up under a bar to indicate sustained momentum on a trend. It uses a combination of calculations based on the 1m VWAP, price increase in contrast to previous day's close, and customizable Volatility and Volume Data.
It has adjustable values for the % increase from last close (labeled as Pre-Mkt % Threshold), minimal candle body % to filter out weaker signals, RVOL threshold, minimum CVD (it's rolling, so functions in tandem with the CVD lookback value for the number of bars.)
It offers individual boxes that can be checked on or off to help filter out noise. Boxes are: Use 1m VWAP, Use CVD, 3-bar cooldown (reduces back-to-back signals, especially on shorter (1m, 2m, and 5m) charts), VWAP bounce option to catch bounces happening in real time before the candle closes, Use RVOL, and Use Rolling CVD. These can all be checked on or off and will create vastly different signals depending on what you are filtering for.
These indicators were chosen specifically as I feel they help most with option scalping and is intended to be used alongside a few other indicators for confirmation. Personally, I use a couple anchored VWAPs (highest high, session) as well as a FRAMA channel for confirmation. I also use the following to further confirm trends: TradingView’s RVOL, CVD, and Price Pattern Oscillators, in addition to Beardy Fred's TTM Squeeze Pro.
Hope this helps some people!

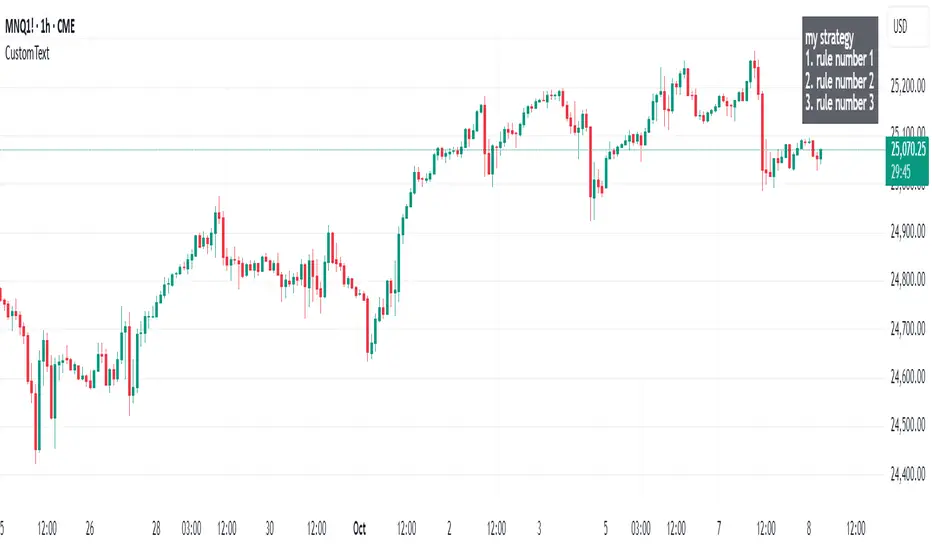
Custom Text Display📋 Custom Text Display - User Guide
Overview
This indicator allows you to display custom text anywhere on your TradingView chart with full control over appearance and positioning.
Features
📝 Text Settings
Custom Text: Write any text you want to display on your chart. Can be multiple lines.
Text Alignment: Choose how your text is aligned within the box
Left
Center
Right
Text Color: Pick any color for your text
Background Color: Choose the background color of the text box (includes transparency control)
Text Size: Select from 5 different text sizes
Tiny
Small
Normal
Large
Huge
📍 Position Settings
Table Position: Choose where the text box appears on your chart
Top Left
Top Center
Top Right
Bottom Left
Bottom Center
Bottom Right
Vertical Offset (0-20): Fine-tune the vertical position
0 = Default position (no offset)
Higher values = Move the text box further down
Use this to avoid overlapping with other indicators or chart elements
How to Use
Add the indicator to your TradingView chart
Open the settings by clicking the gear icon next to the indicator name
Enter your text in the "Custom Text" field
Customize appearance:
Choose your preferred colors for text and background
Select text size and alignment
Position the box:
Select one of the 6 main positions
Use "Vertical Offset" to fine-tune the exact position (add empty space above the text)
Click OK to apply changes
Use Cases
📊 Display trading notes or reminders
📈 Show key levels or targets
💡 Add strategy descriptions
⚠️ Display risk warnings
📝 Create custom labels for specific chart setups
🎯 Mark important price zones with descriptions
Tips
Use transparent backgrounds (adjust the transparency slider) for a cleaner look
Vertical Offset is useful when you have multiple indicators at the top/bottom and need to avoid overlap
Large/Huge text works well for important notes you want to see at a glance
Combine different text alignments with different positions for better layout control
Note: The text box updates in real-time as you change settings, so you can preview your changes before applying them.
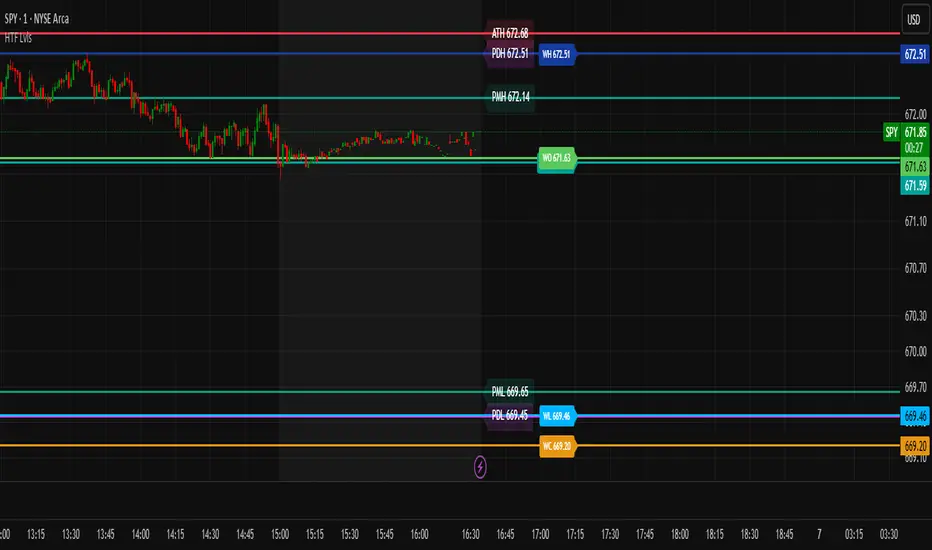
HTF & PD/PM LevelsTired of mapping your own levels every morning? Look no further! This script automatically maps out and updates HTF & PD/PM Levels along with ATH. I personally use these as confirmation zones with EMA & VWAP, RSI, and Volume... but alone, these levels mark major support and resistances.
What are they?
🏰 HTF Levels — “Big Grown-Up Lines”
HTF = Higher Time Frame
Think of your price chart like a big map. HTF levels are the important lines from bigger chunks of time:
>Daily (yesterday’s close, high, low)
>Weekly (this week’s open, high, low, close)
>Monthly (this month’s open/close)
Why they matter:
These are like big walls and floors that price often bounces off or stops at. Big traders (institutions) watch them because they show where a lot of buying or selling happened before.
⏰ PD & PM Levels — “Yesterday & Morning Clues”
PD = Previous Day
>PDH = Previous Day’s High
>PDL = Previous Day’s Low
>PDC = Previous Day’s Close
PM = Pre-Market
>PMH = Pre-Market High
>PML = Pre-Market Low
>ATH = All-Time High
Why they matter:
These tell you where price moved when most regular traders weren’t awake yet (pre-market) and where it ended up yesterday. Price often revisits or reacts to these spots.
⚡ How Options Traders Use Them
Support & Resistance:
If price is near an HTF or PD/PM level, it might stop and turn around there (like a ball hitting a wall) or it might use it as a launchpad to the next level if it breaks.
Entry & Exit Spots:
Traders might buy calls (bet price goes up) if it breaks above an important level, or puts (bet price goes down) if it breaks below.
Risk Management:
These levels give clear spots to set stops and targets — “If price breaks this level, I’m out.”
Super Simple Picture:
HTF = big important levels from days, weeks, months.
PD/PM = yesterday’s and morning’s clues where price already moved.
Traders use them to guess where price might bounce or break to plan option trades safely.
Algo Trading Signals - Buy/Sell System# 📊 Algo Trading Signals - Dynamic Buy/Sell System
## 🎯 Overview
**Algo Trading Signals** is a sophisticated intraday trading indicator designed for algorithmic traders and active day traders. This system generates precise buy and sell signals based on a dynamic box breakout strategy with intelligent position management, add-on entries, and automatic target adjustment.
The indicator creates a reference price box during a specified time window (default: 9:15 AM - 9:45 AM IST) and generates high-probability signals when price breaks out of this range with confirmation.
---
## ✨ Key Features
### 📍 **Smart Signal Generation**
- **Primary Entry Signals**: Clear buy/sell signals on confirmed breakouts above/below the reference box
- **Confirmation Bars**: Reduces false signals by requiring multiple bar confirmation before entry
- **Cooldown System**: Prevents overtrading with configurable cooldown periods between trades
- **Add-On Positions**: Automatically identifies optimal pullback entries for scaling into positions
### 📦 **Dynamic Reference Box**
- Creates a high/low range during your chosen time window
- Automatically updates after each successful trade
- Visual box display with color-coded boundaries (red=resistance, green=support)
- Mid-level reference line for market structure analysis
### 🎯 **Intelligent Position Management**
- **Automatic Target Calculation**: Sets profit targets based on average move distance
- **Add-On System**: Up to 3 additional entries on optimal pullbacks
- **Position Tracking**: Monitors active trades and remaining add-on capacity
- **Auto Box Shift**: Adjusts reference box after target hits for continued trading
### 📊 **Visual Clarity**
- **Color-Coded Labels**:
- 🟢 Green for BUY signals
- 🔴 Red for SELL signals
- 🔵 Blue for ADD-ON buys
- 🟠 Orange for ADD-ON sells
- ✓ Yellow for Target hits
- **TP Level Lines**: Dotted lines showing current profit targets
- **Hover Tooltips**: Detailed information on entry prices, targets, and add-on numbers
### 📈 **Real-Time Statistics**
Live performance dashboard showing:
- Total buy and sell signals generated
- Number of add-on positions taken
- Take profit hits achieved
- Current trade status (LONG/SHORT/None)
- Cooldown timer status
### 🔔 **Comprehensive Alerts**
Built-in alert conditions for:
- Primary buy entry signals
- Primary sell entry signals
- Add-on buy positions
- Add-on sell positions
- Buy take profit hits
- Sell take profit hits
---
## 🛠️ Configuration Options
### **Time Settings**
- **Box Start Hour/Minute**: Define when to begin tracking the reference range
- **Box End Hour/Minute**: Define when to lock the reference box
- **Default**: 9:15 AM - 9:45 AM (IST) - Perfect for Indian market opening range
### **Trade Settings**
- **Target Points (TP)**: Average move distance for profit targets (default: 40 points)
- **Breakout Confirmation Bars**: Number of bars to confirm breakout (default: 2)
- **Cooldown After Trade**: Bars to wait after closing position (default: 3)
- **Add-On Distance Points**: Minimum pullback for add-on entry (default: 40 points)
- **Max Add-On Positions**: Maximum additional positions allowed (default: 3)
### **Display Options**
- Toggle buy/sell signal labels
- Show/hide trading box visualization
- Show/hide TP level lines
- Show/hide statistics table
---
## 💡 How It Works
### **Phase 1: Box Formation (9:15 AM - 9:45 AM)**
The indicator tracks the high and low prices during your specified time window to create a reference box representing the opening range.
### **Phase 2: Breakout Detection**
After the box is locked, the system monitors for:
- **Bullish Breakout**: Price closes above box high for confirmation bars
- **Bearish Breakout**: Price closes below box low for confirmation bars
### **Phase 3: Signal Generation**
When confirmation requirements are met:
- Entry signal is generated with clear visual label
- Target price is calculated (Entry ± Target Points)
- Position tracking activates
- Cooldown timer starts
### **Phase 4: Position Management**
During active trade:
- **Add-On Logic**: If price pulls back by specified distance but stays within favorable range, additional entry signal fires
- **Target Monitoring**: Continuously checks if price reaches TP level
- **Box Adjustment**: After TP hit, box automatically shifts to new range for next opportunity
### **Phase 5: Trade Exit & Reset**
On target hit:
- Position closes with TP marker
- Statistics update
- Box repositions for next setup
- Cooldown activates
- System ready for next signal
---
## 📌 Best Use Cases
### **Ideal For:**
- ✅ Intraday breakout trading strategies
- ✅ Algorithmic trading systems (via alerts/webhooks)
- ✅ Opening range breakout (ORB) strategies
- ✅ Index futures (Nifty, Bank Nifty, Sensex)
- ✅ High-liquidity stocks with clear ranges
- ✅ Automated trading bots
- ✅ Scalping and day trading
### **Markets:**
- Indian Stock Market (NSE/BSE)
- Futures & Options
- Forex pairs
- Cryptocurrency (adjust timing for 24/7 markets)
- Global indices
---
## ⚙️ Integration with Algo Trading
This indicator is **algo-ready** and can be integrated with automated trading systems:
1. **TradingView Alerts**: Set up alert conditions for each signal type
2. **Webhook Integration**: Connect alerts to trading platforms via webhooks
3. **API Automation**: Use with brokers supporting TradingView integration (Zerodha, Upstox, Interactive Brokers, etc.)
4. **Signal Data Access**: All signals are plotted for external data retrieval
---
## 📖 Quick Start Guide
1. **Add Indicator**: Apply to your chart (works best on 1-5 minute timeframes)
2. **Configure Time Window**: Set your desired box formation period
3. **Adjust Parameters**: Tune confirmation bars, targets, and add-on settings to your trading style
4. **Set Alerts**: Create alert conditions for automated notifications
5. **Backtest**: Review historical signals to validate strategy performance
6. **Go Live**: Enable alerts and start receiving real-time trading signals
---
## ⚠️ Risk Disclaimer
This indicator is a **tool for analysis** and does not guarantee profits. Trading involves substantial risk of loss. Always:
- Use proper position sizing
- Implement stop losses (not included in this indicator)
- Test thoroughly before live trading
- Understand market conditions
- Never risk more than you can afford to lose
- Consider your risk tolerance and trading experience
**Past performance does not indicate future results.**
## 🔄 Version History
**v1.0** - Initial Release
- Dynamic box formation system
- Confirmed breakout signals
- Add-on position management
- Visual signal labels and statistics
- Comprehensive alert system
- Auto-adjusting target boxes
---
## 📞 Support & Feedback
If you find this indicator helpful:
- ⭐ Please leave a like/favorite
- 💬 Share your feedback in comments
- 📊 Share your results and improvements
- 🤝 Suggest features for future updates
---
## 🏷️ Tags
`breakout` `daytrading` `signals` `algo` `automated` `intraday` `ORB` `opening-range` `buy-sell` `scalping` `futures` `nifty` `banknifty` `algorithmic` `box-strategy`
*Remember: The best indicator is combined with proper risk management and trading discipline.* Use it at your own rist, not as financial advie

ARJ@combo This indicator tracks the combined premium of a Call and Put option (straddle) and overlays technical signals to help traders analyze option market behavior more effectively.
It is especially useful for BANKkNIFTY / NIFTY options, but you can apply it to any instrument by simply selecting the strike price symbols.

ARJ@ Combined Option Premium with EMA & VWAPThis indicator tracks the combined premium of a Call and Put option (straddle) and overlays technical signals to help traders analyze option market behavior more effectively.
It is especially useful for Banknifty / nifty options, but you can apply it to any instrument by simply selecting the strike price symbols.
Tristan's Three Line Strike PatternThree Line Strike Indicator (5-Minute Timeframe)
This indicator highlights Three Line Strike candlestick patterns on a 5-minute chart . The Three Line Strike is a rare four-candle formation that often signals trend continuation rather than reversal.
Bullish Three Line Strike (green “3LS long” above the candle):
Three strong bullish candles in a row are followed by a large bearish candle that completely engulfs the prior three. Despite looking bearish, this setup often indicates strength in the uptrend.
Bearish Three Line Strike (red “3LS sell” below the candle):
Three consecutive bearish candles are followed by a large bullish engulfing candle. Although it looks like a reversal, the downtrend commonly resumes.
How to use on the 5-min chart:
Watch for the labels marking the pattern.
A bullish signal suggests that the upward move is likely to continue after the engulfing candle.
A bearish signal suggests that the downtrend is likely to continue after the engulfing candle.
These signals are not entry/exit triggers on their own—I suggest you combine them with trend confirmation (e.g., moving averages, momentum indicators, or volume analysis) before acting.
Use good risk management, and don't buy / sell based on these indicators alone.

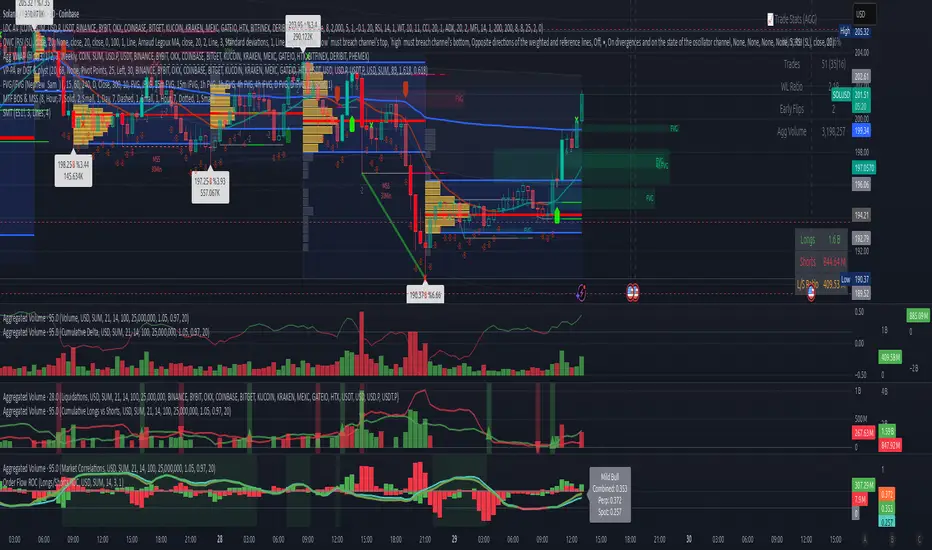
Volume Aggregated Spot & Futures -- Crypto (by plyst & more)📊 Volume Aggregated Spot & Futures - Enhanced Edition
🎯 Overview
Advanced volume aggregation indicator that combines spot and perpetual futures volume across the top 10 cryptocurrency exchanges. This enhanced version builds upon the original work by @HALDRO Project with optimized calculations and expanded functionality.
✨ Key Features
- 📈 Real-time aggregated volume from 10 major exchanges (Binance, Bybit, OKX, Coinbase, Bitget, KuCoin, Kraken, MEXC, Gate.io, HTX)
- 🔄 Multiple visualization modes: Volume, Delta, Cumulative Delta, Spot vs Perp analysis, Liquidations, OBV, and MFI
- 💱 Multi-currency support: Display volume in COIN, USD, or EUR
- 🎨 Clean, single-color bar chart showing total cumulative volume
- 📊 Multiple calculation methods: SUM, AVG, MEDIAN, VARIANCE
- 🎯 Separate spot (USDT, USD, USDC, etc.) and perpetual futures (.P contracts) tracking
🔧 Technical Improvements
✓ Corrected MFI formula for accurate money flow calculations
✓ Optimized volume aggregation logic with proper NA handling
✓ Support for 10 exchanges (up from 9)
✓ Streamlined codebase for better performance
✓ Updated perpetual contract naming conventions (.P format)
📖 Usage
Perfect for analyzing total market volume, identifying liquidation events, tracking buyer/seller pressure through delta analysis, and understanding the spot vs futures market dynamics.
🙏 Credits
Original concept and framework by @HALDRO Project. This version includes mathematical corrections, code optimizations, and expanded exchange support.
⚠️ Note
Aggregated volume is calculated from external exchange data using request.security(). Ensure your plan supports the necessary security calls for optimal performance.
IDX Utility Set [zidaniee]Purpose
This indicator is not a technical analysis tool. It’s a companion overlay designed to guide your analysis of the uniquely structured Indonesia Stock Exchange (IDX).
Core Features
Centered Ticker Display – Clean, readable ticker shown at the center of the chart.
Company Name – Displays the listed company’s full name.
Active Timeframe – Shows the currently selected timeframe.
Additional Features
ATH & ATL Markers – Labels the All-Time High (ATH) and All-Time Low (ATL) and shows the percentage distance from the latest price to each level, so you can quickly gauge upside/downside room.
IDX Fraction (Tick) Levels – Visualizes Indonesia’s price-fraction (tick) brackets. This matters because tick size changes by price range—very useful for scalpers and fast traders.
ARA/ARB Levels (Realtime) – Plots Auto-Reject Upper (ARA) and Auto-Reject Lower (ARB) levels in real time. Levels refresh in line with IDX trading hours 09:00–16:00 WIB (UTC+7), so your view stays consistent both during and outside market hours. This feature already complies with the latest rules and adjustments set by the Indonesia Stock Exchange (IDX).
Suspension Status – Shows SUSPENDED if the stock is halted/suspended, helping you avoid unnecessary analysis. The suspension check compares today’s date with the last available candle date and accounts for weekends.
Note: WIB = Western Indonesia Time (UTC+7).

Trend Discovery by Alex Trend States (Up / Reversal / Down)Author: © Alex Neighbors
Version: v6
The Call/Put Arrow Indicator is a complete market direction tool that identifies high-probability CALL (bullish) and PUT (bearish) opportunities using a combination of:
Simple Moving Averages (SMA)
RSI Momentum
MACD confirmation
VWAP trend filtering
Real-time trend classification (Trending Up, Trending Down, or Reversal)
It provides visual buy/sell arrows, trend labels, and alerts, helping traders quickly recognize optimal option entry points and directional momentum changes.
*** How It Works
✅ CALL Arrow (Green, Up Arrow Below Candle):
Triggered when:
Fast SMA > Slow SMA (uptrend)
RSI > Threshold (default 55)
MACD Line > Signal Line
(Optional) Price > VWAP
🔻 PUT Arrow (Red, Down Arrow Above Candle):
Triggered when:
Fast SMA < Slow SMA (downtrend)
RSI < Threshold (default 45)
MACD Line < Signal Line
(Optional) Price < VWAP
**Trend Detection System:
Trending Up: Both SMAs rising with bullish alignment
Trending Down: Both SMAs falling with bearish alignment
Trend Reversal: Detected instantly when Fast SMA crosses the Slow SMA (marked by a diamond)
Visuals
🟩 Green arrows below candles for CALL entries
🟥 Red arrows above candles for PUT entries
🟢/🔴 Diamonds mark trend reversals
Trend status panel in the top-right corner
Optional background or bar coloring for quick visual confirmation
Alerts
You can create alerts for:
CALL Buy Signal
PUT Buy Signal
Trend Reversal Up
Trend Reversal Down
All alerts trigger exactly when arrows or reversals appear on the chart.
--Best Use
Works on any symbol or timeframe (scalping, swing, or trend trading)
Optimized for SPX, QQQ, TSLA, and high-volume tickers
Ideal for traders combining options flow or price action confirmation
Customization
You can adjust:
SMA lengths
RSI thresholds
MACD parameters
VWAP filter toggle
Background/bar coloring and panel display
Why Traders Love It
Simple, clean chart visuals
Non-repainting, confirmed-bar signals
Multi-filter logic for high accuracy
Trend panel for instant context
Use this indicator to stay on the right side of the market.
Identify reversals early, trade the momentum confidently, and never miss your next CALL or PUT setup again.

Current Price (Customizable) by DRtradeCurrent Price Line & Dynamic Label (Fully Customizable)
The ultimate tool for clear, real-time price visualization.
This powerful, lightweight indicator draws a clean horizontal line at the current market price, updating instantly with every price tick. Unlike other current price line scripts, this tool ensures you always see where the price is right now and provides full control over every visual element.
Key Features:
- Real-Time Tracking: The line moves dynamically with price ticks within the current candle, eliminating lag and providing true current market price awareness.
- Line Extension Control: Choose to extend: Left, Right, or Both. Helpful for scalpers and options traders
- Visual Customizations: Color, Style, Size, Width, etc.
- Label Positioning: Left of Candle, Above Candle, or Right of Candle
All customization options are available in the indicator's settings menu.
Ping me with feature reqeusts.

3 Red Heikin Ashi with Higher Lows3 Red Heikin Ashi with Higher Lows will give Buy signal when 3 Red Heikin Ashi with Higher Lows is formed

Gap ZonesThis TradingView indicator automatically detects daily price gaps and plots them clearly on any timeframe (intraday or daily).
It helps visualize where unfilled gaps are sitting, track whether they’ve been filled, and control how far the zone extends.
Key Features
1. Daily Gap Detection
• Works even when you’re on intraday charts (uses daily OHLC data).
• Marks both gap up (potential support zones) and gap down (potential resistance zones).
2. Shaded Gap Zones
• Each gap is highlighted as a band (greenish for up, reddish for down).
• Option to turn shading off if you just want horizontal lines.
3. Hide When Filled
• Once price closes or touches the far side of the gap, it disappears (configurable: Touch vs Close).
4. Lookback Window
• Gaps only show if they occurred within the past X trading days (default: 30).
• Prevents your chart from being cluttered with ancient gaps.
5. Multiple Gaps Tracked
• Can track up to 5 recent gaps simultaneously.
• Oldest gaps “roll off” as new ones form.
6. Finite Right-Edge Guides
• Optional horizontal guide lines extend to the right, but only for a fixed number of bars (default: 50).
• Cleaner than infinite extensions.
7. Gap-Day Marker
• Optional vertical line drawn on the bar where the gap first occurred.
⸻
⚙️ Inputs & Settings
When you apply the indicator, you’ll see these options:
• Lookback (trading days): How far back to scan for gaps (default 30).
• Max gaps to show (1..5): How many simultaneous gap zones to display.
• Min gap size (% of prior close): Filter out tiny gaps (default 0.25%).
• Hide gaps once filled: Removes a gap from the chart once filled.
• Fill rule uses CLOSE (off = Touch):
• Touch = filled when price trades through the level intraday.
• Close = filled only when a candle close crosses it.
• Show shading: Toggle zone fills on/off.
• Show vertical marker on gap day: Toggle gap-day marker line.
• Show finite right-edge lines: Toggle horizontal lines extending right.
• Right line length (bars): How far those lines extend (default 50 bars).
⸻
🟢 How to Use It
1. Apply on Any Chart
• Works best on daily or intraday (5m, 15m, 1h).
• Gaps are always calculated from daily data, so intraday charts will show higher-timeframe gaps correctly.
2. Interpret Colors
• Green shading = Gap Up (often acts as support).
• Red shading = Gap Down (often acts as resistance).
3. Watch for Fills
• When price re-enters the gap zone, the indicator checks if it’s “filled” (based on your Touch/Close setting).
• If “Hide When Filled” is on, the zone vanishes.
4. Trade Context
• Many traders use gaps as targets (expecting a fill) or levels of support/resistance.
• Combined with your bull put/bear call spread strategies, it helps confirm strong levels.

MACD + Supertrend + VWAP (Filtered with Background)MACD + Supertrend + VWAP (Filtered with Background)

Howard Intraday Edge (JH Edge) - (VWAP + EMA9/EMA21 + RSI)Howard Intraday Edge (JH Edge)
A disciplined intraday trading system by J. Howard.
Uses VWAP, EMA 9/21, RSI, and Optional EMA 200 to confirm trends and momentum.
Automatically plots Clean stop-loss and take profit levels. Built for SPY 0DTE-5DTE options, but works on other liquid tickers.
Focus: 1-3 high probability trades/day with tight risk control.
Best used on 1 or 3 minute timeframes.

GoldenJet - Cumulative Volume DeltaCumulative Volume Delta (CVD) Indicator - Understand Market Sentiment
Overview
The Cumulative Volume Delta (CVD) indicator will help traders decode market sentiment through volume trends. It provides clear visuals and real-time metrics to reveal the strength and direction of market forces.
Benefits for Traders
Gauge Sentiment: CVD uses colored candlesticks to display buying or selling pressure, making it easy to identify bullish or bearish market moods.
Spot Momentum Shifts: Tracks changes in volume flow to highlight emerging trends or weakening momentum.
Flexible Timeframes: Adjust analysis periods (e.g., intraday or daily) to suit your trading approach.
Real-Time Insights: A table shows live volume flow and its changes, offering a quick view of market dynamics.
Key Features
Customizable Display: Set table position and size (small, medium, large) for a clear chart setup.
Intuitive Visuals: Green (buying) or red (selling) candles for instant sentiment recognition.
Trend Metrics: Indicates rising or falling volume trends and their speed for deeper context.
How to Use
Apply CVD to your TradingView chart for any asset.
Configure timeframe and table settings to match your analysis needs.
Interpret candle colors and table data to assess market sentiment.
Combine with other indicators to validate trend direction.
Why It Helps
CVD empowers traders by revealing volume-driven market sentiment, helping you understand whether buyers or sellers are in control. This insight supports better decision-making across various trading strategies.
