Laguerre Filter Trend Navigator [QuantAlgo]🟢 Overview
The Laguerre Filter Trend Navigator employs advanced polynomial filtering mathematics to smooth price data while minimizing lag, creating a responsive yet stable trend-following system. Unlike simple moving averages that apply equal weight to historical data, the Laguerre filter uses recursive calculations with exponentially weighted polynomials to extract meaningful directional signals from noisy market conditions. Combined with dynamic volatility-adjusted boundaries, this creates an adaptive framework for identifying high-probability trend reversals and continuations across all tradable instruments and timeframes.
🟢 How It Works
The indicator leverages Laguerre polynomial filtering, a mathematical technique originally developed for digital signal processing applications. The core mechanism processes price data through four cascaded filter stages (L0, L1, L2, L3), each applying the gamma coefficient to recursively smooth incoming information while preserving phase relationships. This multi-stage architecture eliminates random fluctuations more effectively than traditional moving averages while responding quickly to genuine directional shifts.
The gamma coefficient serves as the primary smoothing control, determining how aggressively the filter dampens noise versus tracking price movements. Lower gamma values reduce smoothing and increase filter responsiveness, while higher values prioritize stability over reaction speed. Each filter stage compounds this effect, creating progressively smoother output that converges toward true underlying trend direction.
Surrounding the filtered price line, the algorithm constructs adaptive boundaries using dynamic volatility regime measurements. These calculations quantify current market turbulence independently of direction, expanding during active trading periods and contracting during quiet phases. By multiplying this volatility assessment by a user-defined scaling factor, the system creates self-adjusting bands that automatically conform to changing market conditions without manual intervention.
The trend-following engine monitors price position relative to these volatility-adjusted boundaries. When the upper band falls below the current trend line, the system shifts downward to track bearish momentum. Conversely, when the lower band rises above the trend line, it elevates to follow bullish movement. These crossover events trigger color transitions between bullish (green) and bearish (red) states, providing clear visual confirmation of directional changes validated by volatility-normalized thresholds.
🟢 How to Use
Green/Bullish Trend Line: Laguerre filter positioned in upward trajectory, indicating momentum-confirmed conditions favorable for establishing or maintaining long positions (buy)
Red/Bearish Trend Line: Laguerre filter trending downward, signaling regime-validated environment suitable for initiating or holding short positions (sell)
Rising Green Line: Accelerating bullish filter with expanding separation from price lows, demonstrating strengthening upward momentum and increasing confidence in trend persistence with optimal long entry timing
Declining Red Line: Steepening bearish filter creating growing distance from price highs, revealing intensifying downside pressure and enhanced probability of continued decline with favorable short positioning opportunities
Flattening Trends: Horizontal or oscillating filter movement regardless of color suggests directional uncertainty where price action contradicts filter positioning, potentially indicating consolidation phases or impending volatility expansion requiring cautious trade management
🟢 Pro Tips for Trading and Investing
→ Preset Selection Framework: Match presets to your trading style - Scalping preset employs aggressive gamma (0.4) with tight volatility bands (1.0x) for rapid signal generation on sub-15-minute charts, Day Trading preset balances responsiveness and stability for hourly timeframes, while Swing Trading preset maximizes smoothing (0.8 gamma) with wide bands (2.5x) to filter intraday noise on daily and weekly charts.
→ Gamma Coefficient Calibration: Adjust gamma based on market personality - reduce values (0.3-0.5) for highly liquid, fast-moving assets like major currency pairs and tech stocks where quick filter adaptation prevents lag-induced losses, increase values (0.7-0.9) for slower instruments or trending markets where excessive sensitivity generates false reversals and whipsaw trades.
→ Volatility Period Optimization: Tailor the volatility measurement window to information cycles. Deploy shorter lookback periods (7-10) for instruments with rapid regime changes like individual equities during earnings seasons, standard periods (14-20) for balanced assessment across general market conditions, and extended periods (21-30) for commodities and indices exhibiting persistent volatility characteristics.
→ Band Width Multiplier Adaptation: Scale boundary distance to current market phase. Contract multipliers (1.0-1.5) during range-bound consolidations to capture early breakout signals as soon as genuine momentum emerges, expand multipliers (2.0-3.0) during trending markets or high-volatility events to avoid premature exits caused by normal retracement activity rather than authentic reversals.
→ Multi-Timeframe Filter Alignment: Implement the indicator across multiple timeframes, using higher intervals (4H/Daily) to identify primary trend direction via filter slope and lower intervals (15min/1H) for precision entry timing when filter colors align, ensuring trades flow with dominant momentum while optimizing execution at favorable price levels.
→ Alert-Driven Systematic Execution: Configure trend change alerts to capture every filter-validated directional shift from bullish to bearish conditions or vice versa, enabling consistent signal response without continuous chart monitoring and eliminating emotional decision-making during critical transition moments.
Laguerrefilter

[Pandora] Laguerre Ultimate Explorations MulticatorIt's time to begin demonstrations differentiating the difference between known and actual feasibility beyond imagination... Welcome to my algorithmic twilight zone .
INTRODUCTION:
Hot off my press, I present this Laguerre multicator employing PSv6.0, originally formulated by John Ehlers for TASC - July 2025 Traders Tips. Basically I transcended Ehlers' notions of transversal filtration with an overhaul of his Laguerre design with my "what if" Pandora notions included. Striving beyond John Ehlers' original intended design. This action packed indicator is a radically revamped version of his original filter using novel techniques. My aim was to explore whether providing even more enhanced responsiveness and lesser lag is possible and how. Presented here is my mind warping results to witness.
EHLERS' LAGUERRE EXPLAINED:
First and foremost, the concept of Ehlers' Laguerre-izing method deserves a comprehensive deep dive. Ehlers' Laguerre filter design, as it functions originally, begins with his Ultimate Smoother (US) followed by a gang of four LERP (jargon for Linear intERPolation) filters. Following a myriad of cascading LERPs is a window-like FIR filter tapped into the LERP delay values to provide extra smoothness via the output.
On a side note, damping factor controlled LERP filters resemble EMAs indeed, but aren't exactly "periodic" filters that would have a period/length parameter and their subsequent calculations. I won't go into fine-grained relationship details, but EMA and LERP are indeed related in approach, being cousins of similar pedigree.
EXAMINING LAGUERRE:
I focused firstly on US initialization obstacles at Pine's bar_index==0 with nz() in abundance. The next primary notion of intrigue I mostly wondered about was, why are there four LERP elements instead of fewer or more. Why not three or why not two LERPs, etc... 1-4-6-4-1, I remember seeing those coefficients before in high pass filters.
Gathering my thoughts from that highpass knowledge base, I devised other tapped configuration modes to inspect their behavior out of curiosity. Eureka! There is actually more to Laguerre than Ehlers' mind provided, now that I had formulated additional modes. Each mode exhibits it's own lag/smoothness characteristics better than the quad LERPed version. I narrowed it down to a total of 5 modes for exploration. Mode 0 is just the raw US by itself.
ANALYZING FILTER BEHAVIORS:
Which option might be possibly superior, and how may I determine that? Fortunately, I have a custom-built analyzer allowing me to thoroughly examine transient responses across multiple periodicities simultaneously, providing remarkable visual insights.
While Ehlers has meagerly touched upon presenting general frequency responses in his books, I have excelled far beyond that. This robust filter analysis capability enables me to observe finer aspects hidden to others, ultimately leading to the deprecation of numerous existing filters. Not only this, but inventing entirely new species of filtration whether lowpass, highpass, or bandpass is already possible with a thorough comprehensive evaluation.
Revealing what's quirky with each filter and having the ability to discover what filters may be lacking in performance, is one of it's implications. I'm just going to explain this: For example US has a little too much overshoot to my liking, along with nonconformant cutoff frequency compliance with the period parameter. Perhaps Ehlers should inspect US coefficients a bit closer... I hope stating this is not received in an ill manner, as it's not my intention here.
What this technically eludes to is that UltimateSmoother can be further improved, analogous to my Laguerre alterations described above. I will also state Laguerre can indeed be reformulated to an even greater extent concerning group delay, from what I have already discussed. Another exciting time though... More investigative research is warranted.
LAGUERRE CONCLUSIONS:
After analyzing Laguerre's frequency compliance, transient responses, amplitudes, lag, symmetry across periodicities, noise rejection, and smoothness... I favor mode 3 for a multitude of reasons over the mode 4 configuration, but mostly superb smoothing with less lag, AND I also appreciated mode 1 & 2 for it's lower lag performance options.
Each mode and lag (phase shift) damping value has it's own unique characteristics at extremes, yet they demonstrate additional finesse in it's new hybrid form without adding too much more complexity. This multicator has a bunch of Laguerre filters in the overlay chart over many periodicities so you can easily witness it's differing periodic symmetries on an input signal while adjusting lag and mode.
LAGUERRE OSCILLATOR:
The oscillator is integrated into the laguerreMulti() function for the intention of posterity only. I performed no evaluation on it, only providing the code in Pine. That wasn't part of my intended exploration adventure, as I'm more TREND oriented for the time being, focusing my efforts there.
Market analysis has two primary aspects in my observations, one cyclic while the other is trending dynamics... There's endless oscillators, but my expectations for trend analysis seems a little lesser explored in my opinion, hence my laborious trend endeavors. Ehlers provided both indicator facets this time around, and I hope you find the filtration aspect more intriguing after absorption of this reading.
FUNCTION MODULES EXPLAINED:
The Ultimate Smoother is an advanced IIR lowpass smoothing filter intended to minimize noise in time series data with minimal group delay, similar to a traditional biquad filter. This calculation helps to create a smoother version of the original signal without the distortions of short-term fluctuations and with minimal lag, adjustable by period.
The Modified Laguerre Lowpass Filter (MLLF) enhances the functionality of US by introducing a Laguerre mode parameter along side the lag parameter to refine control over the amount of additional smoothing/lag applied to the signal. By tethering US with this LERPed lag mechanism, MLLF achieves an effective balance between responsiveness and smoothness, allowing for customizable lag adjustments via multiple inputs. This filter ends with selecting from a choice of weighted averages derived from a gang of up to four cascading LERP calculations, resulting with smoother representations of the data.
The Laguerre Oscillator is a momentum-like indicator derived from the output of US and a singular LERPed lowpass filter. It calculates the difference between the US data and Laguerre filter data, normalizing it by the root mean square (RMS). This quasi-normalization technique helps to assess the intensity of the momentum on any timeframe within an expected bound range centered around 0.0. When the Laguerre Oscillator is positive, it suggests that the smoothed data is trending upward, while a negative value indicates a downward trend. Adjustability is controlled with period, lag, Laguerre mode, and RMS period.

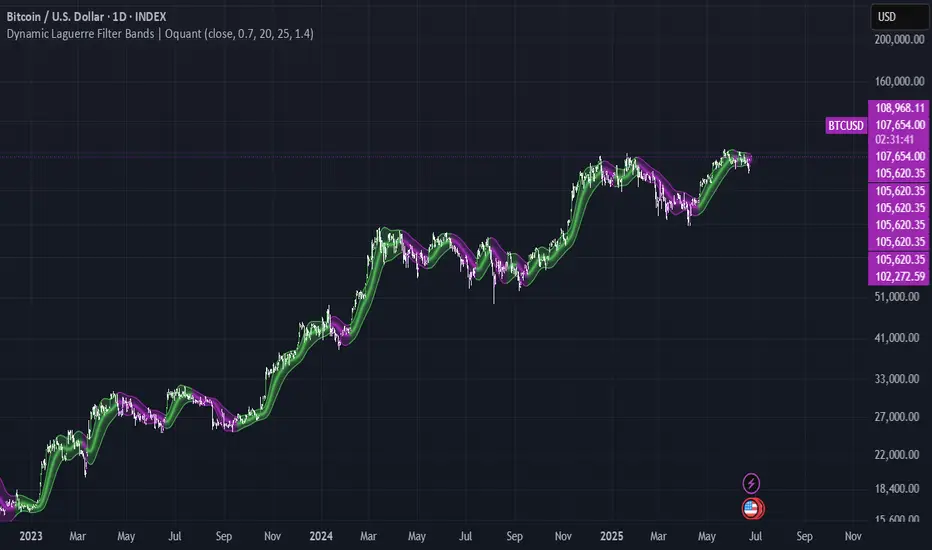
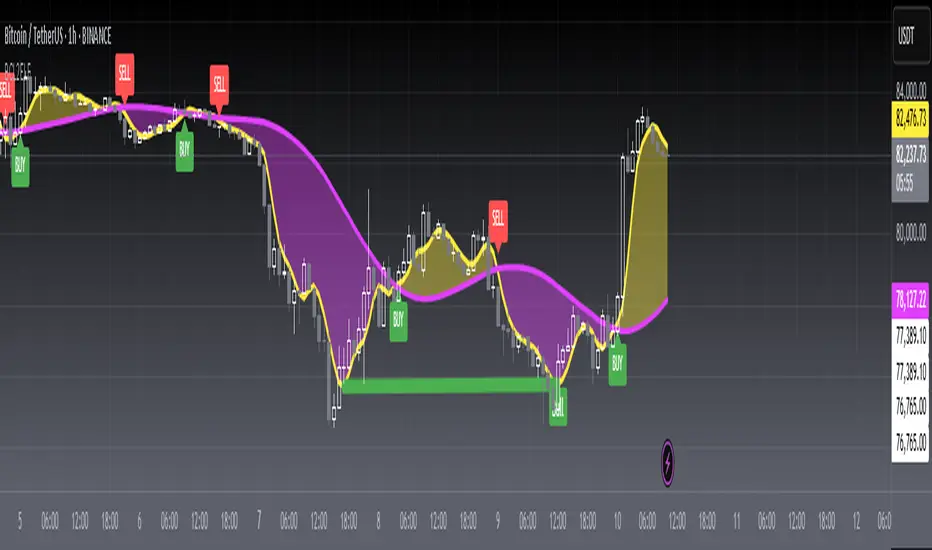
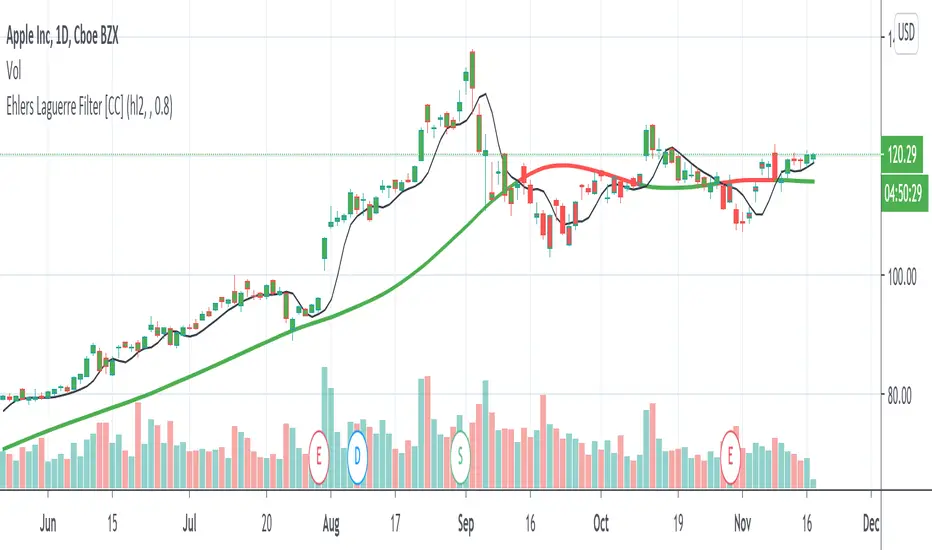
Dynamic Laguerre Filter Bands | OttoThis indicator combines trend-following and volatility analysis by enhancing the traditional Laguerre filter with a dynamic, volatility-adjusted band system. Instead of using fixed thresholds, the bands adapt in real-time to changing market conditions by applying smoothed standard deviation calculations. This design keeps the indicator responsive to significant price movements while effectively filtering out short-term market noise, resulting in more accurate trend identification and breakout signals.
Core Concept
The indicator is built around the following key components:
Laguerre Filter:
The Laguerre filter is designed to smooth out price data by reducing market noise while still being quick enough to detect real changes in price direction. Its goal is to create a clear, smooth trend line that helps traders/investors focus on the overall market trend without getting distracted by small, random price swings.
It uses a parameter called gamma to control how it balances smoothness and responsiveness:
A lower gamma gives more weight to recent price data, making the filter react faster to new price changes. This means the trend line is more sensitive but may also be less smooth and more prone to small fluctuations.
A higher gamma gives more weight to past price data, making the filter smoother and less sensitive to quick changes. This helps reduce noise and produces a steadier trend line, but it also introduces more lag, meaning the filter reacts slower to new price moves.
By adjusting gamma, the Laguerre filter lets you choose the balance between following price changes quickly and having a stable, noise-free trend signal.
Standard Deviation:
shows how much price varies from the mean. In this indicator, it’s used to measure market volatility.
Volatility Bands: The upper and lower bands are based on an EMA-smoothed standard deviation of price. The EMA reduces sudden jumps in volatility, creating smoother and more stable bands that still respond to changing market conditions. These bands are plotted around the Laguerre filter line, expanding and contracting in a controlled way to stay aligned with real market movement while avoiding short-term noise.
Signal Logic:
A long signal is triggered when the close price crosses above the upper band.
A short signal occurs when the close price falls below the lower band.
⚙️ Inputs
Source: Price source used in calculations
Gamma: Adjusts how much the Laguerre filter responds to price changes. Lower gamma values make the filter react more to recent prices, while higher values give more influence to older data, making the line smoother but slower to respond.
Volatility Length: Period used to calculate standard deviation
Volatility Smoothing Length: EMA smoothing length for standard deviation
Multiplier: Scales the width of the bands based on volatility
📈 Visual Output
Laguerre Filter Line: Plots the laguerre filter line, colored dynamically based on signal direction (green for bullish, purple for bearish)
Upper & Lower Bands: Volatility-based bands that adjust with market conditions. (green for bullish, purple for bearish)
Glow Effect: Optional glow layer to enhance visibility of the laguerre filter trend line (green for bullish, purple for bearish)
Bar Coloring: Candlesticks and bar colors reflect the active signal state for fast visual interpretation (green for bullish, purple for bearish)
How to Use
Apply the indicator to your chart and monitor for signal events:
Long Signal: When price closes above the upper band
Short Signal: When price closes below the lower band
🔔 Alerts
This indicator supports optional alert conditions you can enable for:
Long Signal: Close price crossing above the upper band
Short Signal: Close price crossing below the lower band
⚠️ Disclaimer:
This indicator is intended for educational and informational purposes only. Trading/investing involves risk, and past performance does not guarantee future results. Always test and evaluate indicators/strategies before applying them in live markets. Use at your own risk.
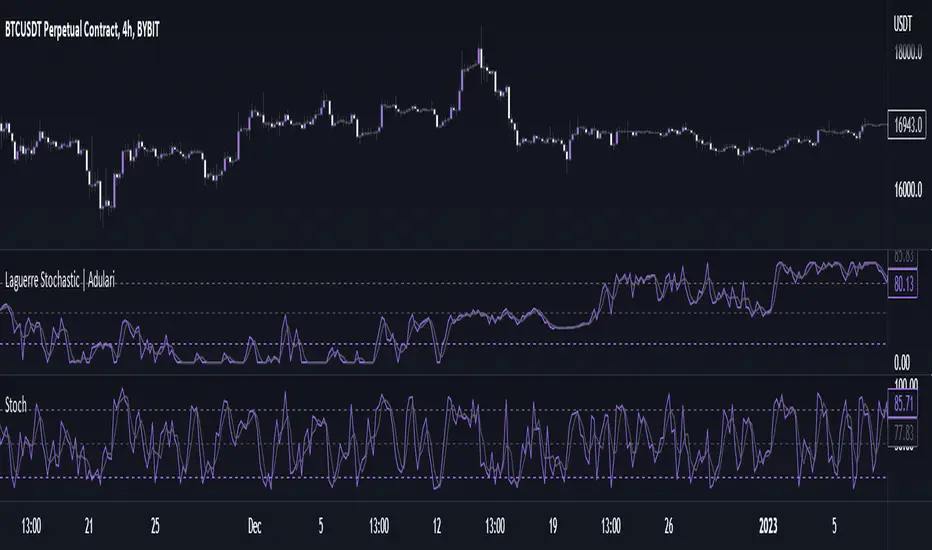
Laguerre Stochastic | AdulariDescription:
The Laguerre Stochastic is similar to a 4-period regular Stochastic, except that a Laguerre transform has been applied for price smoothing. The Laguerre transform is a mathematical technique that allows smooth indicators to be built using small amounts of data.
How do I use it?
Never use this indicator as standalone trading signal, it should be used as confluence.
When the value is above the middle line this shows the bullish trend is strong.
When the value is below the middle line this shows the bearish trend is strong.
When the value crosses above the upper line this indicates the trend may reverse downwards.
When the value crosses below the lower line this indicates the trend may reverse upwards.
When the value crosses above the signal this indicates the current bearish trend is getting weak and may reverse upwards.
When the value crosses below the signal this indicates the current bullish trend is getting weak and may reverse downwards.
Features:
Oscillator value indicating the difference between highs and lows fractioned by the close price.
%D value acting as a smoothed version of the %K.
Horizontal lines such as oversold, overbought and middle lines, indicating possible interest zones.
How does it work?
1 — Calculate regular Stochastic value.
2 — Apply the Laguerre transform.
3 — Calculate %D value by applying smoothing to the %K value.
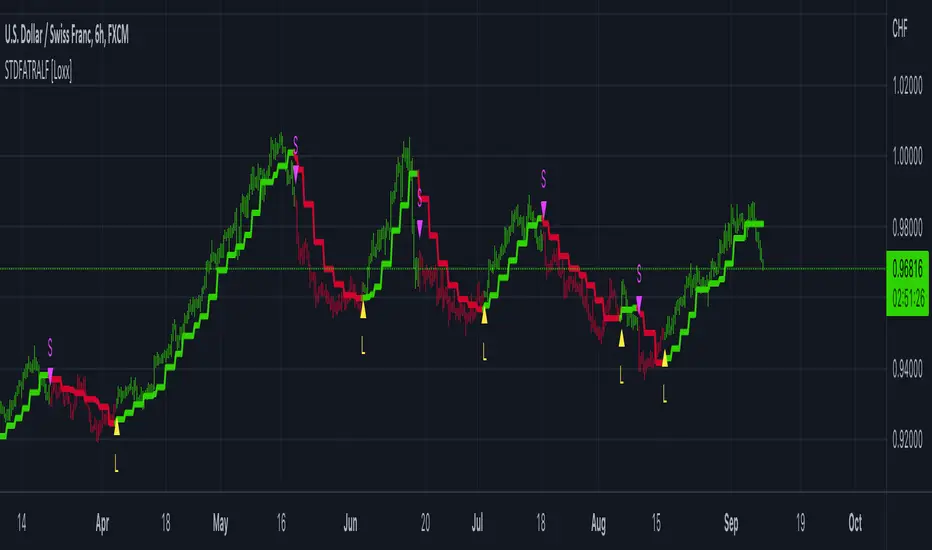
STD-Filtered, ATR-Adaptive Laguerre Filter [Loxx]STD-Filtered, ATR-Adaptive Laguerre Filter is a standard Laguerre Filter that is first made ATR-adaptive and the passed through a standard deviation filter. This helps reduce noise and refine the output signal. Can apply the standard deviation filter to the price, signal, both or neither.
What is the Laguerre Filter?
The Laguerre RSI indicator created by John F. Ehlers is described in his book "Cybernetic Analysis for Stocks and Futures". The Laguerre Filter is a smoothing filter which is based on Laguerre polynomials. The filter requires the current price, three prior prices, a user defined factor called Alpha to fill its calculation. Adjusting the Alpha coefficient is used to increase or decrease its lag and it's smoothness.
Included:
Bar coloring
Signals
Alerts
Loxx's Expanded Source Types
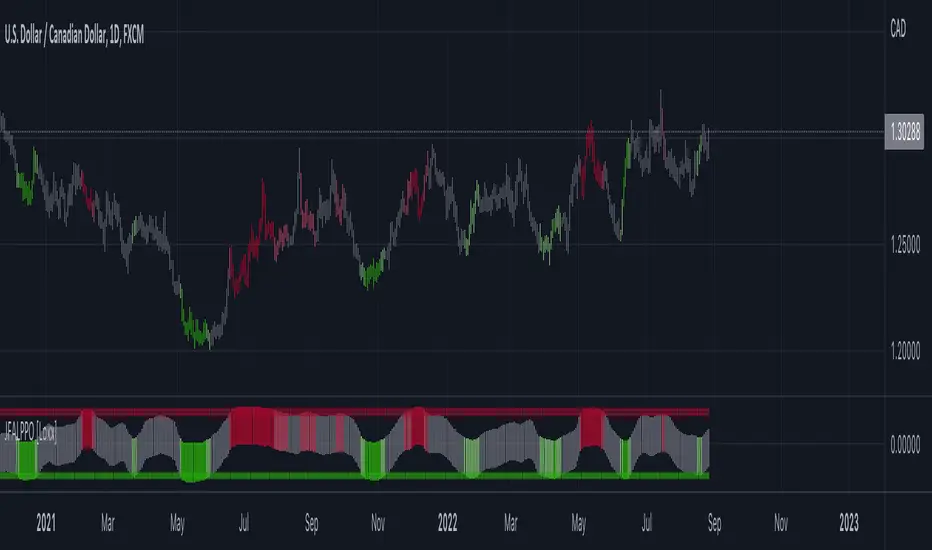
Jurik-Filtered, Adaptive Laguerre PPO [Loxx]Jurik-Filtered, Adaptive Laguerre PPO is an indicator used to find reversals. Smoothing with a Jurik Filter reduces noise and better identifies reversal points.
What is Laguerre Filter?
The Adaptive Laguerre is based on the Laguerre filter, described by John Ehlers in his paper “Time Warp – Without Space Travel”. It applies a variable gamma factor, based on how well the filter is tracking previous price movement. As with other adaptive moving averages, the Adaptive Laguerre tracks trending markets closely but will see less changes in range-bound markets.
The Adaptive Laguerre filter allows for an adjustment of the simple Laguerre filter. When price moves away from the filter, it becomes faster. When price moves sideward, the filter gets slower. Accordingly, this indicator belongs to the same class of moving average as the Kaufman Adaptive Moving Average (KAMA). It similar to the Volatility Index Dynamic Average (VIDYA) developed by Tushar Chande. The Adaptive Laguerre filter is smoother than the VIDYA and will adjust slower to price action after consolidations.
What is Jurik Volty?
One of the lesser known qualities of Juirk smoothing is that the Jurik smoothing process is adaptive. "Jurik Volty" (a sort of market volatility ) is what makes Jurik smoothing adaptive. The Jurik Volty calculation can be used as both a standalone indicator and to smooth other indicators that you wish to make adaptive.
What is the Jurik Moving Average?
Have you noticed how moving averages add some lag (delay) to your signals? ... especially when price gaps up or down in a big move, and you are waiting for your moving average to catch up? Wait no more! JMA eliminates this problem forever and gives you the best of both worlds: low lag and smooth lines.
Ideally, you would like a filtered signal to be both smooth and lag-free. Lag causes delays in your trades, and increasing lag in your indicators typically result in lower profits. In other words, late comers get what's left on the table after the feast has already begun.
Included:
-Toggle on/off bar coloring
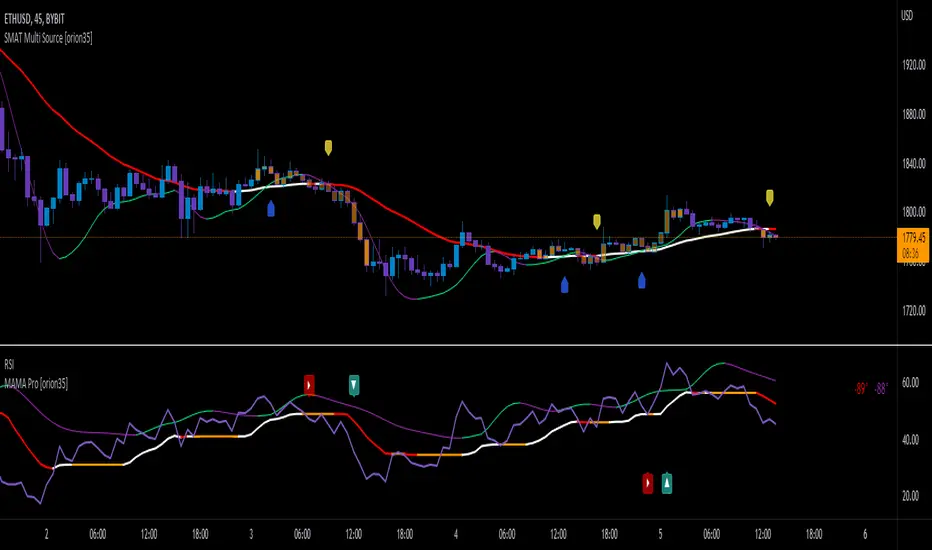
Super Moving Average Tools [orion35]
This indicator has been developed to cover almost all types of moving averages (MA) used in the market. Two of the 21 MA tools can be drawn independently on the price chart.
These MA tools include traditional averages such as SMA , EMA , DEMA , as well as innovative averaging tools such as LFS (Laguerre Filter Smoother), LSMA (Least Square Moving Average), ZLSMA (Zerolag LSMA ) developed by @veryfid and SSMA (Super Smoothed Moving Average ) by John F. Ehlers .
In addition, the traditional bar opening or closing values can be drawn on the chart as a source, as well as the data produced by a different indicator (for example, RSI ) can be used to calculate the average with this indicator and can be plotted on that oscillator. The chart above shows the drawings made on both the price bars and the RSI oscillator.
If desired, the intersections of the plotted curves can be showed as signals. Also, alarms have been added according to the intersection conditions.
Another great feature of this indicator is that signals can be filtered according to the instant ADX (Average Directional Movement indeX) value of the market. By using this filter, false signals in horizontal markets can be reduced . Also, with the threshold value setting in the ADX filter, calibration can be made for different assets and time frames when desired.
In addition, when desired, the data of different indicators drawn by using the "Raw Source" option can be intersected.
You can also write the combinations you like from the different MA tools and settings you use as a comment below.
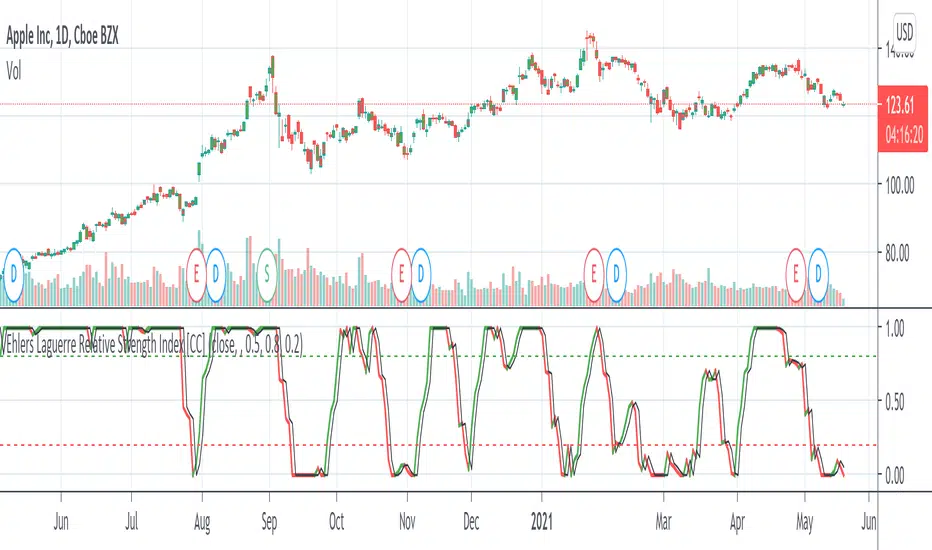
Ehlers Laguerre Relative Strength Index [CC]The Laguerre Relative Strength Index was created by John Ehlers and this is essentially his version of the RSI but I find that the buy and sell signals work better with his version as you can see. Buy when the line turns green and sell when the line turns red.
Let me know if there are any other indicators you want me to publish!
[blackcat] L2 Ehlers Laguerre FilterLevel: 2
Background
John F. Ehlers introuced Laguerre Filter in his "Cybernetic Analysis for Stocks and Futures" chapter 14 on 2004.
Function
The Laguerre transform can be represented as an exponential moving average (EMA) low-pass filter (the first term) followed by a succession of allpass elements instead of unit delays (the k − 1 terms). All terms have exactly the same damping factor γ (gamma). We see that these are all pass networks by examining the frequency response. Dr. Ehlers made a filter using the Laguerre elements instead of the unit delay, whose coefficients are also /6 as with the FIR filter. The difference is that we have warped the time between the delay line
taps.
Key Signal
FIR ---> Laguerre Filter fast line
Filt ---> Laguerre Filter slow line
Pros and Cons
100% John F. Ehlers definition translation of original work, even variable names are the same. This help readers who would like to use pine to read his book. If you had read his works, then you will be quite familiar with my code style.
Remarks
The 33th script for Blackcat1402 John F. Ehlers Week publication.
Readme
In real life, I am a prolific inventor. I have successfully applied for more than 60 international and regional patents in the past 12 years. But in the past two years or so, I have tried to transfer my creativity to the development of trading strategies. Tradingview is the ideal platform for me. I am selecting and contributing some of the hundreds of scripts to publish in Tradingview community. Welcome everyone to interact with me to discuss these interesting pine scripts.
The scripts posted are categorized into 5 levels according to my efforts or manhours put into these works.
Level 1 : interesting script snippets or distinctive improvement from classic indicators or strategy. Level 1 scripts can usually appear in more complex indicators as a function module or element.
Level 2 : composite indicator/strategy. By selecting or combining several independent or dependent functions or sub indicators in proper way, the composite script exhibits a resonance phenomenon which can filter out noise or fake trading signal to enhance trading confidence level.
Level 3 : comprehensive indicator/strategy. They are simple trading systems based on my strategies. They are commonly containing several or all of entry signal, close signal, stop loss, take profit, re-entry, risk management, and position sizing techniques. Even some interesting fundamental and mass psychological aspects are incorporated.
Level 4 : script snippets or functions that do not disclose source code. Interesting element that can reveal market laws and work as raw material for indicators and strategies. If you find Level 1~2 scripts are helpful, Level 4 is a private version that took me far more efforts to develop.
Level 5 : indicator/strategy that do not disclose source code. private version of Level 3 script with my accumulated script processing skills or a large number of custom functions. I had a private function library built in past two years. Level 5 scripts use many of them to achieve private trading strategy.
KINSKI Laguerre Filter WaveThe "Laguerre Filter Wave" Indicator usually shows market cycles and is a perfect fit for swing traders who trade with market fluctuations. Upward-trends are shown as green lines and optional bands. Downward trends are represented by the color red. Each of the 18 available lines can be adjusted to your own preferences via a gamma factor.
You also have the following display options:
- "Up/Down Movements: On/Off" - Shows ascending and descending of lines
- "Bands: On/Off" - Fills the space between the lines with colors to indicate up or down trends
- "Bands: Transparency" - sets the transparency of the fill color
- "MA Line: Size" - sets the width of the lines
- "MA Line: Transparency" - sets the transparency of the lines

Ehlers Laguerre Filter [CC]The Laguerre Filter was created by John Ehlers (Cybernetic Analysis For Stocks And Futures pg 216) and this indicator works well with letting you know both the short and long term trend as well as a pretty good moving average. If the indicator line is above the black line then it is a long term uptrend and below the black line is a long term downtrend. Buy when the indicator line is green and sell when it turns red.
Let me know if there are other scripts you would like to see me publish or if you want something custom done!
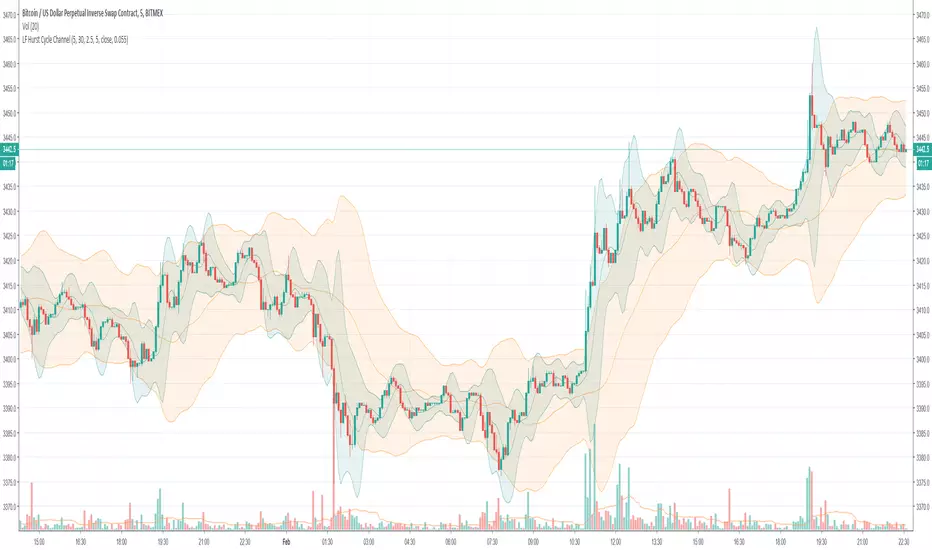
Laguerre Filtered Hurst Cycle Channel [rumpypumpydumpy]Experiment in using a Laguerre filter on Hurst Cycle Channels.
Default settings may not be a good price fit!
Increasing the gamma value increases the degree of smoothing from the laguerre filter :
Adaptive Laguerre FilterAdaptive Laguerre Filter indicator script.
The Adaptive Laguerre Filter was originally developed and described by John Ehlers in his paper `Time Warp – Without Space Travel`.
Thanks to @apozdnyakov for the sorting solution.

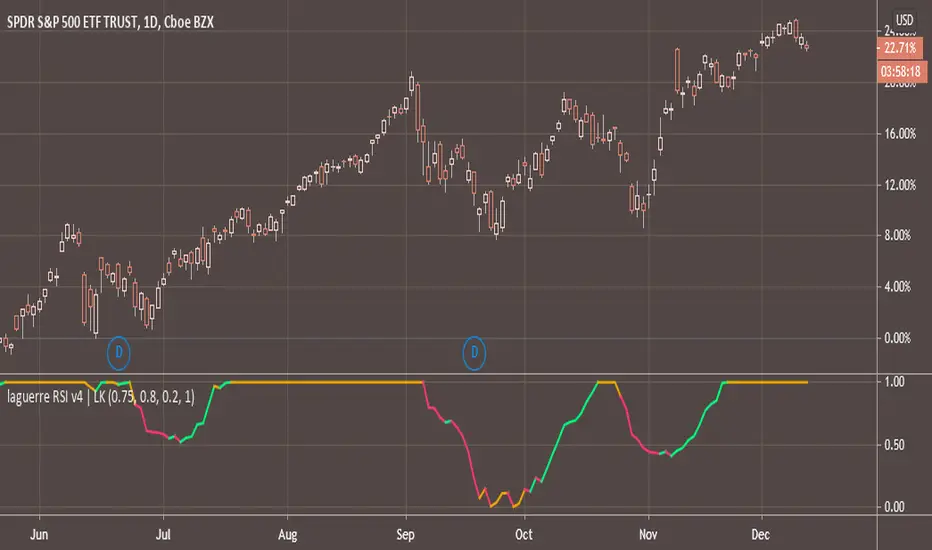
FREE INDICATOR: Laguerre RSIAbout:
Averages, and the way they are compared and calculated make up a large amount of the indicators out there, so the fun thing about new averages, is how they open up a whole new group of indicators.
Usage:
This is Laguerre RSI. You'll notice it acts a little different than your normal RSI, and it can be traded in different ways. It can be used as a switch, or to view bursts of momentum. Combine with your style and see if you notice anything. It might just be what you were looking for! Stay tuned for more scripts & ideas by following me on TradingView.
Grab the source code here: pastebin.com
Installation video by @ChrisMoody here : blog.tradingview.com
░░░░░░░░░░░░░░░ Feel free to follow me to keep up with my latest scripts! ░░░░░░░░░░░░░░░
░░░░░░░░░░░░ PLEASE THUMB UP OR STAR IF YOU LIKE THIS INDICATOR! ░░░░░░░░░░░░
I'd like as many people as possible to get it :)