Anchored Powered KAMA [LuxAlgo]The Anchored Powered KAMA tool is a new flavor of the famous Kaufman's Adaptive Moving Average (KAMA).
It adds 5 different anchoring periods, a power exponent to the original KAMA calculation to increase the degree of filtering during ranging trends, and standard deviation bands calculated against the KAMA itself.
🔶 USAGE
In the image above we can see the different parts of the tool, it displays the Anchored Powered KAMA surrounded by standard deviation bands at 2x (solid) and 1x (dashed) by default.
This tool provides a simple and easy way to determine if the current market is ranging or trending and where the market extremes are in the current period.
As a rule of thumb, traders may want to trade extremes in ranges and pullbacks in trends.
When the KAMA is flat, a range is in place, so traders may want to wait for the price to reach an extreme before opening a trade in the other direction.
Conversely, if the KAMA is moving up or down, a trend is in place and traders may want to wait for the price to pull back to the KAMA before opening a trade in the direction of the trend.
🔹 Anchor Period
On the above chart, we can see different anchor periods on different chart timeframes.
This option is very useful for those traders who use multi-timeframe analysis, allowing them to see how the market behaves over different timeframes.
The valid values for this parameter are:
Hourly
Daily
Weekly
Monthly
Yearly
The tool has a built-in Auto feature for traders convenience, it automatically selects the optimal Anchor Period in function of the chart timeframe.
timeframes up to 2m: Hourly
timeframes up to 15m: Daily
timeframes up to 1H: Weekly
timeframes up to 4H: Monthly
larger timeframes: Yearly
🔹 Choosing the Right Anchor Period
In the chart above we can see the custom error message that the tool displays when the Auto feature is disabled and the Anchor Period is too large for the current chart timeframe.
Traders can select a smaller Anchor Period or a larger chart timeframe for the tool to display correctly.
🔶 DETAILS
The tool uses Welford's algorithm to calculate the KAMA's standard deviation, then plots the outer bands at the multiplier specified in the settings panel, and the inner bands at the multiplier specified minus 1.
🔹 Power Exponent
The graph above shows how different values of this parameter can affect the output.
To display the original KAMA a value of 1 must be set, by default this parameter is set to 2.
The higher the value, the better the tool's ability to detect ranges.
🔶 SETTINGS
Anchor Period: Select up to 5 different time periods from Hourly, Daily, Weekly, Monthly, and Yearly.
Source: Choose the source for all calculations.
Power Exponent: Fine-tune the KAMA calculation, a value of 1 will output the original KAMA, and is set to 2 by default.
Band Multiplier: Select the multiplier for the standard deviation bands.
Kaufmans

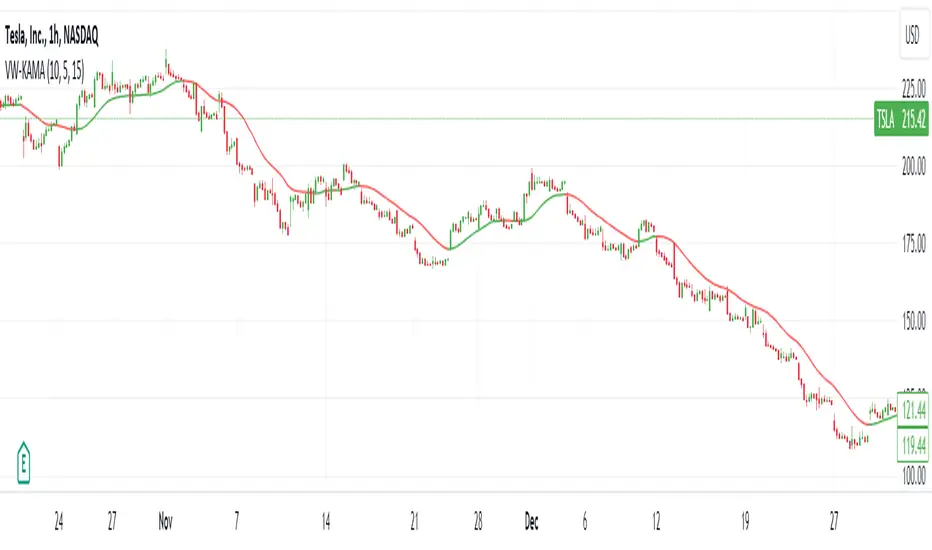
Volume-Weighted Kaufman's Adaptive Moving AverageThe Volume-Weighted Kaufman's Adaptive Moving Average (VW-KAMA) is a technical indicator that combines the Volume-Weighted Moving Average (VWMA) and the Kaufman's Adaptive Moving Average (KAMA) to create a more responsive and adaptable moving average.
Advantages:
Volume-Weighted: It takes into account the volume of trades, giving more weight to periods with higher trading volume, which can help filter out periods of low activity.
Adaptive: The indicator adjusts its smoothing constant based on market conditions, becoming more sensitive in trending markets and less sensitive in choppy or sideways markets.
Versatility: VW-KAMA can be used for various purposes, including trend identification, trend following, and determining potential reversal points and act as dynamic support and resistance level.
All for One Moving AverageThis is a collection of all the moving averages available. Some are built-in, a couple were tricky to source out.
Higher timeframes can be specified so you aren't limited to your chart setting.
Repainting has been disabled by default.
There is also an option to use Heikin Ashi candles as the input source rather than standard bars.
Hope that someone finds this useful.
If you'd like anything added please DM me and I'll include it!
Feel free to copy this into your own strategies/indicators.
~Dark

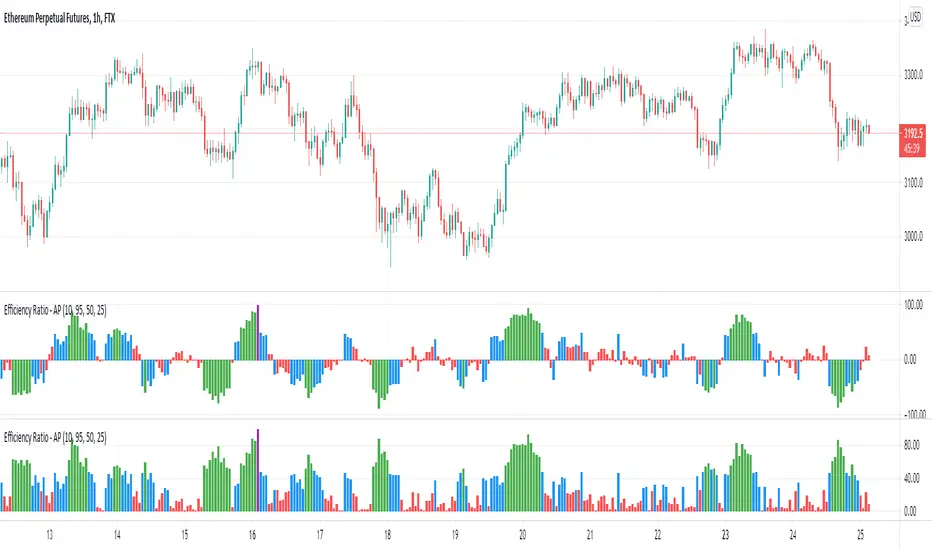
Efficiency Ratio (Market Noise) by Alejandro PThis is an indicator based on the Efficiency Ratio by Perry Kaufman. Like Price Density, which we have published previously, Perry Kaufman's Efficiency Ratio is a quantifiable method of measuring market noise.
This version of the indicator includes a feature to make the values of the indicator change based on thresholds to easier visualize different market conditions. Additionally there is a directional feature which factors in the direction of the price moves.
We can use the Efficiency Ratio to set rules and only trade particular systems when noise is at an appropriate level. For example, if noise is high then we would want to avoid trend following strategies and instead trade mean-reversion strategies, and vice-versa when the opposite is true.
The Efficiency Ratio can also be used to match assets to strategies. Some assets will be naturally more noisy than others and therefore we might have a principle where we only trade those noisy assets with our mean reversion strategies and the more quiet assets with trend following strategies.
Calculation:
Efficiency Ratio = Absolute net change in close price / absolute sum of the individual close price changes
The numerator looks at the absolute close change in price. It subtracts the starting close price in the period from the final close price in the period. The denominator compares the close price of one bar to the close price of the previous bar, this is performed for each of the successive bars in the whole period and then the value is summed. The absolute price is used because there are positive and negative values because each bar may close above or below the previous bar close.
The Efficiency Ratio provides an opposite interpretation of market noise compared to Price Density. With Price Density high values = high noise and low values = low noise. With the Efficiency Ratio high values = low noise and low values = high noise.
Comparing Price Density to Perry Kaufman's Efficiency Ratio:
Similarities
Both use the sum of the individual bar moves
- Price Density - High - Low
- Efficiency Ratio - Close to Close
Differences
Price Density uses the full price range (to determine the height of the box)
Efficiency Ratio uses the net close price change over the period
The interpretation of the values is the reverse for each
Full credits to the source of the above information and interpretation.
Indicator: Price Speed/Acceleration [xQT5]This is method of analizing impulse and change price speed from a book of "Trading Systems and Methods" (Wiley Trading) 6th Edition by Perry J. Kaufman.
I just added personal name, moving average and accumulation for better reading the market.
Enjoy it!

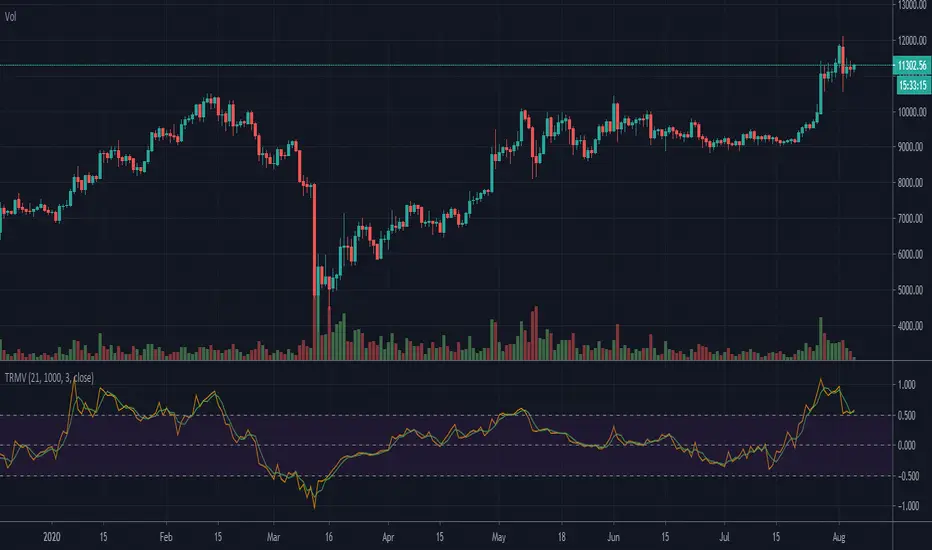
Indicator: True Range Momentum Volume [xQT5]This is original indicator from a book of "Trading Systems and Methods" (Wiley Trading) 6th Edition by Perry J. Kaufman.
I just added a signal line, correction value and borders for a better look of analizing market.
Enjoy it!
Indicator: Strength Oscillator [xQT5]This is original indicator from a book of "Trading Systems and Methods" (Wiley Trading) 6th Edition by Perry J. Kaufman.
I just added a signal line and borders for a better look of analizing market.
Enjoy it!

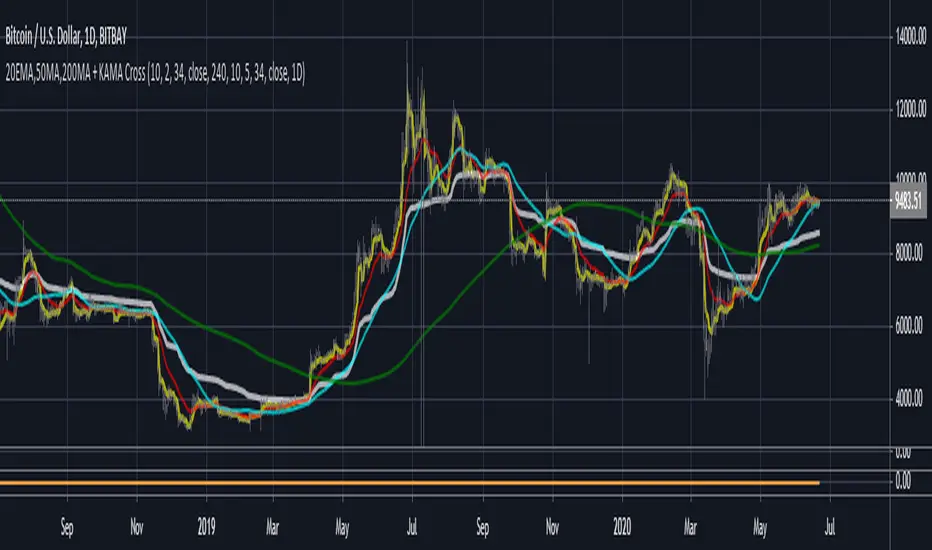
3MA'S + KAMA Trend (20EMA,50MA,200MA + KAMA Trend)This indicator, combines the traditional FOREX moving averages (20EMA, 50ma, 200ma) into a single indicator with
an adaptive moving average (AMA) taken from a user defined timeframe to show trend direction (by default, it plots
the daily 10/2/34 KAMA overlayed on any timeframe chart.
An AMA moves slowly when markets are sideways but swiftly during periods of volatility as a result it reacts much fast than
traditional options for moving average trends.
If the price is above the KAMA, trend is up. Below the KAMA, trend is down.