Divergence Scanner
Scanner and Indication (Divergence Scanner & Signal)An advanced experimental indicator designed to detect instances of Divergence between price action and key oscillator metrics (e.g., RSI or MACD).The primary function of this script is for Screener use. It plots a numerical value (a value greater than zero) on the chart when a confirmed bullish or bearish divergence signal appears."
K-macd

MACD Divergence Pro | Zero-Lag • No-Repaint中文介绍
MACD 背离 · 快速实时 / 不重绘 · 基于直方图(CN)
多数“MACD 背离”指标要么重绘严重(回测很漂亮、实盘不靠谱),要么触发很滞后(等几根 K 线后才给线/给提醒)。
这个脚本是我在十几版迭代中打磨出的方案(还是跟我的印度导师):在保持收盘级别不重绘的同时,尽可能把信号“提前到条内”,并且把“提前”和“稳健”两种需求拆开、让你按场景选择。
这款脚本为什么更好?
双模式,实盘&回测都可靠
确认模式(不重绘):只在枢轴成立时(上一根确认为顶/底)画线并提醒,收盘后不会改变,适合回测与稳健交易。
预判预览(零延迟,可选):条内一旦出现“价格创更高/更低而柱值更低/更高”的背离形态,就即时画“临时预判线”并提醒;如果形态被否定,会在本根内自动撤回。该模式给你“更早的入场观察”,但可能被取消。
基于 MACD 直方图:直接比较“柱值高/低”和“价格高/低”,不靠模糊的平滑线,背离定义清晰、可见性强。
多重背离/三背离:支持向前连接多段峰/谷,不是只找最近一段,把分层背离也抓出来。
分段规则可控
同侧最小间隔(柱):避免“同一段内频繁连线”。
可选“跨色分段(红→绿→红 / 绿→红→绿)”:只在真正换势后才允许下一段,显著减少“同色内伪背离”。
即时提醒,严格对齐
预判提醒:只有当图表上真的画出了“临时预判线”时才触发,不会“响了但没线”。
确认提醒:当正式背离线落地的那一刻触发,用于“信号确认”。
视觉简洁:顶背离线=红色,底背离线=绿色;标签可开关,不挡柱不抢视线。
通用:适配任意周期、任意交易品种;参数默认即可用,也可按策略微调。
如何使用(建议)
做回测/稳健交易:仅开“确认提醒”,并把“即时模式(条内)”关闭,得到严格不重绘的标注与提醒。
做超短线/埋伏:打开即时模式 + 零延迟预览,启用预判提醒;当预判线出现就会立马提醒(未确认时可能被撤回)。
如想减少“跨段过远”的连线,可调大同侧最小间隔或打开跨色分段。
需要三背离/多背离,可把“最多向前连接几段”设为 3 或更高。
提示:预判是“更早但可能被否定”,确认是“稳健且不重绘”。两者结合,既看得早,也落得稳。
English Description
MACD Divergence • Fast Live / No-Repaint • On Histogram
Most “MACD divergence” indicators either repaint heavily (great in hindsight, unreliable in live trading) or lag badly (you get lines/alerts several bars late).
This script has gone through 10+ iterations to strike the right balance: deliver earlier signals in real-time while keeping a truly no-repaint confirmation path. You decide when you need early preview or strict confirmation.
What makes it different?
Two operating modes—choose per scenario
Confirmation mode (No-Repaint): Lines/alerts are printed only when the pivot is confirmed (previous bar), and they never change after close. Perfect for backtesting and conservative trading.
Zero-Lag Preview (optional): As soon as an in-bar divergence forms on the histogram (price makes a higher high/lower low while the bar value fails), a temporary preview line is drawn immediately and an alert is fired; if invalidated before the bar closes, it’s removed. Earlier visibility with the right caveat.
Histogram-based logic: We compare bar heights against price highs/lows—clear definition and strong visual readability.
Multi-link divergences (incl. triple): Not limited to the nearest swing—you can extend lines across multiple prior pivots to capture stacked divergences.
Controllable segmentation
Minimum bars between same-side pivots to avoid noisy over-linking.
Optional cross-color segmentation (red→green→red / green→red→green) to reduce false divergences within a same-color run.
Alerts that match what you see
Preview alert fires only when a preview line is actually drawn—no more alerts without lines.
Confirmation alert fires when the final line is committed.
Clean visuals: Bearish lines = red, Bullish lines = green; labels are optional to keep the histogram unobstructed.
Works everywhere: Any symbol, any timeframe. Defaults are sensible; parameters can be tuned to your workflow.
Suggested workflow
Backtest / conservative execution: Use Confirmation alerts only, turn Live (in-bar) evaluation off to ensure strict no-repaint behavior.
Scalping / early entries: Turn Live mode + Zero-Lag Preview on and enable Preview alerts—you’ll be notified the moment a preview line appears (it may retract before close).
Increase Min same-side spacing or enable Cross-color segmentation to limit stretched links.
Raise Max links to capture double/triple divergences.
TL;DR: Preview = earlier but retractable. Confirmation = slower but rock-solid. Combine both to see early and act with confidence.

Divergence Detector (MACD + Volume)Divergence Detector (MACD + Volume Confirmation)
This indicator automatically detects bullish and bearish divergences between price and MACD, enhanced with volume confirmation to filter out weak signals.
🔹 Core Logic
Pivot Detection:
The script identifies swing highs and lows (pivots) using customizable left/right lookback values.
Bullish Divergence:
Occurs when price makes a lower low, but MACD makes a higher low.
A label "Bull Div" appears below the bar; if confirmed by high volume, it shows "Bull Div 🔥".
Bearish Divergence:
Occurs when price makes a higher high, but MACD makes a lower high.
A label "Bear Div" appears above the bar; if confirmed by high volume, it shows "Bear Div 📉".
Volume Confirmation:
The indicator checks whether the volume at the pivot bar is above the moving average of volume (customizable length).
This ensures that divergence signals are backed by strong market participation.
Inputs
MACD Fast/Slow/Signal Length – standard MACD parameters
Pivot Lookback Left/Right – defines the swing structure sensitivity
Volume MA Length – defines how volume strength is validated
Output
Labels:
🔹 Bull Div / Bull Div 🔥 → Bullish divergence (confirmed with volume)
🔹 Bear Div / Bear Div 📉 → Bearish divergence (confirmed with volume)
Tips
Works best on higher timeframes and trending markets.
Volume confirmation helps filter false divergences in low liquidity conditions.
Combine with trend or structure indicators for better trade setups.
----------------------------------------------------------------------------------------------
اندیکاتور شناسایی واگرایی MACD با تأیید حجم
این اندیکاتور بهصورت خودکار واگراییهای صعودی و نزولی بین قیمت و MACD را شناسایی کرده و با استفاده از تأیید حجم (Volume Confirmation) سیگنالهای ضعیف را فیلتر میکند.
🔹 منطق عملکرد
شناسایی پیوتها:
نقاط چرخش (سقف و کف) با استفاده از تعداد کندلهای قابل تنظیم در دو سمت شناسایی میشوند.
واگرایی صعودی (Bullish):
زمانی که قیمت کف پایینتر و MACD کف بالاتر میسازد.
برچسب "Bull Div" در زیر کندل نمایش داده میشود؛ اگر حجم بالا باشد، با علامت 🔥 مشخص میگردد.
واگرایی نزولی (Bearish):
زمانی که قیمت سقف بالاتر و MACD سقف پایینتر میسازد.
برچسب "Bear Div" در بالای کندل نمایش داده میشود؛ اگر حجم بالا باشد، با 📉 مشخص میگردد.
تأیید حجم:
اگر حجم در کندل پیوت بالاتر از میانگین متحرک حجم باشد، سیگنال معتبرتر در نظر گرفته میشود.
تنظیمات ورودی
تنظیمات MACD (Fast, Slow, Signal)
پارامترهای شناسایی پیوت (Left / Right)
طول میانگین متحرک حجم (Volume MA Length)
خروجیها
Bull Div 🔥 / Bear Div 📉 برای واگراییهای تأییدشده با حجم
Bull Div / Bear Div برای واگراییهای بدون تأیید حجم
نکات کاربردی
بهترین عملکرد در تایمفریمهای بالا و بازارهای دارای روند
تأیید حجم به حذف سیگنالهای اشتباه در شرایط حجم پایین کمک میکند
برای دقت بیشتر، آن را با اندیکاتورهای روند یا ساختار ترکیب کنید
⚠️ Disclaimer:
This script is provided for educational and informational purposes only.
It does not constitute financial advice, and the author is not responsible for any financial losses caused by its use.
Always confirm signals with your own analysis and other tools before making trading decisions.
⚠️ توجه:
این اسکریپت صرفاً جهت آموزش و اطلاعرسانی طراحی شده و توصیه مالی یا سرمایهگذاری محسوب نمیشود.
نویسنده مسئول هیچگونه ضرر یا زیان احتمالی ناشی از استفاده از آن نیست.
لطفاً پیش از هر تصمیم معاملاتی، تحلیل شخصی خود را انجام داده و از این ابزار در کنار سایر ابزارهای تحلیل و مدیریت ریسک استفاده کنید.

Dual MACD AccelerationDual MACD Acceleration Indicator – Synopsis
Purpose:
This indicator identifies early momentum shifts in the market by comparing a fast MACD (8/20/6) with a slower MACD (12/26/9). It highlights potential strong buy and sell signals when the faster MACD crosses the slower MACD, allowing traders to catch trend accelerations before the full move develops.
Components
Fast MACD (8/20/6)
Responds quickly to short-term price changes.
Detects early momentum shifts.
Slow MACD (12/26/9)
Captures the dominant trend.
Provides a smoother reference for comparison.
Acceleration Signals
Long (▲): Fast MACD crosses above Slow MACD → potential bullish acceleration.
Short (▼): Fast MACD crosses below Slow MACD → potential bearish acceleration.
Zero Line
Optional visual reference for overall trend direction.
Crosses above zero = bullish trend, below zero = bearish trend.
Key Features
Clean, minimal chart display.
Optional toggles to show/hide each MACD line.
Label markers indicate crossovers.
Built-in alert conditions for automated notifications.
Trading Use
Trend Confirmation:
Best used with higher timeframe filters (VWAP or EMAs) to avoid fakeouts.
Entry Timing:
Enter on the first pullback after a crossover signal.
Only trade in the direction of the dominant trend.
Stops & Risk:
Use recent swing lows/highs for stop placement.
TP levels can be structure-based or trailing with price momentum.
Synopsis Summary:
The Dual MACD Acceleration Indicator is a lightweight, early-momentum tool designed for scalpers and short-term traders. It captures fast shifts in trend by comparing a faster and slower MACD, highlighting strong buy and sell opportunities while remaining clean and easy to read. For higher accuracy, combine with trend filters like VWAP or EMAs.

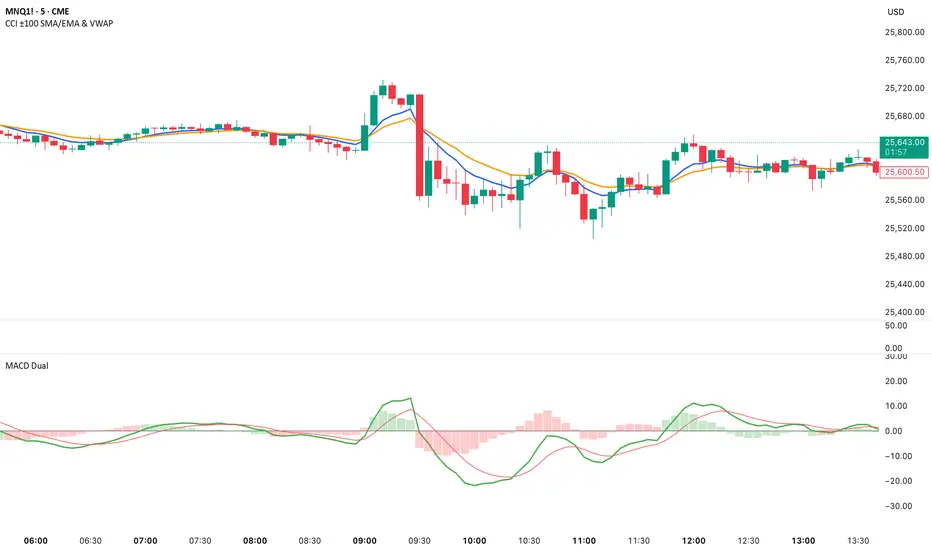
Dual MACD📘 Dual MACD — Synopsis
The Dual MACD indicator displays two separate MACD systems inside the same pane, allowing traders to compare fast and slow momentum behavior simultaneously.
What It Includes
Two fully adjustable MACDs
MACD 1 default: 12 / 12 / 9
MACD 2 default: 8 / 20 / 6
Show/Hide Toggles so each MACD can be viewed independently or together.
MACD Lines, Signal Lines, and Histograms for both systems.
Clean layout with a compact panel title: “MACD x2”
What It Helps You See
Short-term vs. longer-term momentum shifts
Faster MACD reacting to quick trend changes
Slower MACD confirming or filtering signals
Trend strength, momentum acceleration, and crossover behavior in a single pane
Why It’s Useful
The Dual MACD gives you momentum confirmation, fakeout filtering, and multi-speed trend insight—making it valuable for scalpers, intraday traders, and swing traders who want to reduce noise and improve signal quality.
KLS Ultimate V.1"KLS Ultimate V.1" is a meticulously designed trading indicator. It is built specifically for "Scalpers" (traders who want quick in-and-out profits).
**🚀 How it Works: The 3-Level Logic**
This indicator doesn't just rely on one tool. It gathers several indicators to have a "meeting" and confirm everything before giving you a Buy or Sell signal.
**🎯 Level 1: Core Trend (The Gatekeepers)**
This is the first checkpoint. If the price doesn't pass this stage, no signal gets generated.
- EMA: Is the price standing above the trend line? (Uptrend needs to be above, Downtrend below).
- MACD: Checks momentum and looks at the Histogram to see if real buying/selling volume is coming in.
- ADX: Measures trend strength (it won’t trade in boring, sideways markets).
**🔥 Level 2: Momentum (Finding the Best Entry)**
The second checkpoint to find the perfect spot to jump in.
- RSI: Checks if the price is Oversold (too cheap) or Overbought (too expensive).
- Stochastic: Finds short-term reversal crossovers.
**⭐ Level 3: Signal Boosters (For Strict Mode)**
A special bonus stage for those who want high accuracy (enable this in settings).
- RSI Divergence: Spots conflicts between price and RSI (e.g., Price drops but RSI rises = ready to pump).
- Price Action: Checks for strong candlestick patterns that show a clear winner between buyers and sellers.
------------------------------------------------------------
**🎮 User Guide**
Once you add this code to TradingView, here is what you will see and how to use it:
**A. Entry Signals**
🟢 Green BUY Label: Pops up below the candle.
* Means: Uptrend + Momentum + All filters passed.
🔴 Red SELL Label: Pops up above the candle.
* Means: Downtrend + Selling pressure + All filters passed.
**B. TP/SL Lines (Profit & Loss)**
The system calculates these automatically—no need to measure manually!
- Blue Line: Entry point.
- Light Green (TP1, TP2): Short-term profit targets.
- Dark Green (TP3): Long-term profit target.
- Red Line (SL): Stop Loss point.
**C. Special Mode: Strict Filter**
- Normal (False): Uses only Level 1 + Level 2. You get more signals.
- Strict (True): Needs Level 1 + 2 + 3 to trigger. Fewer signals, but much higher accuracy.
------------------------------------------------------------
**🛠️ Settings & Customization**
Click the gear icon to tweak the settings as you like:
1. Show BUY/SELL Signals: Uncheck if you don't want to see the labels.
2. Use Strict Filter: Check this for high precision (but you'll wait longer for signals).
3. Point Size: **Very Important!** This defines the TP/SL distance.
- For Gold (XAUUSD): Use **0.01**.
- For Forex pairs: Try **0.0001**.
- *Tip: Adjust this number until the TP/SL lines look reasonable on your chart.*
4. TP/SL Points: Set your desired profit/loss distance (e.g., TP1 = 50 points).
------------------------------------------------------------
💡 **Pro Tips**
- Trading Time: This code is smart—it checks sessions (based on GMT+7/Thai Time). It only gives signals during active markets (Sydney, Tokyo, London, NY). It stays quiet during dead hours.
- Recommended Timeframe: Since it's for Scalping, it works best on **M5, M15, or M30**.
- Money Management: Even with SL lines, always calculate your Lot Size properly. Don't overtrade!
------------------------------------------------------------
"KLS Ultimate V.1" เป็นเครื่องมือช่วยเทรด (Indicator) ที่ออกแบบมาอย่างปราณีตและซับซ้อนพอสมควร โดยเน้นไปที่ "สาย Scalping" (เทรดสั้นทำกำไรเร็ว) โดยเฉพาะ
🚀 เจาะลึกการทำงาน: ระบบกรอง 3 ชั้น (The 3-Level Logic)
อินดิเคเตอร์ตัวนี้ไม่ได้ใช้แค่เครื่องมือเดียวตัดสินใจ แต่มันเอาอินดิเคเตอร์หลายตัวมา "คอนเฟิร์ม" กันก่อนจะบอกให้คุณ Buy หรือ Sell ครับ
🎯 Level 1: ตัวคุมเทรนด์หลัก (Core Indicators)
นี่คือด่านแรก ถ้าไม่ผ่านด่านนี้ จะไม่มีสัญญาณเกิดขึ้น
- EMA (เส้นค่าเฉลี่ย): เช็คว่าราคายืนเหนือเส้นเทรนด์ไหม? (ขาขึ้นต้องยืนเหนือ, ขาลงต้องอยู่ใต้)
- MACD (โมเมนตัม): ดูแรงส่งของกราฟ และดู Histogram ว่ามีแรงซื้อ/ขาย เข้ามาจริงไหม
- ADX: วัดความแข็งแรงของเทรนด์ (ถ้าตลาดไซด์เวย์น่าเบื่อๆ ADX ต่ำๆ มันจะไม่เทรด)
🔥 Level 2: จุดกลับตัว (Momentum Indicators) ด่านที่สอง หาจังหวะเข้าที่ได้เปรียบ
- RSI: ดูว่าราคาถูกเกินไป (Oversold) หรือแพงเกินไป (Overbought) หรือยัง
- Stochastic: หาจุดตัดเพื่อยืนยันจุดกลับตัวระยะสั้น
⭐ Level 3: ตัวบูสต์สัญญาณ (Boost Indicators - สำหรับโหมด Strict)
ด่านพิเศษ สำหรับคนที่ต้องการความชัวร์ระดับสูง (เปิดใช้ได้ในตั้งค่า)
- RSI Divergence: หาสัญญาณขัดแย้งระหว่างราคากับ RSI (เช่น ราคาลงแต่ RSI ยกขึ้น = เตรียมพุ่ง)
- Price Action: ดูรูปแบบแท่งเทียนว่ามีแรงซื้อ/ขาย ชนะขาดลอยหรือไม่
------------------------------------------------------------
🎮 คู่มือการใช้งาน (User Guide)
เมื่อคุณแปะโค้ดนี้ลงใน TradingView แล้ว สิ่งที่คุณจะเห็นและการใช้งานมีดังนี้ครับ:
A. สัญญาณเข้าออเดอร์ (Entry Signals)
🟢 ป้าย BUY (สีเขียว): จะโผล่ใต้แท่งเทียน
แปลว่า: เทรนด์เป็นขาขึ้น + โมเมนตัมมา + ผ่านเงื่อนไขกรองต่างๆ แล้ว
🔴 ป้าย SELL (สีแดง): จะโผล่เหนือแท่งเทียน
แปลว่า: เทรนด์เป็นขาลง + แรงขายมา + ผ่านเงื่อนไขกรองต่างๆ แล้ว
B. เส้นเป้าหมายกำไร/ขาดทุน (TP/SL Lines)
ระบบคำนวณให้อัตโนมัติ ไม่ต้องนั่งวัดเอง!
- เส้นสีน้ำเงิน: จุดเข้า (Entry)
- เส้นสีเขียวอ่อน (TP1, TP2): เป้าทำกำไรระยะใกล้
เส้นสีเขียวเข้ม (TP3): เป้าทำกำไรระยะไกล
เส้นสีแดง (SL): จุดยอมแพ้ (Stop Loss)
C. โหมดพิเศษ: Strict Filter (โหมดเข้มงวด)
- ค่าปกติ (False): ใช้แค่ Level 1 + Level 2 ก็เกิดสัญญาณแล้ว (สัญญาณเยอะหน่อย)
- ถ้าเปิดใช้ (True): ต้องผ่าน Level 1 + 2 + 3 ถึงจะเกิดสัญญาณ (สัญญาณน้อย แต่แม่นยำสูงมาก)
------------------------------------------------------------
🛠️ วิธีตั้งค่าและปรับแต่ง (Settings)
ในหน้าตั้งค่า (รูปเฟือง) คุณสามารถปรับจูนได้ตามใจชอบ:
1. Show BUY/SELL Signals: ติ๊กออกถ้าไม่อยากเห็นป้ายสัญญาณ
2. Use Strict Filter: ติ๊กถูกถ้าอยากได้สัญญาณแม่นๆ (แต่รอนานหน่อย)
3. Point Size: สำคัญมาก! ใช้กำหนดระยะ TP/SL
- ถ้าเทรดทอง (XAUUSD) ตั้งค่าพื้นฐาน 0.01 เท่านั้น
- ถ้าเทรดคู่เงิน (Forex) อาจจะปรับเป็น 0.0001
- แนะนำให้ลองปรับจนเส้น TP/SL บนกราฟดูสมเหตุสมผล
4. TP/SL Points: กำหนดระยะจุดกำไรขาดทุนที่ต้องการ (เช่น TP1 = 50 จุด)
------------------------------------------------------------
💡 คำแนะนำเพิ่มเติม (Tips)
- เวลาเทรด: โค้ดนี้ฉลาดมาก มันมีการเช็คเวลา (Session) ให้ด้วย โดยอิงเวลา GMT+7 (เวลาไทย) โดยจะเทรดเฉพาะช่วงที่มีตลาดหลักเปิด (Sydney, Tokyo, London, NY) ช่วงตลาดวายดึกๆ หรือเช้ามืดเงียบๆ มันจะไม่บอกสัญญาณ
- Timeframe ที่แนะนำ: เนื่องจากเขียนมาเพื่อ Scalping แนะนำให้ใช้กับ M5, M15 หรือ M30 จะเห็นผลดีที่สุดครับ
- การบริหารเงิน (MM): แม้ระบบจะมี SL ให้ แต่คุณควรคำนวณ Lot Size ให้เหมาะสม ไม่ควร Overtrade ครับ

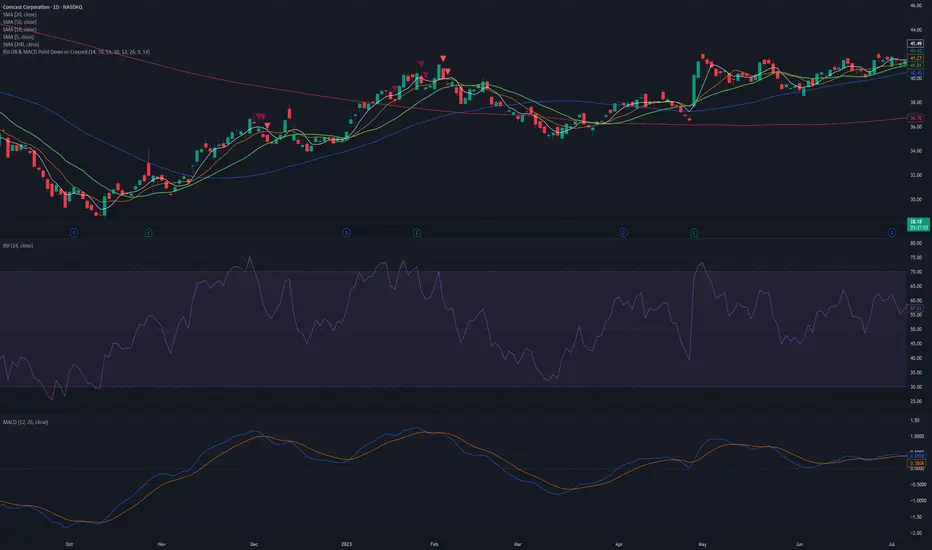
Project 1 - Complete with CMF and All IndicatorsProject 1 – Multi-Indicator Suite
This script combines several widely-used technical indicators into a single visual framework.
It is designed to help traders track momentum, trend strength, volume behavior, and money flow without switching between multiple tools.
Included components:
• MACD with dynamic color changes
• RSI with percentage change and directional marker
• ADX with trend-strength shading and Δ% calculation
• CMF (Chaikin Money Flow) with positive/negative flow tracking
• Volume Oscillator for short–long volume pressure
• Auto-updated labels for RSI, ADX, and CMF
• Lightweight visual lines to show momentum changes
Use cases:
• Trend confirmation
• Momentum diagnostics
• Volume-based pressure analysis
• Money-flow direction and strength
• Multi-factor confluence without indicator stacking
This tool does not generate buy/sell signals and does not imply trading outcomes.
It is a visual analytics suite built for discretionary technical analysis.

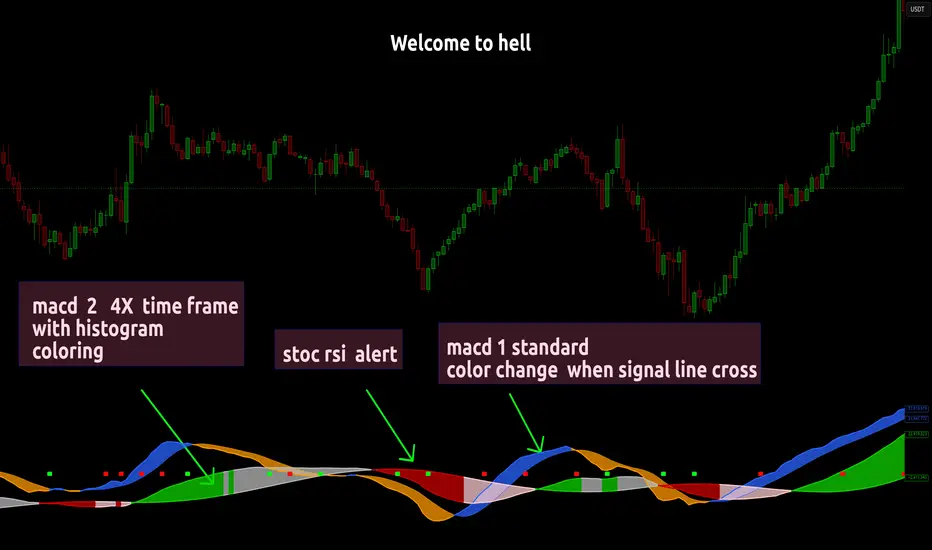
Dual MACD With Pilot Background + + Stoch RSI Alert HELL 2macd 1 chart time macd 2 4x chart time with over bought and over sold stoc rsi alerts
Hyper MACDThe Hyper MACD is a customizable momentum indicator exclusively designed for Scalping that blends traditional MACD logic with dynamic signal coloring, overbought/oversold detection, and WaveTrend overlays. It supports multiple moving average types and highlights key momentum shifts with visual markers and alerts.
The settings/alerts are self explanatory and are optimized for quick scalping, works for any timeframe.
Suggested rules are.
The MACD line and Signal line must be above the zero line to scalp
The price begins do decay when the Signal turns from white to orange, however if both the lines are above zero line, then its still game to scalp but cautiously.
The colors are telling on both the lines, blue indicates a bullish surge on both and green on macd and white on signal suggests the bullish trend continuation
It also prints take profit arrows along the way, and also possible trend reversals.

MACD FROM HELLthis is a double macd with 2 time frames macd 1 is chart macd 4 is 4X meaning the 1hr becomes the 4hr and it uses the histogram coloring for added detail ,, on top of that it has stochastic rsi Alerts set to trigger when k line goes above 99.9 or below 0.01 and exits ,, alert triggers on exit

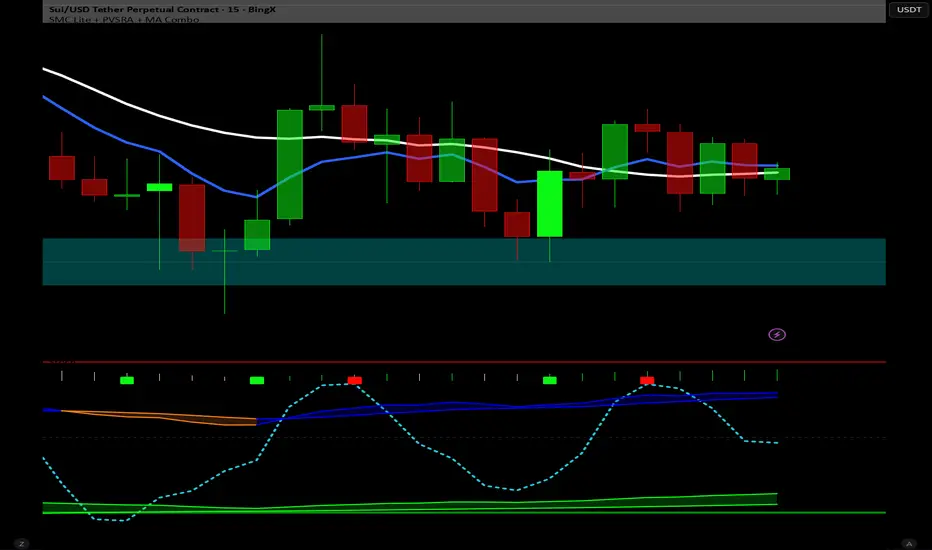
WTC Step Buy Step Edition CbyCarlo📊 WT Cross Modified – Step Buy Step Edition (v4)
WTC_StepBuyStep_Edition is an enhanced, practical, and optimized version of the classic WaveTrend (WT) Cross Indicator.
Developed for the Step Buy Step project, this tool helps traders identify market momentum shifts, structural price zones, and potential reversal areas with high clarity and precision.
🔍 Concept & Purpose
This indicator builds upon the established WaveTrend / LazyBear logic and extends it with additional structural intelligence.
The goal is to make overbought/oversold phases and trend reversals easier to spot — while also highlighting historically validated price zones where the market has previously reacted strongly.
⚙️ Key Features
1️⃣ WT Cross Signals
WT1 (yellow) and WT2 (purple) visualize market momentum.
A WT1 cross above WT2 while below the Oversold zone (−53) can indicate potential Long opportunities.
A WT1 cross below WT2 while above the Overbought zone (+53) can indicate potential Short opportunities.
Signals only confirm after candle close to prevent repainting.
2️⃣ Dynamic “WT SignalZone” Panel
Displayed in the top-right corner, this panel shows the last three valid price levels derived from WT signals:
🟢 LonLev – Buy support levels from previous WT Long signals
🔴 ShoLev – Sell resistance levels from previous WT Short signals
These zones act as objective support/resistance structures, based on historical momentum turning points — not subjective lines.
3️⃣ Flexible Calculation Modes
Choose how levels are derived from each WT signal:
Pullback 50% → Midpoint of the signal candle (high+low)/2
Close → Close price of the signal candle
Next Open → Open of the following bar (ideal for system testing)
📈 How to Interpret the Indicator
Market Condition WT Event Meaning
WT1 < −53 & CrossUp Long Signal Potential reversal / buy zone
WT1 > +53 & CrossDown Short Signal Potential exhaustion / sell zone
Price revisits LonLev Support Re-entry or bounce zone
Price revisits ShoLev Resistance Profit-taking or short setup zone
This makes the tool highly effective for:
Swing traders
Zone-based trading strategies
Systematic re-entries
Identifying structural turning points
🧠 Advantages
No repainting (signals confirmed only after bar close)
Works on all timeframes (from intraday to weekly)
Clean overview without clutter or excessive chart markers
Excellent as a filter to confirm market context
💬 Best Use Case
Use WTC_StepBuyStep_Edition as a contextual confirmation tool.
It does not replace a full trading system — but it gives you objective, repeatable, and statistically relevant zones where the market has reacted before.
Combine it with price action, volume analysis, or trend tools for even stronger setups.
© Step Buy Step • Step-Buy-Step.com
Educational trading tool intended for market analysis.
Not financial advice.

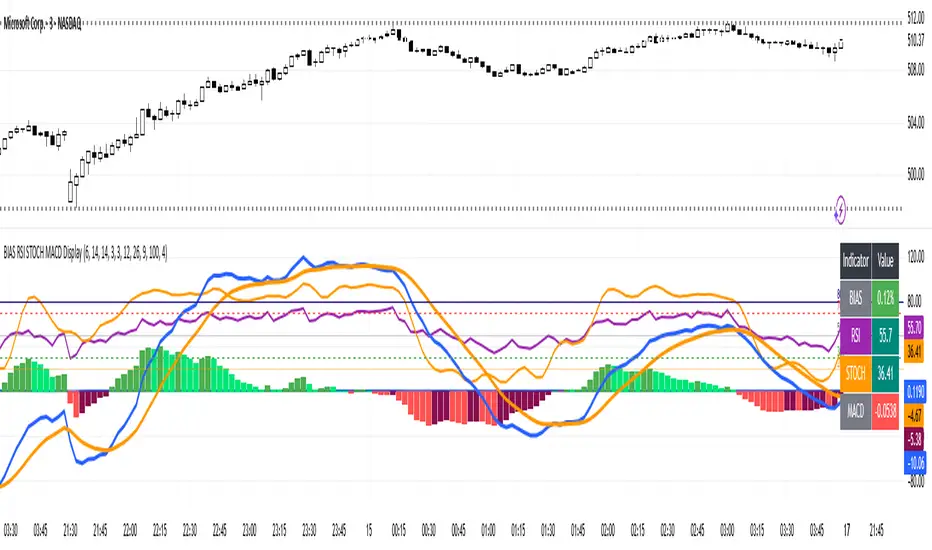
BIAS RSI STOCH MACD Displaysimple but effective to prevent chart clutter.
Hi Traders! Today I’m showing you a **custom indicator** that combines **BIAS, RSI, Stochastic, and MACD** in one easy-to-read panel. Let’s break it down:
1️⃣ **BIAS** – Shows how far the price is from its moving average.
* Positive BIAS → price is above the average.
* Negative BIAS → price is below the average.
2️⃣ **RSI (Relative Strength Index)** – Measures momentum.
* Above 70 → overbought
* Below 30 → oversold
* **50 line added** → midpoint for trend direction
3️⃣ **Stochastic (STOCH)** – Confirms momentum like RSI.
* Above 80 → overbought
* Below 20 → oversold
4️⃣ **MACD (Moving Average Convergence Divergence)** – Shows trend and momentum.
* Histogram colors indicate strength
* Lines show trend direction
5️⃣ **Visual Table** – On the top right, you can see all current indicator values at a glance, with color coding for easy interpretation.
6️⃣ **Plots & Levels** –
* BIAS, RSI, Stoch are plotted clearly
* RSI has **midline at 50** for trend reference
* Standard overbought/oversold levels highlighted
✅ **How to Use:**
* Look for RSI or Stoch crossing midline or extreme levels for potential entries.
* Check MACD histogram and lines for confirmation of trend strength.
* Use BIAS to see if price is stretched from the moving average.
This indicator is perfect for **momentum, trend, and mean-reversion traders**, giving multiple signals in one pane without clutter.
---
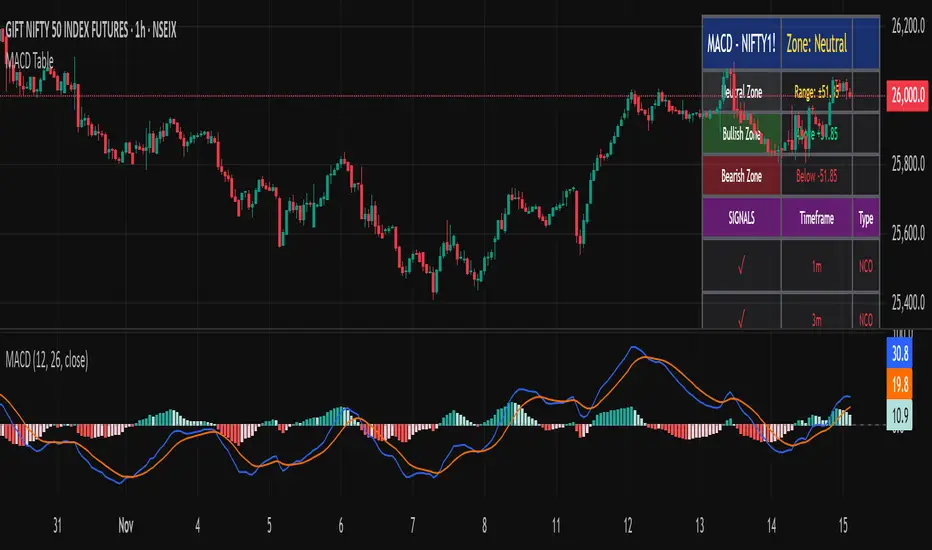
MACD Trend & Momentum Dashboard (Weighted, 3 TFs)This indicator provides a multi-timeframe MACD trend and momentum dashboard that works independently of your current chart timeframe. It displays MACD zero-line bias and MACD-vs-Signal trend state across three user-selectable timeframes, using clear color-coded cells for instant visual interpretation. A weighted scoring system combines all six signals into a single market bias classification (Strong Bullish → Strong Bearish). This helps traders quickly understand higher- and lower-timeframe alignment, market regime, and overall trend quality. Ideal for trend- and momentum-followers who want a clean, actionable market overview at a glance.

Multi-Confluence Signal System📊 OPTIMIZED MULTI-CONFLUENCE SIGNAL SYSTEM
A professional-grade trading indicator that combines multiple technical analysis methods to generate high-probability buy and sell signals. Designed for daily timeframe Bitcoin/crypto trading with optimized parameters based on real market backtesting.
🎯 KEY FEATURES:
- Multi-Confluence Scoring (8 components) - Each signal shows strength rating
- Smart Top & Bottom Detection - Catches reversals using price action patterns
- Ichimoku Cloud Integration - Dynamic support/resistance visualization
- Dual EMA System (20/50) - Clear trend identification
- RSI + MACD + Volume Confirmation - Multi-indicator validation
- Signal Alternation - Only shows directional changes (no repeated signals)
- Minimal Bar Spacing - Prevents signal clustering and overtrading
✅ OPTIMIZED FOR:
- Catching parabolic tops with rejection wicks
- Identifying capitulation bottoms in downtrends
- Avoiding false signals during consolidation
- 4-8 quality signals per 4-month period on daily charts
- Works in both trending and volatile markets
🔧 TECHNICAL COMPONENTS:
- EMA 20/50 trend system
- RSI (14) with adjusted overbought/oversold levels (68/32)
- MACD for momentum confirmation
- Ichimoku Cloud for trend context
- Volume analysis (1.3x threshold)
- Candlestick pattern recognition (engulfing, hammers, shooting stars)
- Capitulation detection for extreme moves
- Price extension filters (±5-10% from EMAs)
⚠️ BEST PRACTICES:
- Optimized for Daily timeframe
- Combine with your own risk management
- Higher scores = higher probability trades
- Wait for signal confirmation on candle close
- Use in conjunction with key support/resistance levels
💡 SIGNAL LOGIC:
BUY signals trigger on: Capitulation candles, extreme oversold + reversal patterns, MACD turnarounds in downtrends, or high confluence scores with bullish patterns
SELL signals trigger on: Rejection wicks at tops, bearish engulfings with overbought RSI, parabolic extensions, MACD reversals, or high confluence scores with bearish patterns
📈 Created through iterative backtesting and optimization on Bitcoin price action from 2024-2025.
⭐ Free to use • Leave feedback • Happy trading!

GSC MACD by TejasThis script is based Mr. Saleel Choudhary, GSC Academy MACD Concepts. This indicator is available only for the GSC Students and No one else.
GSC MACD by TejasThis is an indicator based on Mr. Saleel Choudhary, GSC Academy MACD signals. This indicator is only and only available to GSC Students and Nobody else.
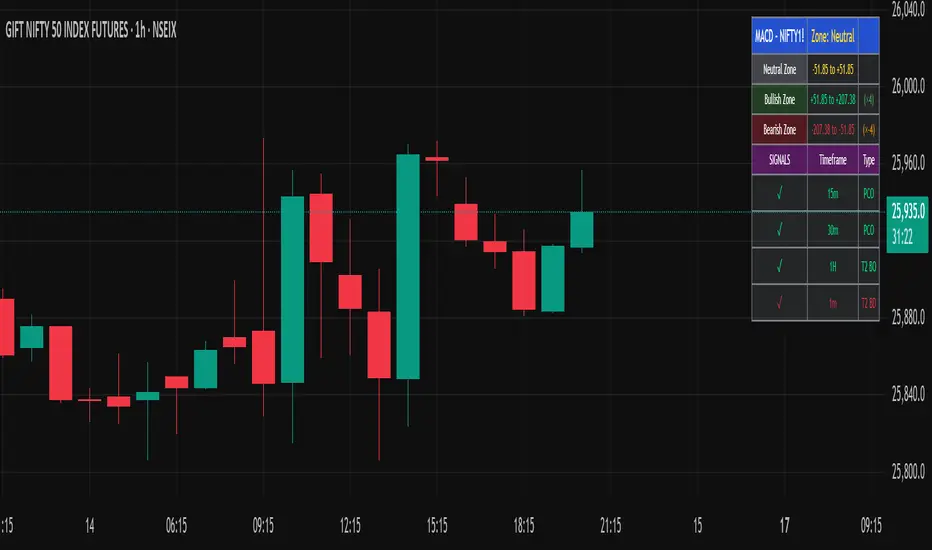
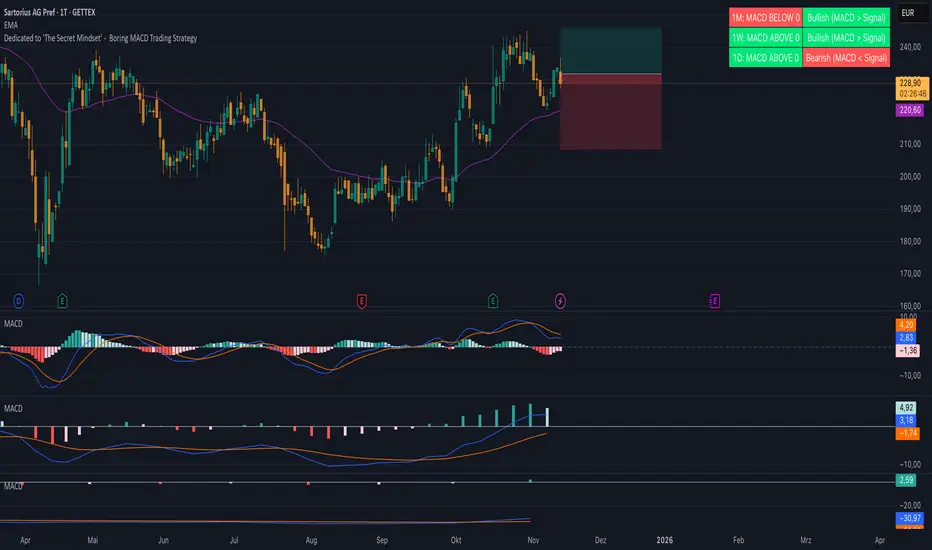
Boring MACD Trading Strategy - Dedicated to 'The Secret Mindset'This indicator displays the MACD status across three selectable timeframes, regardless of the chart timeframe you are currently viewing.
For each timeframe, it shows whether the MACD line is above or below the zero line, indicating bullish or bearish momentum.
It also shows whether the MACD line is above or below the signal line, revealing the current trend condition as bullish, bearish, or neutral.
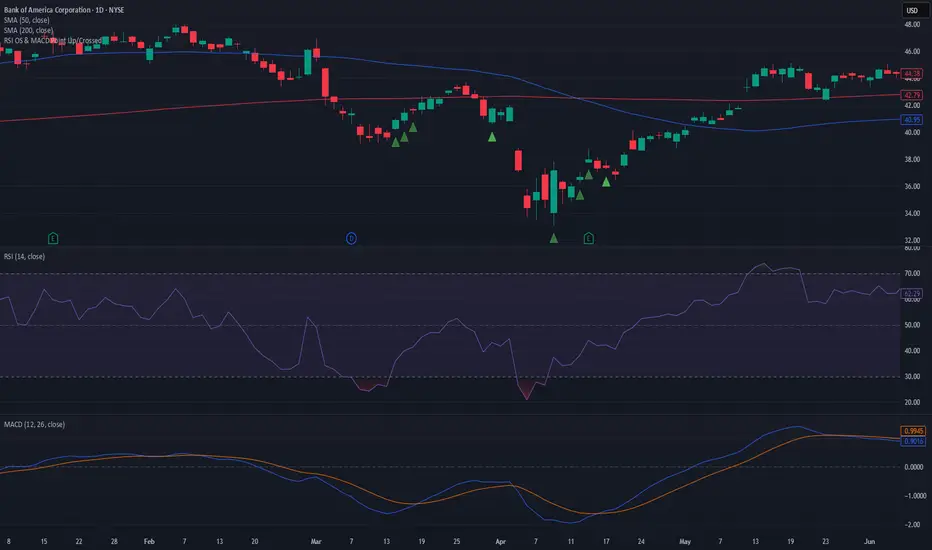
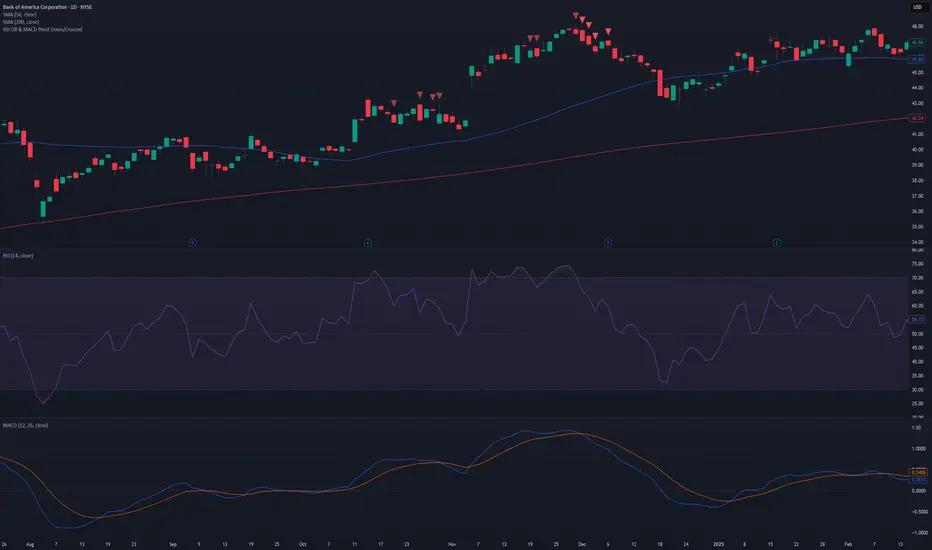
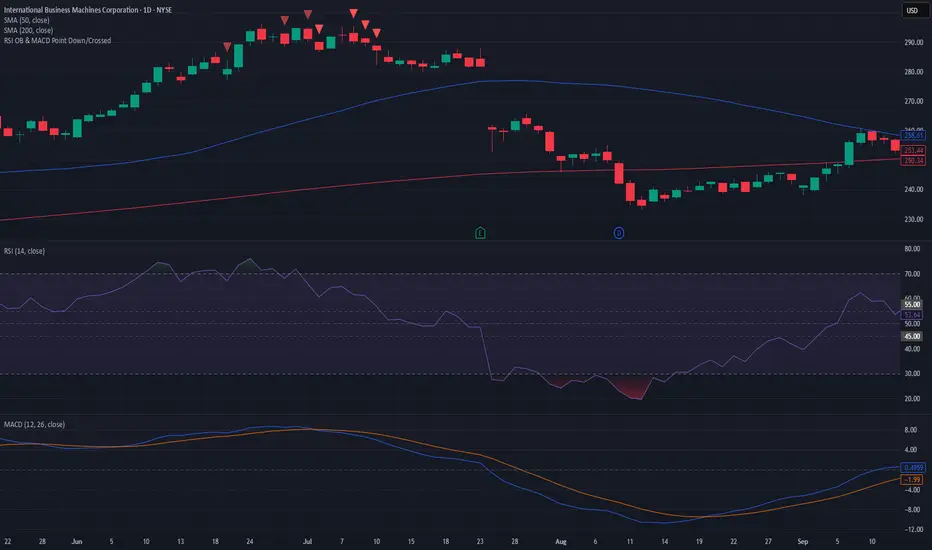
RSI OB & MACD Point Down or Crossed - PSPine script screener indicator for RSI OB and MACD point down or cross.