Crack_RSI_Cloud_Ver_1.0.0
(주식/Stocks) 삼성전자 Samsung Electronics
(선물/Futures) 나스닥 NASDAQ
(코인/Cryptocurrency) 비트코인 BTCKRW
Hello my dear traders.
My team has recently developed a technical indicator that surprises ourselves every time we observe a price action caused by this very indicator.
Relative Strength Index has been developed by a scholar named Welles Wilder. Just like me, he turned himself into a technical analyst from a mechanical engineer after realizing how powerful and beautiful technical analysis is. As most of you know, RSI is a technical indicator that measures and visualizes the strength of bulls or bears objectively, in a percentage unit. This index, which oscillates between 0~100, is useful when identifying the general trend of the market
Here is the equation that computes RSI.
RSI(%) = (Average of Upward Price Change within N /( Average of Upward Price Change within N + Average of Downward Price Change within N))*100
* N = Time period/length or the number of candlesticks that are being considered
RSI is one of the most popular indicators used by daily traders these days. However, since default setting of the RSI only considers the closed price of candles, many limitations and weak points have been spotted recently. Since current financial market (such as crypto, stocks, futures, and forex) is heavily volatile and unstable, candle’s tails are not being considered properly on RSI (and also any other indicators that are computed using closed price).
To handle this problem, our team has worked very hard to achieve applying candle’s tails on our indicators.
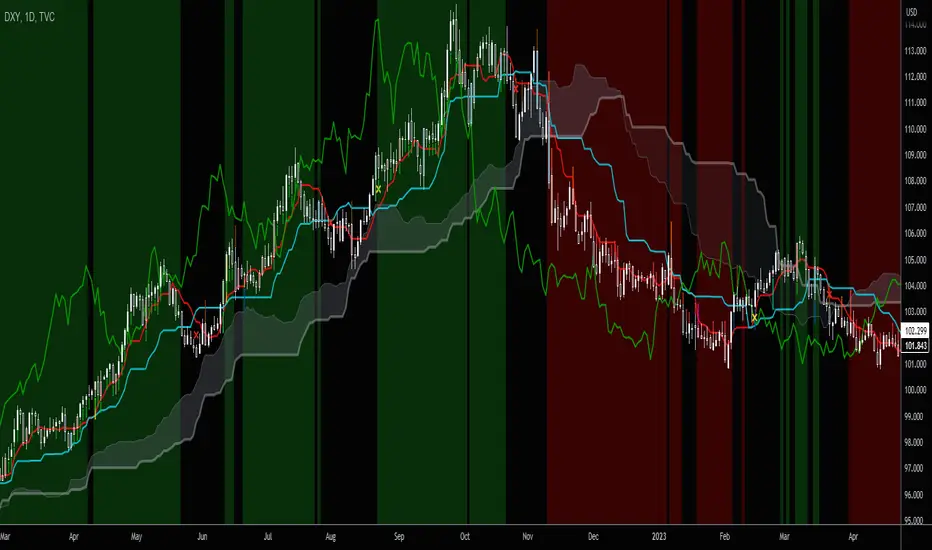
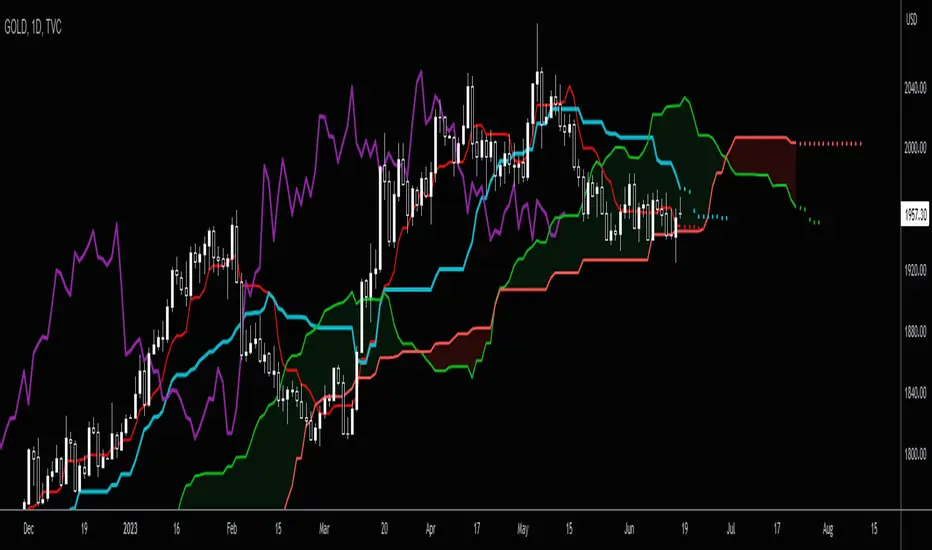
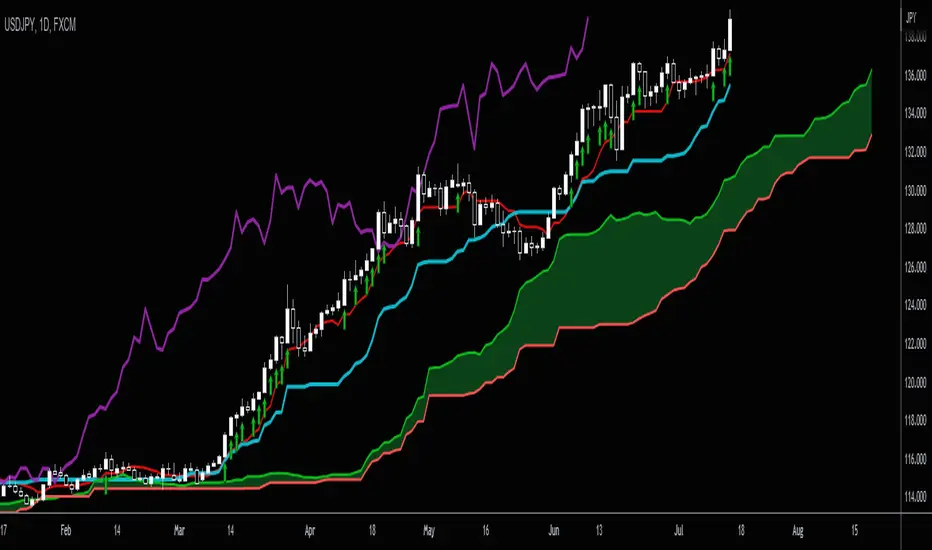
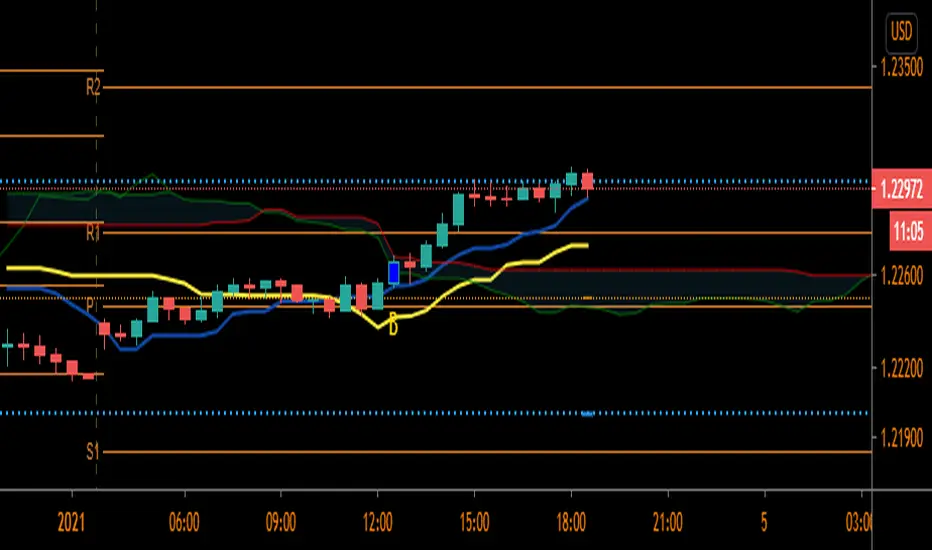
After numerous tries and updates, we have finally come up with a very decent one that plots RSI that reflects both the candle's wick and body. This indicator can be interpreted as a cloud of RSI just like Ichimoku.
Traders can consider this indicator as overbought/oversold only if all of the RSI lines, (or the whold cloud) enters to the zones. Moreover, plotting channels and trendline on this cloud works very well.
We have also made it to show divergence signals so that traders can refer when the relative strength of bulls/bears starts to resolve.
If you wish to obtain access to this indicator, please comment or DM to this account.
We will give you guys an update soon for a newer version!
Thanks.
안녕하세요 트레이더 여러분. 토미 트레이딩 팀입니다.
오늘은 요즘 많은 트레이더들이 유용하게 사용하는 RSI와 해당 지표의 한계점에 대해서 알려드리겠습니다. 또한 본 한계점을 극복하기 위해 저희 개발팀이 최근에 개발한 RSI 클라우드 지표에 대해서 소개해드리겠습니다.
RSI , Relative Strength Index (상대강도지수)는 1978년에 웰레스 월더라는, 저처럼 원래 공학자였지만 기술적분석이라는 학문에 푹 빠져 이쪽 분야로 발을 돌린 한 학자에 의해 개발됐습니다. 해당 지수는 주가의 상승/하락 압력 간의 상대적인 강도를 보여주는 보조지표로 추세의 강도세를 백분율로 표기해줍니다.
RSI를 산출하는 공식은 다음과 같습니다.
RSI (%) = (N의 상승폭 합계/(N의 상승폭 합계 + N의 하락폭 합계))*100
* N = Time period/length, 시간(캔들봉) 단위
본 공식에서 N은 RSI의 민감도를 조절하는 Parameter(설정값)로 보편적으로 Default(기본)값인 14, 조금 덜 민감한 값으로는 25가 사용됩니다. RSI의 단위는 %로 과매수 구간은 70~80%, 과매도 구간은 20~30%으로 사용됩니다. 즉 RSI가 70~80% 이상일 때 강세 혹은 과매수, 20~30%일 때 약세 혹은 과매도라고 판단할 수 있습니다.
정말로 직관적이면서도 참으로 쉽고 유용한 지표이죠.
하지만 아쉽게도 이 RSI도 크나 큰 한계점이 존재합니다. 해당 지수가 산정될 때 사용하는 소스값은 Closed, 즉 캔들의 종가로, 고가와 저가가 지수에 반영되지 않습니다. 즉 캔들의 꼬리는 해당 지수에 고려되지 않는다는 점입니다. 요즘에 누가 캔들 종가만 보고, 혹은 라인차트로만 매매하나요? 허구한날 미친 스캠무빙이 툭하면 나오는 현대 장에 종가만 가지고 매매하면 골로간다는건 다들 아실 거라 생각합니다. 요즘처럼 고변동성의, 툭하면 길고 뾰족한 꼬리들이 난무하는 현대 금융 시장에 적용시키기엔 문제가 너무 많습니다.
게다가 요즘에 너무나도 많은 개인투자자들이 RSI 지표를 사용합니다. 모두가 같은 자리, 같은 기법, 혹은 같은 지표를 쓰면 어떻게 된다고 했죠? 제가 매번 강조 드렸듯이 3~5% 개미 생종률은 불변의 법칙입니다. 모두가 롱을 외치면 숏자리를, 모두가 숏을 외치면 롱자리를 찾아야하는 금융시장. 높은 통찰력과 안목을 지닌 소수의 현명한 투자자들만 살아남는다고 제가 누누이 강조 드렸습니다.
이 문제를 해결하고자 최근 저희 팀은 캔들의 모든 가격들을 RSI지표에 반영시키기 위해, 그리고 종가를 기준이 아닌 다른 기준으로 다이버전스를 모색하는 매우 다양한 시도들을 해왔습니다.
수많은 연구, 실험 및 고찰 끝에 마침내 캔들의 모든 가격을 반영하는 RSI 지표를 만들고 말았습니다. 이름하여 RSI 클라우드! RSI를 하나의 라인이 아닌 범위로 표기를 함으로써 조금 더 보수적이고 정확하게 강도지수를 파악할 수 있게 되었습니다. 본 지표는 일목구름과 마찬가지로 RSI를 하나의 선이 아닌 구름대로 해석하시면 됩니다.
다수의 라인(라인들의 범주를 구름으로 표기함)으로 구성된 이 지표는 고려하는 모든 선들이 과매수/과매도 구역에 진입해야 과열로 간주함으로써 더 보수적으로 확실한 과열 상황들을 포착할 수 있습니다. 그리고 해당 지표에 평행 채널 및 추세선들이 기가 막히게 잘 들어맞습니다. 주가에 추세선/채널 작도하는 것처럼 활용하시면 됩니다. 이탈 방향 나올 때, 그리고 심지어 이탈 이후 리테스트도 나옵니다.
또한 다이버전스 역시 종가가 아닌 캔들의 평균값을 사용하여 시그널이 나오게끔 했습니다. 때문에 중간중간에 긴 꼬리들 혹은 말도 안되는 무빙이나 노이즈들로 발생되는 주가 <-> 지표 다이버전스의 괴리감을 최소화시켰습니다. 이 또한 자동으로 다이버전스를 잡도록 로직을 짰으니 상승/하락세의 과열이 점차 해소되기 시작할 때, 즉 변곡 잡으실 때 매우 유용하게 사용하실 수 있습니다.
물론 당연한 말이지만 이 지표 하나만 가지고 매매를 하면 안되겠죠? 본인만의 여러 기법 및 지표들의 튼튼한 조합을 구성할 때 하나의 기준으로써 참고를 해야합니다.
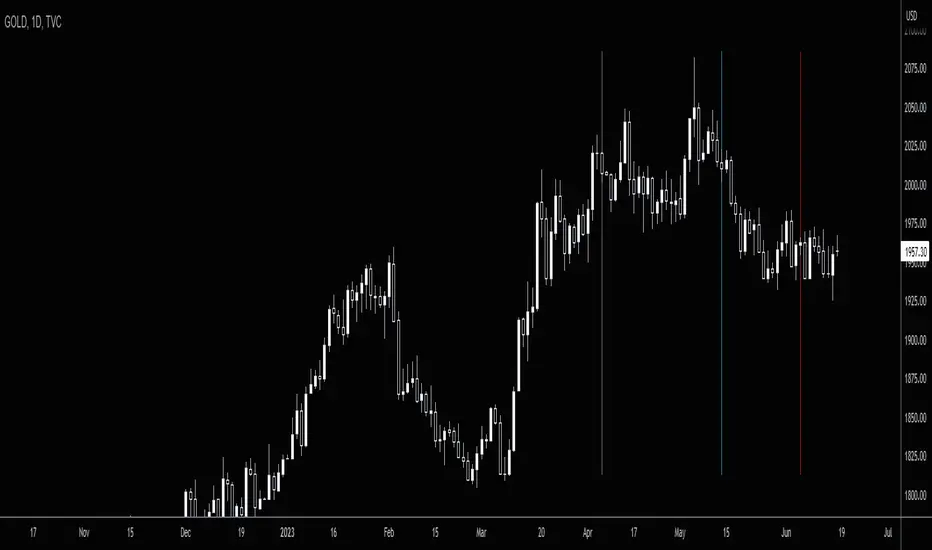
아래는 비트코인이 아닌 선물과 주식 차트입니다. 해당 차트들은 예전 차트도 아닌 최근 차트입니다. 이와 같이 종목/상품과 타임프레임을 불문하고 다 잘 맞습니다.
그러면 이상, 급변하는 21세기 현대 금융시장에 최적화된 기법, 지표 및 전략들을 꾸준히 연구하고 개발하는 토미 트레이딩 팀이었습니다.
감사합니다.
Chmura Ichimoku

Ichimoku Trend DirectionThis script will help you detect the current trend of market use Ichimoku trading system. We use the default parameters.
To reduce risk, ONLY trade follow the trend of high time frame!
Very simple to use:
- Green background when market Up trend
- Red background when market Down trend
Have a nice trade! :P
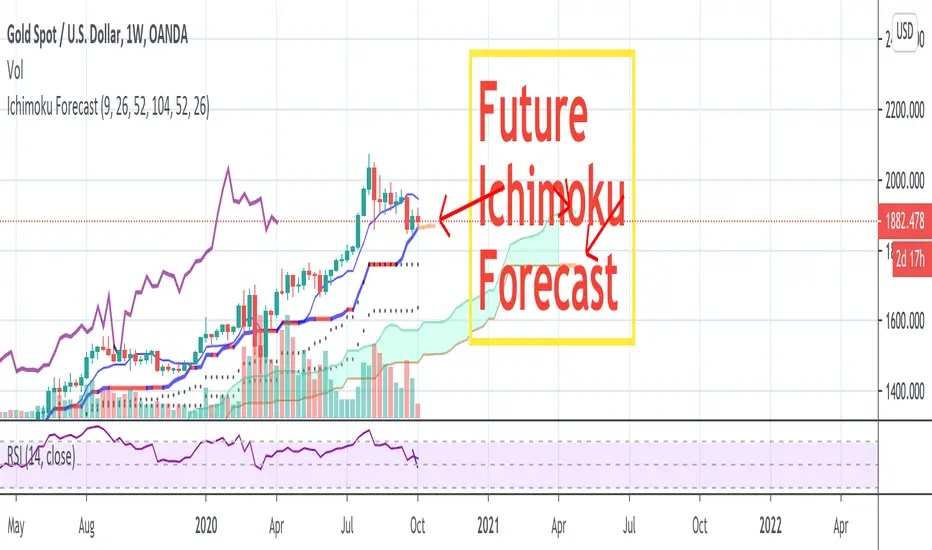
Future Ichimoku LinesFuture Ichimoku Lines Plot: Tenkan-sen next 5 days, Kijun-sen next 10 days, Kumo A next 5 days and Kumo B next 14 days will be display
This will help you forecast the future of price and increase winning probability!
Always remember, risk management is the key of a successful trader
Have a nice trade! :D
Ichimoku Line CounterThis simple script will help you seen the range of Kijun-sen, Tenkan-sen and Senkou span B. You can use it to analyze the direction of Ichimoku components. Very useful for Ichimoku trader!
Example: how many days Kijun, Kumo, ... still flat or become flat?
We use the default number: 9, 26 and 52. You absolutely can modify it if your system use different numbers :P
Have a nice trade! :D
Simple Ichimoku Signal v1Simple Ichimoku Signal v1 - Use Original Japanese Ichimoku System
You can set alert to get notify on your phone when the signals appear:
- BUY signal (green arrow): when all lines of Ichimoku system have bullish
- SELL signal (red arrow): when all lines of Ichimoku system have bearish
Very easy to use for everyone expecially people who has less time for trading. Simple but very effective!
Please remember: all trading system can be right/wrong so the risk management is super important!
Good luck!
Ichimoku Kinko Hyo SignalsIchimoku Kinko Hyo Signals
This script show signals based on my understanding in Ichimoku Kinko Hyo.
/!\ Please do not follow signals blindly and always make your own analysis /!\
Buy : Han Ne lines are up, price is up, and also stochastic (K=30, D=10) is up
Strong Buy : Is a Sanyaku Kouten and can show a potential reverse in current tendance and Buy Signal conditions
Sell : Han Ne lines are down, price is down, and also stochastic (K=30, D=10) is down
Strong Sell : Is a Sanyaku Gyakuten and can show a potential reverse in current tendance and Sell Signal conditions
Exit : Show a potential time to take profit based on previous Sell, Strong Sell, Buy, or Strong Buy signal

Ichimoku Alert Indicator Buy Sell Please Take Trade as per your own risk.
Hi, this my new script which show you correct Ichimoku signals, when price exit cloud.
SELL SIGNAL:
- red line below blue
- green line below price
- price exit cloud bottom
- price below 3 EMA's!
BUY SIGNAL:
- red line above blue
- green line above price
- price exit cloud upper
- price above 3 EMA's!
You can change ichimoku parameters and input 3 EMA's. If u dont want use any of the EMA's then input 1 into them.
Comments
Backtst CloudHappy Holidays here is a gift!
This a cleaned up Ichimoku cloud with RSI coloring.
Can be used to remove some of the the noise.
How to read chart:
Cloud support and resistance zones.
A green line is RSI > 50
A red line is RSI <= 50

ICHIMOKU forecast öngörü Hi every Ichimoku Users,
ichimoku is a very useful indicator. It works very well in short periods.İ t helps me define market trends, find entry and follow.
However, it may take a lot of time to calculate which direction the lines will go.( kijun. tenkan and clouds). In the short-term charts, this is not what we want.
I'm sure you said yes.
ichimoku forecast will do this now.
will show us the next 3 candles.
ICHIMOKU FORECAST (öngörü) strengths:
- Forecast future +3 candles will make clouds, tenkan, kijun go!
- Help you indentify easy trend when clouds change, kijun go up or down!
- you can change colors, displacement, hide/show lines in its.
- Flexible and good for every timeframe: W, D, 4H, 1H and shorter.
- Flexible and good for every currencies, gold , future and more.
Test it, watch it, you'll see it works.

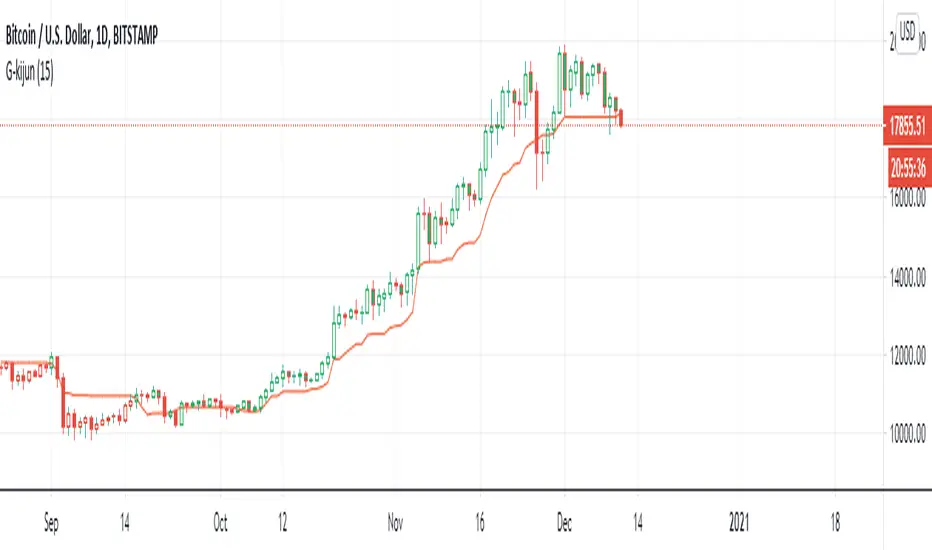
G-Kijun trailing stopThis indicator is the part of ichimoku kyo hyo.
I luv kijun-sen very much
kijun-sen is develop form (Highest - Lowest)/2
It's mean 50% of fibonacci
and I create color Green for price over the kijun-sen when the price cross down the kijun-sen it'sll be Red
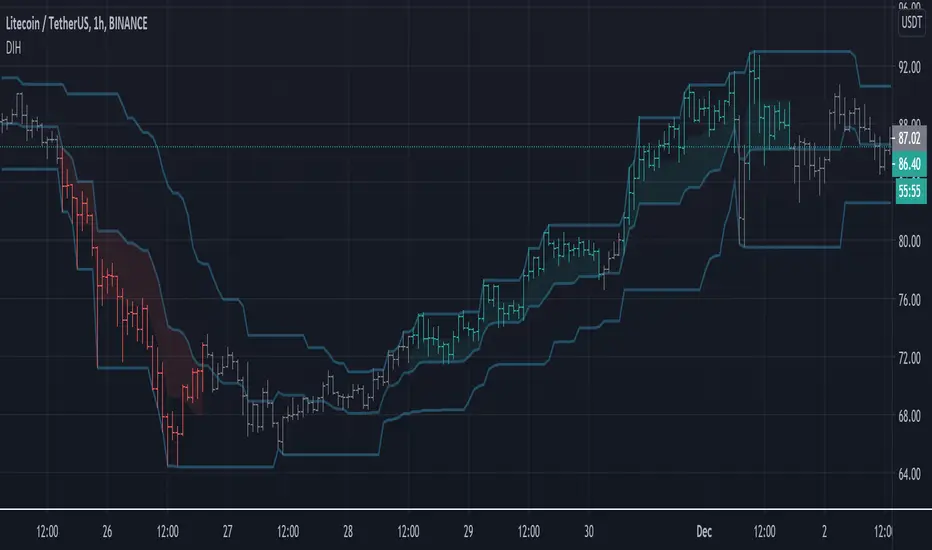
Donchian Ichimoku HybridWhat if we took the best elements from the Donchian Channel and the Ichimoku cloud and combined them into a complete system?
Strengths of the Donchian Channel:
-Dynamic support and resistance
-Measures volatility
Strengths of the Ichimoku Cloud:
-Can detect when price is trending vs ranging
-Retracement zones
-Trend identification
=== HOW TO USE THE INDICATOR ===
Green and Red bars are when price is trending. Green for trend up, Red for trend down.
Gray bars are when price is in a trading range. You can either play the edges or wait until price is trending again.
The clouds are retracement zones for pullbacks when price is trending.
Alerts are set up for when price starts to trend and starts a trading range.
=== MISC ===
Option for Dark Mode
MA ICHI BB [Rogulabo]3 indicators in 1.
Included Indicators are:
- MA 5,25,50,100,200
- Ichimoku
- Bollinger Band
These can be used to determine changes in trends when:
- MA's collide, trajectories shift, or certain levels are reached.
- Ichimoku cloud is above or below the candles.
- Bollinger Band's width changes, or range is broken.
Reasons for 3 in 1 assembly:
This indicator is intended to be used by students, and followers of Dan Takahashi
(a prominent educator of investing in Japan who is also a user of TradingView) .
Those who wants to use and learn with the same setup as Dan, would greatly benefit from this since,
the complex setting up process which can be a pain for beginners can be skipped with a simple click.
Every stylistic choice of color and placement were made to make it similar to the chart used by Dan.
Simple customizations are available such as:
- Changing color
- Changing the values
- Hide/show controls
Notes:
This is intended to be used alongside “CC RSI” for the complete the setup.
Any questions, please refer to:
@rogulabo
==
高橋ダンさんが使用されてるチャートと同様のセットアップの為にご活用ください。
複数のインジケータをグループにしておりますので、無料版を使われてる方は効率よく使っていただけると思います。
また、“CC RSI ”どいうタイトルのインジケータも同時に公開しておりますので、セットアップを完成させたい方はこちらもご活用ください。
以下のインジケータを含みます。
・MA線
・一目均等表
・ボリンジャーバンド
カスタマイズされたい方はご自由に値を変更ください。
ご質問は @rogulabo までよろしくお願いいたします。

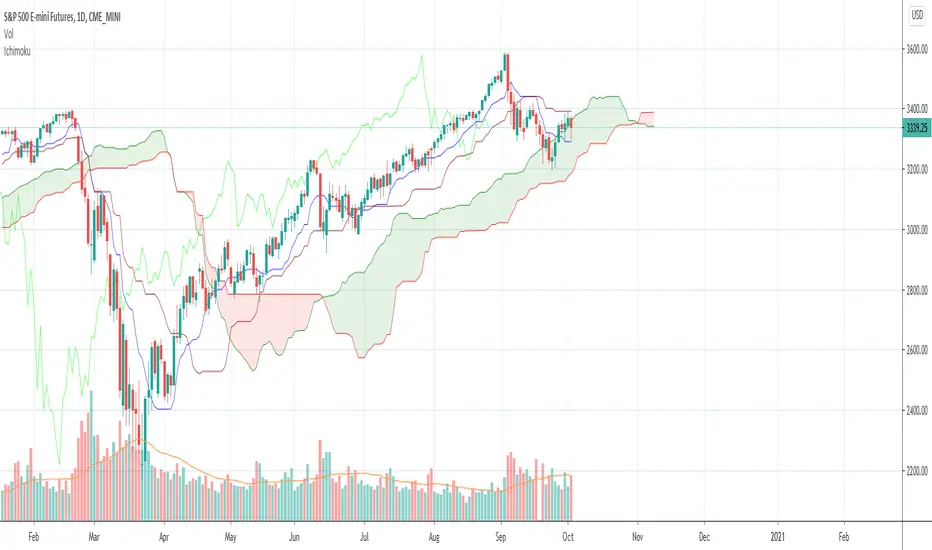
Ichimoku Cloud ForecastUsing doubled crypto settings, forecast Tenkan and Kijun lines, assuming price remains neutral (constant).
Tenkan - 14 periods
Kijun - 20 periods

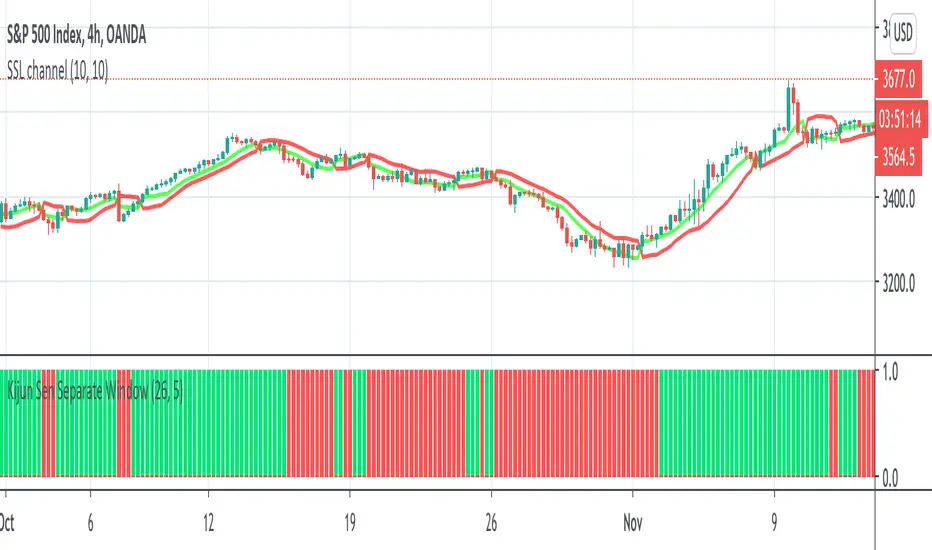
Kijun Sen Separate WindowThis indicator works the same as a regular Kijun Sen but it is on a separate window to allow for other on chart indicators.
I tend to use this as a filter for when to go long/short.
When it is green, I only take longs. When it is red, I only take shorts. Combine with other indicators of your choice.
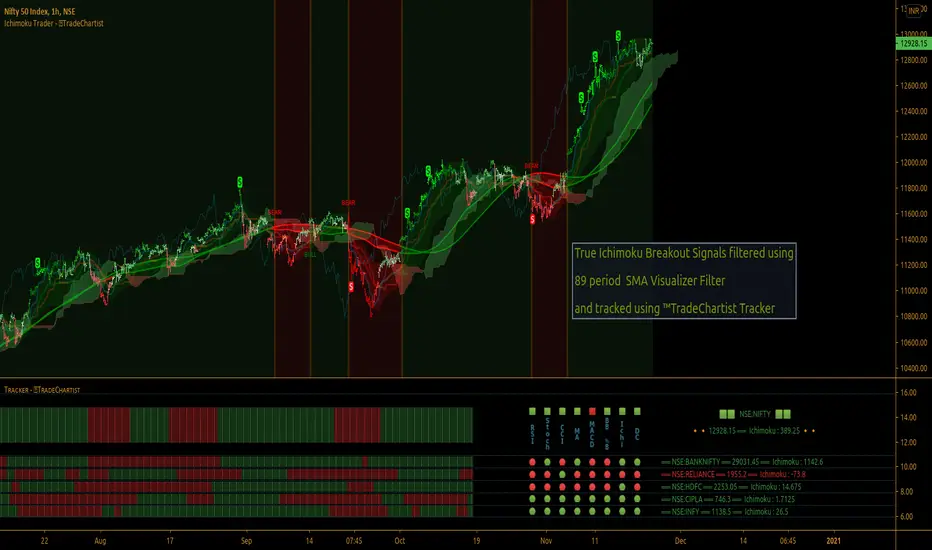
TradeChartist Ichimoku Trader ™TradeChartist Ichimoku Trader is an elegant and functional breakouts trading indicator that generates trade signals based on two types of breakouts - True Ichimoku Kumo Breakouts and Ichimoku Trade Bands Breakouts, which can be further filtered using ™TradeChartist MA Visualizer and/or using an external Filter.
===================================================================================================================
╔════════ 𝗖𝗹𝗼𝘂𝗱 𝗦𝗲𝘁𝘁𝗶𝗻𝗴𝘀 ═════════╗
Cloud Settings form the fundamental factor for this indicator to detect the breakouts. The settings for the Ichimoku Cloud is Automatic by default, but this can be changed based on the user preference from the settings under 𝐂𝐥𝐨𝐮𝐝 𝐓𝐲𝐩𝐞, which also includes a manual input option. Ichimoku traders can experiment different settings combinations under manual settings to suit their trading frequency and timeframe traded.
Ichimoku Cloud with its components can be displayed or hidden by enabling/disabling 𝐃𝐢𝐬𝐩𝐥𝐚𝐲 𝐈𝐜𝐡𝐢𝐦𝐨𝐤𝐮 𝐂𝐥𝐨𝐮𝐝. Also, Sʜᴏᴡ Iᴄʜɪᴍᴏᴋᴜ Cʀᴏssᴇs from the Cloud Settings plots tiny crosses on chart.
===================================================================================================================
╔═════════ 𝗕𝗮𝗻𝗱𝘀 𝗦𝗲𝘁𝘁𝗶𝗻𝗴𝘀 ════════╗
Even though the Ichimoku Trade Bands are derived from the Cloud Parameters, the Bᴀɴᴅ Wɪᴅᴛʜ (0.236 - 1) and Lᴏᴏᴋʙᴀᴄᴋ (5 - 200) influences the sensitivity and the width of the bands, which has an effect on the risk and reward expected from Ichimoku Trade Bands Breakout trade.
Trade Bands can be displayed or hidden by enabling/disabling 𝐃𝐢𝐬𝐩𝐥𝐚𝐲 𝐈𝐜𝐡𝐢𝐦𝐨𝐤𝐮 𝐓𝐫𝐚𝐝𝐞 𝐁𝐚𝐧𝐝𝐬. Also, the Bands mean line can be enabled or disabled using 𝐃𝐢𝐬𝐩𝐥𝐚𝐲 𝐓𝐫𝐚𝐝𝐞 𝐁𝐚𝐧𝐝𝐬 𝐌𝐞𝐚𝐧 𝐋𝐢𝐧𝐞 check box and its line width can be changed using Tʀᴀᴅᴇ Bᴀɴᴅs Mᴇᴀɴ Lɪɴᴇ Wɪᴅᴛʜ dropdown.
===================================================================================================================
╔═════════ 𝗠𝗔 𝗩𝗶𝘀𝘂𝗮𝗹𝗶𝘇𝗲𝗿 ═════════╗
MA Visualizer is a powerful and very useful original ™TradeChartist visual method to plot Moving Averages of the close price of the security for user specified look back period in a visually appealing style in the form of colour coded bands. MA Visualizer not only helps the trader spot the price action of the security relative to the moving average, but also paints a visual picture of the trend strength, which must be seen and used on chart to appreciate its elegance. One of 15 different types of Moving Averages can be used to visualize the price action.
Activate 𝗠𝗔 𝗩𝗶𝘀𝘂𝗮𝗹𝗶𝘇𝗲𝗿 and choose the MA type from MA Vɪsᴜᴀʟɪᴢᴇʀ Tʏᴘᴇ dropdown and entering the lookback period in MA Vɪsᴜᴀʟɪᴢᴇʀ ᴘᴇʀɪᴏᴅ input box. MA Visualizer colour theme can be be changed from MA Vɪsᴜᴀʟɪᴢᴇʀ Cᴏʟᴏʀ Sᴄʜᴇᴍᴇ dropdown.
The faster of the two set of bands that form the MA Visualizer reacts to price action faster and can be clearly seen from its change of colour from Bull Colour to Bear Colour or viceversa earlier than the slower set of bands. The fill colour between the bands also helps the user stay in a trade or exit a trade based on other confirmators.
===================================================================================================================
╔═══════ 𝗦𝗶𝗴𝗻𝗮𝗹𝘀 𝗮𝗻𝗱 𝗙𝗶𝗹𝘁𝗲𝗿𝘀 ═══════╗
Signal Type
True Ichimoku Kumo Breakout
Ichimoku traders mostly use the Kumo breakouts for trading based on several Bullish and Bearish conditions. For the sake of effective trade entries, trade entry plots for specific cloud events like Kumo twists, Tenkan Sen crossing Kijun Sen, price crossing cloud components etc have been intentionally ignored as Ichimoku traders often tend to visually trade them effectively.
Ichimoku Trade Bands Breakout
In addition to the True Kumo Breakouts, users of this script will be able to trade Ichimoku Trade Bands Breakouts. Ichimoku Trade Bands is an original ™TradeChartist model designed to detect early trend changes based on the Ichimoku settings. These bands are comprised of three plots - an upper band, a lower band and a mean line, namely and all are derived from the Ichimoku settings. The bands act as a filter and a breakout from bands' extreme boundaries signals a change in trend. The settings of the bands can be derived automatically or using manual input based on Ichimoku Cloud parameters, accessed from the indicator settings.
The Breakout Trade Entries can be further filtered by use of MA Visualizer or by using an external filter connected to the script.
===================================================================================================================
╔═════════ 𝗙𝗶𝗹𝘁𝗲𝗿 𝗦𝗲𝘁𝘁𝗶𝗻𝗴𝘀 ═════════╗
Filters are normally used to reduce noise in the Trade Entry Signals and they can be quite effective in helping the trader stay in trade and to minimize unproductive trade entries. Ichimoku Trader enables the user to use upto two trade filters - MA Visualizer and /or External Filter respectively.
Moving Averages are very effective trade filters and if the right Moving Average is used with right lookback period based on trade type and timeframe traded, they can be very effective in filtering trades.
Enabling 𝐔𝐬𝐞 𝐌𝐀 𝐕𝐢𝐬𝐮𝐚𝐥𝐢𝐳𝐞𝐫 𝐚𝐬 𝐓𝐫𝐚𝐝𝐞 𝐅𝐢𝐥𝐭𝐞𝐫 filters breakouts only when MA Visualizer agrees with the trend (which can be visualized using the fill colour between the MA Visualizer plots.
Enabling Fɪʟᴛᴇʀ Eᴀʀʟʏ Vɪsᴜᴀʟɪᴢᴇʀ Bʀᴇᴀᴋᴏᴜᴛs in addition filters breakouts even if price closed above the upper MA Visualizer plot without having to agree with fill colour.
In addition to MA Visualizer Filter, and external filter like RSI, MACD etc. can also be used by connecting to Ichimoku Trader under ╔═══ 𝗣𝗹𝘂𝗴 𝗙𝗶𝗹𝘁𝗲𝗿 𝗵𝗲𝗿𝗲 ═══ 🔌 dropdown by enabling 𝐔𝐬𝐞 𝐄𝐱𝐭𝐞𝐫𝐧𝐚𝐥 𝐅𝐢𝐥𝐭𝐞𝐫 𝐚𝐬 𝐓𝐫𝐚𝐝𝐞 𝐅𝐢𝐥𝐭𝐞𝐫. The external filter can be used as the only filter or in addition to MA Visualizer filter.
To get the external filter to work, Sɪɢɴᴀʟ Tʏᴘᴇ must be set right. For plots that are not oscillatory like Moving Averages, Super Trend etc., choose type as Non Oscillatory and for Oscillators like RSI, CCI, MACD etc., choose type as Oscillatory .
For Oscillators, levels must be specified for Fɪʟᴛᴇʀ Lᴇᴠᴇʟ ғᴏʀ ʟᴏɴɢs and Fɪʟᴛᴇʀ Lᴇᴠᴇʟ ғᴏʀ sʜᴏʀᴛs , especially if the Oscillator doesnt have 0 as mid line, like RSI. Even for 0 mid oscillators like CCI, filter levels like 100/-100 work effectively to filter noise.
Use 𝐓𝐫𝐚𝐝𝐞 𝐙𝐨𝐧𝐞𝐬 𝐁𝐚𝐜𝐤𝐠𝐫𝐨𝐮𝐧𝐝 𝐅𝐢𝐥𝐥 under 𝗨𝘀𝗲𝗳𝘂𝗹 𝗘𝘅𝘁𝗿𝗮𝘀 to paint the trade zones background. It helps visually see the effect of filters on the breakout entries and also the trade performance.
===================================================================================================================
╔═════════ 𝗨𝘀𝗲𝗳𝘂𝗹 𝗘𝘅𝘁𝗿𝗮𝘀 ═════════╗
Ichimoku Trader also includes the following useful extras
𝐓𝐫𝐚𝐝𝐞 𝐙𝐨𝐧𝐞𝐬 𝐁𝐚𝐜𝐤𝐠𝐫𝐨𝐮𝐧𝐝 𝐅𝐢𝐥𝐥 paints the trade zones in green and red as mentioned above.
Sʜᴏᴡ Hɪɢʜs ᴀɴᴅ Lᴏᴡs plots the highest highs of the Bull Zone and the lowest lows of the Bear Zone to help spot the wicks, support and resistance.
Tᴀᴋᴇ Pʀᴏғɪᴛ Bᴀʀs helps detect the volatility exhaustion prices and plots $ signs to help the trader take profits or move stop loss levels to secure gains or to reduce losses.
Vɪsᴜᴀʟɪᴢᴇʀ Cᴏʟᴏʀ Bᴀʀs paints the price bars with trend intensity and the user can opt from one of two themes under Bᴀʀ Cᴏʟᴏʀ Sᴄʜᴇᴍᴇ (Chilli and Flame).
The bar colors can be inverted by enabling Iɴᴠᴇʀᴛ Bᴀʀ Cᴏʟᴏʀs to see reverse bias with respect to the current trade direction.
===================================================================================================================
╔═════════ 𝗔𝗹𝗲𝗿𝘁𝘀 ═════════╗
Alerts can be created for Long and Short entries by using Once Per Bar Close as Alert Frequency. Entries are generated on Real time bars based on Breakout and filter conditions. It is recommended to wait for bar close before taking a position based on Ichimoku Trader Trade Entries.
The indicator does not repaint and can be confidently used for alerts and trade entries without worrying about signals disappearing.
™TradeChartist Ichimoku Trader 𝗧𝗿𝗲𝗻𝗱 𝗜𝗱𝗲𝗻𝘁𝗶𝗳𝗶𝗲𝗿 can also be connected to ™TradeChartist Plug and Trade to generate entries along with Targets, Stop Loss plots etc. Target and Stop Loss alerts can be created using Plug and Trade's Alerts system.
===================================================================================================================
There are several combinations of settings that can be tested on the security traded based on timeframe and risk/reward expectations. The indicator can be used for trade entries with filter combinations or can be used as standalone Visualizer for trend confirmations, levels etc. Following are a few examples using the Visualizer.
╔════════ 𝗘𝘅𝗮𝗺𝗽𝗹𝗲 𝗖𝗵𝗮𝗿𝘁𝘀 ════════╗
1. BTC-USDT 1hr True Ichimoku Kumo Breakout with no filters.
2. BTC-USDT 1hr Ichimoku Trade Bands (Default) Breakout with no filters.
3. BTC-USDT 1hr Ichimoku Trade Bands (Default) Breakout using 200 period Hull MA Visualizer filter.
4. AAPL 4hr Ichimoku Trade Bands (Default) Breakout using 200 period VIDYA MA Visualizer filter. Note: VIDYA is normally used for long term trades.
5. GBP-USD 5m True Ichimoku Kumo Breakout using 144 period TEMA MA Visualizer filter and Money Flow Index connected as external filter with 80/20 Filter values.
6. XAU-USD 1hr Ichimoku Trade Bands (Default) Breakout using 144 period TEMA MA Visualizer and Keltner Channels basis line as external non-oscillatory filter, connected to ™TradeChartist Plug and Trade using Ichimoku Trader 𝗧𝗿𝗲𝗻𝗱 𝗜𝗱𝗲𝗻𝘁𝗶𝗳𝗶𝗲𝗿.
7. SHITPERP 1hr Ichimoku Trade Bands (0.618 Band Width and Lookback 89 periods) using 50 period Zero-Lag EMA Visualizer Filter.
===================================================================================================================
Best Practice: Test with different settings first using Paper Trades before trading with real money
===================================================================================================================
This is not a free to use indicator. Get in touch with me (PM me directly if you would like trial access to test the indicator)
Premium Scripts - Trial access and Information
Trial access offered on all Premium scripts.
PM me directly to request trial access to the scripts or for more information.
===================================================================================================================
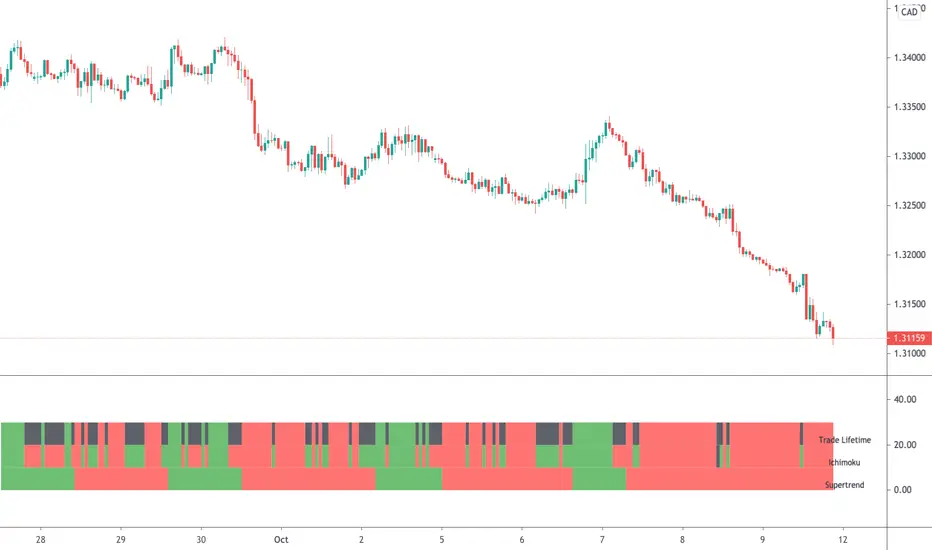
Ichimoku & Supertrend Combined StrategyOne of my mixed approach strategy indicators which include's:
- Ichimoku using much faster settings. (ECC-11)
- Supertrend
Whilst both Supertrend and Ichimoku are quite reliable, they do sometimes provide false signals. By combining both indicators, trading when both agree, it reduces the number of false alerts.
Using this indicator is simple. If the lifetime line is green then buy. If red then sell and when black don't trade. So...
Green Line - This strategy is in a buy position
Red Line - This strategy is in a sell position
Black Line - DON'T TRADE
The trader's approach is simple, when all indicators are green or red, then take the trade. As soon as one indicator changes, then re-evaluate using your normal process, such as price action, to determine whether to close the trade or continue.
There are also some alerts for opening and closing positions.
If you wish to make some changes or discuss, please don't hesitate to message me.
Ichimoku ECC-11 As an IndicatorThis indicator is based on the famous ECC-11 strategy discussed on the Internet. It can be used on any timeframe, but ECC-11 is better suited for intraday 15min charts.
The various colour lines represent:
Black - Price
Orange - Chikou
Blue - Senkou A
Red - Senkou B
Green/Red - The Clouds
More information on how to follow the Ichimoku strategy can be found here:
www.investopedia.com
The main difference between the normal Ichimoku settings and ECC-11 are these ones are more sensitive by splitting them in half. Therefore beware sudden price change can be over amplified if you're used to the normal settings.
If you wish to have any changes, modifications or add some alerts please do not hesitate to message me.

Jackrabbit.modulus.IchimokuCloudThis is Ichimoku Cloud for the Jackrabbit suite and modulus framework.
The Ichimoku Cloud is a time tested approach heralded by beginners and experts alike. This module is the purest implementation I could develop. It allows for full tunability while allowing all of the modulus framework features, including confirmation bias and differential timeframe analysis.
The Tenkan, Kijun, Sekou A, Sekou B, and Displacement are all user configurable. There is also a special aggressive setting that leverages the Ichimoku Cloud in an unique way for dollar cost averageing.
The Jackrabbit modulus framework is a plug in play paradigm built to operate through TradingView's indicator on indicatior (IoI) functionality. As such, this script receives a signal line from the previous script in the IoI chain, and evaluates the buy/sell signals appropriate to the current analysis.
This script is by invitation only. To learn more about accessing this script, please see my signature or send me a PM. Thank you.

Multi StrategyDuring the course of a trade, we can find ourselves changing strategies depending on the market. Instead of using many different templates, I have a simple indicator that clearly says "Buy", "Sell" or "Stay Out". The great thing about this approach, is we instantly observe the majority are in agreement and that decides which way to place our trade.
This indicator includes the following strategies:
- QQE
- Ichimoku using much faster settings.
- Parabolic SAR
- Supertrend
- TTM Oscillator
- The Squeeze strategy
- The Alligator Strategy
Using this indicator is simple, if the lines are mainly green then buy, if mainly red then sell OR don't trade. So...
Green Line - This strategy is in a buy position
Orange or Black Line - This strategy is undecided
Red Line - This strategy is in a sell position
There are also some green and red circles for reference that appear showing when that bar has broken through the Ichimoku cloud.
The trader's approach is simple, when all indicators are green or red, then take the trade. As soon as one indicator changes, then re-evaluate using your normal process, such as price action, to determine whether to close the trade or continue.
I can customise this further or add other strategies, please message me.

ELLIPSE: Bidirectional Swing Trading Strategy (Alert Version)This is the alert version of our original script ELLIPSE: Ultimate Bidirectional Swing Trading Strategy.
This release has the same internal algorithm as the ELLIPSE Strategy script. But instead of showing back test results, this script provides the functionality to add alerts that can notify the user via email / pop-up / sms / app once a signal is given! You must manually add these alerts via TradingView. If you need help setting up these alerts, feel free to ask in the comment box or send us a dm.
***The script is invite-only, message us to get script access***
-------------------------------------------------------------------------------------------------
User Guidelines:
The trading strategy was designed and optimized for trading cryptocurrencies only ; furthermore it works best on established cryptocurrencies that have a clear historical trend such as:
BTCUSD
ETHUSD
LTCUSD
XRPUSD
ADAUSD
The trading strategy is based on swing trading methodology. The script must therefore be used on 4h candles only .
Use USD trading pairs only (e.g. use ETHUSD instead of the ETHBTC) since the individual trend is captured more effectively and therefore gives better results.
The trading strategy is bidirectional , both long and short entries are generated.
-------------------------------------------------------------------------------------------------
Indicators used in this strategy:
Ichimoku Cloud ; acts as the leading indicator.
Volume ; without strong volume , a market move is not valid.
MACD and Vortex ; both being used as confirmation indicators.
Choppiness index ; avoids trading in choppy markets.
Simple and Exponential Moving Averages ; prevents trading against the trend.
The trading strategy is easy to use, bidirectional, trend based and without repainting, meaning once a signal has been made it is permanent and that no future data is used in the decision making. It detects the trend and filters out market noise based on more than 10 technical indicators. ONLY when all indicators align with each other the algorithm prints a LONG or SHORT signal. The trading strategy provides high probability trading signals and minimizes risk! This script aims to capture the profit from short to medium trending moves and by doing so filters out non-substantial trends and avoids the associated risks with these trades.
-------------------------------------------------------------------------------------------------
Features:
NO Repaint once candle is closed.
Stop loss feature ; set your own stop loss to manage your risks.
Customizable Display for the Ichimoku cloud indicator display.
Bidirectional ; both long and short trading positions can be enabled.
Full backtest feature ; Easily generate your own backtest results for each asset (Strategy Version Script).
Alerts ; Get notified via email / pop-up / sms / app once a signal is given! (Alert Version Script).
-------------------------------------------------------------------------------------------------
Backtest results
Below are the back test results. Only well established cryptocurrencies are displayed with a clear historical trend.
Back test results: (long and short trades, signal to signal, order size: 100% of equity, commision fee 0.1%, period: start of chart)
Exchange-----Asset---------Timeframe---Percent Profitable----Profit Factor-----Total Trades----Max Drawdown---Average bars in trade-----Net Profit
Bínance------BTCUSDT---------4H-----------------54.4---------------3.37-------------------57----------------14.9---------------------38------------------1978
Bínance------ETHUSD----------4H-----------------50.9---------------3.48------------------- 57---------------26.8----------------------37------------------3953
Bínance------LTCUSD-----------4H-----------------61.0---------------3.15-------------------59----------------20.9---------------------33------------------3098
Bínance------XRPUSD----------4H-----------------43.1---------------2.44--------------------51---------------22.4----------------------26------------------1226
Bínance------ADAUSD----------4H-----------------57.5---------------3.47--------------------47---------------34.7----------------------35------------------1233
-------------------------------------------------------------------------------------------------
Reminder: Use this trading strategy at your own risk and trade responsibly. We are not responsible for any financial loss using this strategy.
***The script is invite-only, message us to get script access***

Future Ichimoku Forecast by AP +3FUTURE ICHIMOKU FORECAST by AP Demo+3
Hi every Ichimoku Users,
Ichimoku is one of my favorite indicators, it helps me define market trends, find entry and follow. But sometime, I must predict how its lines (clouds, tenkan, kijun) will go? by handmade with lot of try and time!
Are you agree with me?
In order to forecast future Ichimoku to help your trade more easy and profitable, I create the FUTURE ICHIMOKU FORECAST by AP Demo+3 indicator free for everyone.
FUTURE ICHIMOKU FORECAST strengths:
- Forecast future +3 candles will make clouds, tenkan, kijun go!
- Help you indentify easy trend when clouds change, kijun go up or down!
- Flexible to change colors, displacement, hide/show lines in its.
- Flexible and good for every timeframe: W, D, 4H, 1H and shorter.
- Flexible and good for every currencies, gold , future and more.
Ichimoku with offset includedBased on the idea that some Donchian Channels in trading books have a lookback or offset of 1 in order to use it as a sort of trailing stop or so that the channels don't adjust. Ichimoku's Tenkan and Kijun lines have a very similar formula to Donchian Channels. In case anyone wants to use those lines as a sort of more fixed trailing stop, offset the Kijun, Tenkan, Span B, and/or treat it like Donchian Channels and such in the Ichimoku system, I included an offset of 1 as the default. To change this indicator to a standard regular looking Ichimoku, just change the offset value to 0.
The formula seems a bit different to what Tradingview has for their own version of Ichimoku but it's the same as many other programmers here. I made the colors as close to the traditional colors seen in books and other places and Tradingview as much as I could think of. Ichimoku has many different variations out there and to add the the confusion can have many different strategies to go with it. If you have any suggestions or tips, please let me know.
Dynamic Dots Dashboard (a Cloud/ZLEMA Composite)The purpose of this indicator is to provide an easy-to-read binary dashboard of where the current price is relative to key dynamic supports and resistances. The concept is simple, if a dynamic s/r is currently acting as a resistance, the indicator plots a dot above the histogram in the red box. If a dynamic s/r is acting as support, a dot is plotted in the green box below.
There are some additional features, but the dot graphs are king.
_______________________________________________________________________________________________________________
KEY:
_______________________________________________________________________________________________________________
Currently the dynamic s/r's being used in the dot plots are:
Ichimoku Cloud:
Tenkan (blue)
Kijun (pink)
Senkou A (red)
Senkou B (green)
ZLEMA (Zero Lag Exponential Moving Average)
99 ZLEMA (lavender)
200 ZLEMA (salmon)
You'll see a dashed line through the middle of the resistances section (red) and supports section (green). Cloud indicators are plotted above the dashed line, and ZLEMA's are below.
_______________________________________________________________________________________________________________
How it Works - Visual
_______________________________________________________________________________________________________________
As stated in the intro - if a dynamic s/r is currently above the current price and acting as a resistance, the indicator plots a dot above the histogram in the red box. If a dynamic s/r is acting as support, a dot is plotted in the green box below. Additionally, there is an optional histogram (default is on) that will further visualize this relationship. The histogram is a simple summation of the resistances above and the supports below.
Here's a visual to assist with what that means. This chart includes all of those dynamic s/r's in the dynamic dot dashboard (the on-chart parts are individually added, not part of this tool).
You can see that as a dynamic support is lost, the corresponding dot is moved from the supports section at the bottom (green), to the resistances section at the top (red). The opposite being true as resistances are being overtaken (broken resistances are moved to the support section (red)). You can see that the raw chart is just... a mess. Which kinda of accentuates one of the key goals of this indicator: to get all that dynamic support info without a mess of a chart like that.
_______________________________________________________________________________________________________________
How To Use It
_______________________________________________________________________________________________________________
There are a lot of ways to use this information, but the most notable of which is to detect shifts in the market cycle.
For this example, take a look at the dynamic s/r dots in the resistances category (red background). You can see clearly that there are distinctive blocks of high density dots that have clear beginnings and ends. When we transition from a high density of dots to none in resistances, that means we are flipping them as support and entering a bull cycle. On the other hand, when we go from low density of dots as resistances to high density, we're pivoting to a bear cycle. Easy as that, you can quickly detect when market cycles are beginning or ending.
Alternatively, you can add your preferred linear SR's, fibs, etc. to the chart and quickly glance at the dashboard to gauge how dynamic SR's may be contributing to the risk of your trade.
_______________________________________________________________________________________________________________
Who It's For
_______________________________________________________________________________________________________________
New traders: by looking at dot density alone, you can use Dot Dynamics to spot transitionary phases in market cycles.
Experienced traders: keep your charts clean and the information easy to digest.
Developers: I created this originally as a starting point for more complex algos I'm working on. One algo is reading this dot dashboard and taking a position size relative to the s/r's above and below. Another cloud algo is using the results as inputs to spot good setups.
Colored Bars
There is an option (off by default, shown in the headline image above) to fill the bar colors based on how many dynamic s/r's are above or below the current price. This can make things easier for some users, confusing for others. I defaulted them to off as I don't want colors to confuse the primary value proposition of the indicators, which is the dot heat map. You can turn on colored bars in the settings.
One thing to note with the colored bars: they plot the color purely by the dot densities. Random spikes in the gradient colors (i.e. red to lime or green) can be a useful thing to notice, as they commonly occur at places where the price is bouncing between dynamic s/r's and can indicate a paradigm shift in the market cycle.
_______________________________________________________________________________________________________________
Timeframes and Assets
_______________________________________________________________________________________________________________
This can be used effectively on all assets (stocks, crypto, forex, etc) and all time frames. As always with any indicator, the higher TF's are generally respected more than lower TF's.
Thanks for checking it out! I've been trading crypto for years and am just now beginning to publish my ideas, secret-sauce scripts and handy tools (like this one). If you enjoyed this indicator and would like to see more, a like and a follow is greatly appreciated 😁.
